
How to Analyze Market Trends in Banking
Brian's Banking Blog
Aggregate deposits at commercial banks reached a historical high of $19.5 trillion by February 2026, according to the Federal Reserve's June 2026 banking system conditions report (Federal Reserve banking system conditions report). That's a useful market fact. It's also the wrong starting point for most executive decisions.
A bank doesn't price deposits, reallocate calling effort, or tighten concentration limits because the industry posted a headline. It acts when a trend is proven relevant to its own peer set, geography, product mix, and risk appetite. That distinction is what separates informed strategy from expensive overreaction.
That's why how to analyze market trends in banking has to move beyond headline-watching. The discipline is closer to evidence review than news interpretation. You define the decision, gather the right internal and external series, separate trend from seasonality and noise, validate the signal against independent sources, and only then convert it into monitored action. That stepwise approach is explicit in practical guidance on market-trend analysis because it reduces the risk of acting on correlation, stale data, or anecdote (market trend analysis process guidance).
The Executive's Real Question Behind Market Trends
In the first quarter of 2026, U.S. banks reported $80.5 billion in quarterly net income, up $2.8 billion, or 3.6%, from the prior quarter, while domestic deposits increased for the seventh consecutive quarter, rising $389.7 billion, or 2.1% (FDIC Quarterly Banking Profile remarks). Those are strong industry markers. They still don't answer the question your leadership team has to resolve this quarter.
The question is narrower and harder: which trends materially change our bank's pricing, growth, or risk posture right now. A CFO needs to know whether deposit growth is broad-based or concentrated in a few institutions. A CRO needs to know whether favorable asset quality is masking emerging pressure in specific portfolios. A commercial leader needs to know whether peer weakness in a target market creates a prospecting window or just reflects a broader slowdown.
What executives actually need to know
The operating problem isn't a lack of data. It's the mismatch between sector headlines and institution-level decisions. Moody's summary of McKinsey's global banking review captures that tension well. Funds intermediated by the financial system rose by $131 trillion from 2020 to 2025, reaching $468 trillion in 2025, and net income reached $1.3 trillion, up 7% from 2024, yet banks still trailed other industries by nearly 70% on valuation (banking industry 2025 round-up). Macro strength and investable opportunity aren't the same thing.
Headline momentum doesn't tell you where your next basis point of margin or next dollar of core funding will come from.
That's why market intelligence in banking has to be framed as peer-relative validation, not commentary. Executives need evidence that links external movement to bank-specific choices. A useful overview of that distinction sits in Visbanking's discussion of market intelligence for financial institutions.
Headline Trends vs. Bank-Specific Decision Signals
| Headline Trend | Bank-Specific Decision Signal | Action It Supports |
|---|---|---|
| Industry deposits are rising | Your peer cohort is gaining lower-cost deposits faster than your bank | Reprice products, adjust branch goals, review treasury sales focus |
| Banking earnings improved | Your margin is moving differently than similarly situated institutions | Revisit funding mix and securities strategy |
| Loan growth remains positive | Competitor loan growth in your footprint is concentrated in one product | Redirect calling effort or tighten underwriting in that niche |
| Asset quality is generally favorable | Early stress is appearing in a portfolio segment relevant to your bank | Escalate watchlist review and concentration monitoring |
The shift in mindset
Executives don't need more trend summaries. They need a defensible answer to a more practical question: which external developments should change our decisions, and which should be ignored. That standard forces discipline. It also changes the order of work. You don't start with the chart everyone is discussing. You start with the decision you have to make, then gather the data that can validate or reject the premise.
Stitch Together the Right Data Sources
Most weak trend work fails before the analysis begins. The failure is usually source selection. Teams rely on one dataset, one regulator release, or one peer deck and then try to infer too much from it.
In banking, no single source can carry that load. You need a stitched evidence base.
Start with regulated financial statements
Quarterly call reports, including FFIEC 041 and 031, are the base layer for most bank trend analysis. They provide line items for loans, deposits, securities, noninterest income, funding costs, capital, and reserve positioning. If the question concerns what banks booked, call reports are the cleanest foundation.
UBPR adds a different value. It normalizes performance into comparable ratios and makes peer work faster. If you want to see whether a shift reflects your own execution or a broader cohort pattern, UBPR is usually more useful than raw statements alone.
For credit unions, NCUA 5300 serves a similar role. If your market includes both bank and credit union competition, excluding that data creates blind spots in consumer and small business trend work.
Add local market and product-level context
HMDA helps when the discussion is mortgage mix, application pullback, borrower profile changes, or local origination emphasis. It won't answer a funding question, but it can explain why production or fee trends differ by market.
FDIC Summary of Deposits gives branch-level deposit positioning. That matters because institution-level totals can hide local share shifts. A bank may look stable at the company level while losing household and small business funding in a specific county.
Holding company filings, including Y-9SP where relevant, provide parent-level context. For some boards, that context matters as much as charter-level performance, especially when dividends, capital support, or strategic flexibility sit above the bank.
Layer macro and management commentary
Macro series belong in the stack, but only if they have a clear decision use. Treasury yields help when you're analyzing pricing pressure, duration sensitivity, or likely deposit repricing behavior. Employment and regional real estate indicators matter when a market's credit posture is the issue.
Public filings matter for a different reason. 10-K and 10-Q commentary can reveal management tone, stated priorities, and known pressure points before they show up fully in ratio trends.
Practical rule: Use one source to measure the result, another to explain the result, and a third to test whether the explanation holds.
Why stitching matters
Modern trend analysis increasingly depends on breadth and comparability, not isolated annual snapshots. Research platforms now offer 17+ years of comparable always-on tracking, while another outlook product projects consumer spending across 190+ countries through 2036 (consumer trends and tracking overview). The banking lesson is straightforward. Cross-period and cross-market comparability makes signals more interpretable.
Visbanking's multi-source data integration approach reflects that same operating reality. Call reports, UBPR, NCUA, HMDA, filings, and macro series answer different questions. The value appears when they're aligned around one decision.
Choose Indicators and Decompose the Signal
A common mistake in trend analysis is confusing data abundance with analytical rigor. Banks can access thousands of fields. That doesn't mean those fields belong in the same decision memo.
The indicator set should be narrow and decision-linked. If the decision is deposit pricing, your core indicators might include deposit growth, mix shift toward interest-bearing balances, funding cost movement, and branch-level share changes. If the decision is CRE risk posture, you need a different set entirely.
Start with one decision and a small indicator set
A useful discipline is to write the decision in one sentence before selecting any series. For example: Should we defend deposits with pricing, or can we protect margin by targeting at-risk customer segments first? That immediately narrows the field.
Then decompose each chosen series into three parts:
- Trend: The persistent movement over time.
- Seasonality: The recurring calendar pattern.
- Residual: The unexplained remainder that may signal an event, anomaly, or measurement issue.
Rolling medians often help with the trend component because they reduce sensitivity to one noisy quarter. Seasonal differencing helps when quarter-end or tax-cycle effects distort raw comparisons.
A banking example that often misleads
Consider a chart of interest-bearing deposit beta against the effective federal funds rate across eight quarters. The raw line may suggest management is lagging peers or overpaying for funds. That conclusion may be wrong.
If the bank has a seasonal municipal deposit pattern, or if the peer set contains institutions with very different business mixes, the unadjusted chart can create a false operating story. Once you isolate the recurring seasonal pattern and weight the peer set more carefully, the apparent divergence may narrow materially. The implication for management is important. A pricing issue may be a mix issue.
Validate the residual before acting
Residuals are where many promising trend calls fail. An unusual move isn't automatically an actionable one. Before an alert enters production, validate it against at least two outside checks:
- One structural source. For deposits, branch-level share data is useful. For lending, product or geography-specific filings may help.
- One market-implied source. Use a forward-looking or high-frequency market signal as a challenge function, not a verdict.
The discipline is simple. If a residual can't survive an independent cross-check, it's not ready to influence pricing, prospecting, or risk limits.
Think in time series, not snapshots
Long-run historical context matters because trend interpretation improves when repeated observations replace one-point comparisons. Commercial datasets now cover 60+ countries, up to 30 years of historical data, and 84,000+ lines of standardized indicators across income, spending, demographics, and retail categories (historical consumer and retail dataset overview). The principle carries directly into banking. You learn more from a repeated series than from a single quarter, especially when trying to separate cyclical noise from structural change.
Add Predictive Techniques Without Overfitting
Prediction is where discipline usually breaks down. Teams move from sound descriptive analysis to weak forecasting because the model looks advanced, the chart looks smooth, and the output feels more decisive than the underlying evidence warrants.
The fix isn't to avoid prediction. It's to narrow its role.
What belongs in the predictive layer
Short-horizon methods tend to hold up best for banking operating questions. For baseline deposit and loan growth, straightforward time-series approaches such as ARIMA or exponential smoothing are often enough. Their strength isn't glamour. It's transparency.
Peer-relative deviation scoring is useful for a different reason. It flags when an institution has broken from its own historical pattern or from a relevant cohort. That's often more actionable than a point forecast alone because it tells management where to investigate.
Leading-indicator composites can also help if they remain simple. A composite built from curve shape, employment conditions, and portfolio stress indicators can be a useful early warning input. It shouldn't substitute for judgment.
How to validate without fooling yourself
Use out-of-sample windows. Keep the forecast horizon short. Judge the model on errors executives can understand, such as mean absolute error and directional accuracy.
Market-based signals deserve a seat at the table, but not unchecked authority. A well-known working paper found that market-based forecasts were more accurate than survey-based forecasts across all series studied, reducing forecast errors by about 5.5% of the average prior-decade error (prediction market forecasting paper). That supports a practical rule for banks: use market-implied information as a high-frequency input, then validate it against independent banking data before changing policy or calling plans.
Predictive Technique Selection by Use Case
| Use Case | Recommended Technique | Validation Metric |
|---|---|---|
| Quarterly deposit growth baseline | ARIMA or exponential smoothing | Mean absolute error |
| Detect a peer break from normal behavior | Peer-relative deviation scoring | Directional accuracy |
| Early warning for local credit deterioration | Simple leading-indicator composite | Directional accuracy and analyst review |
| Management planning scenarios | Range-based forecasting with explicit assumptions | Forecast error review by quarter |
A useful reference for this discipline is Visbanking's work on machine learning model validation. The executive standard should be clear. If a model can't explain what it's seeing, where it fails, and how often it missed in prior windows, it doesn't belong in an ALCO or credit committee packet.
Build Monitoring and Alerting That Holds Up
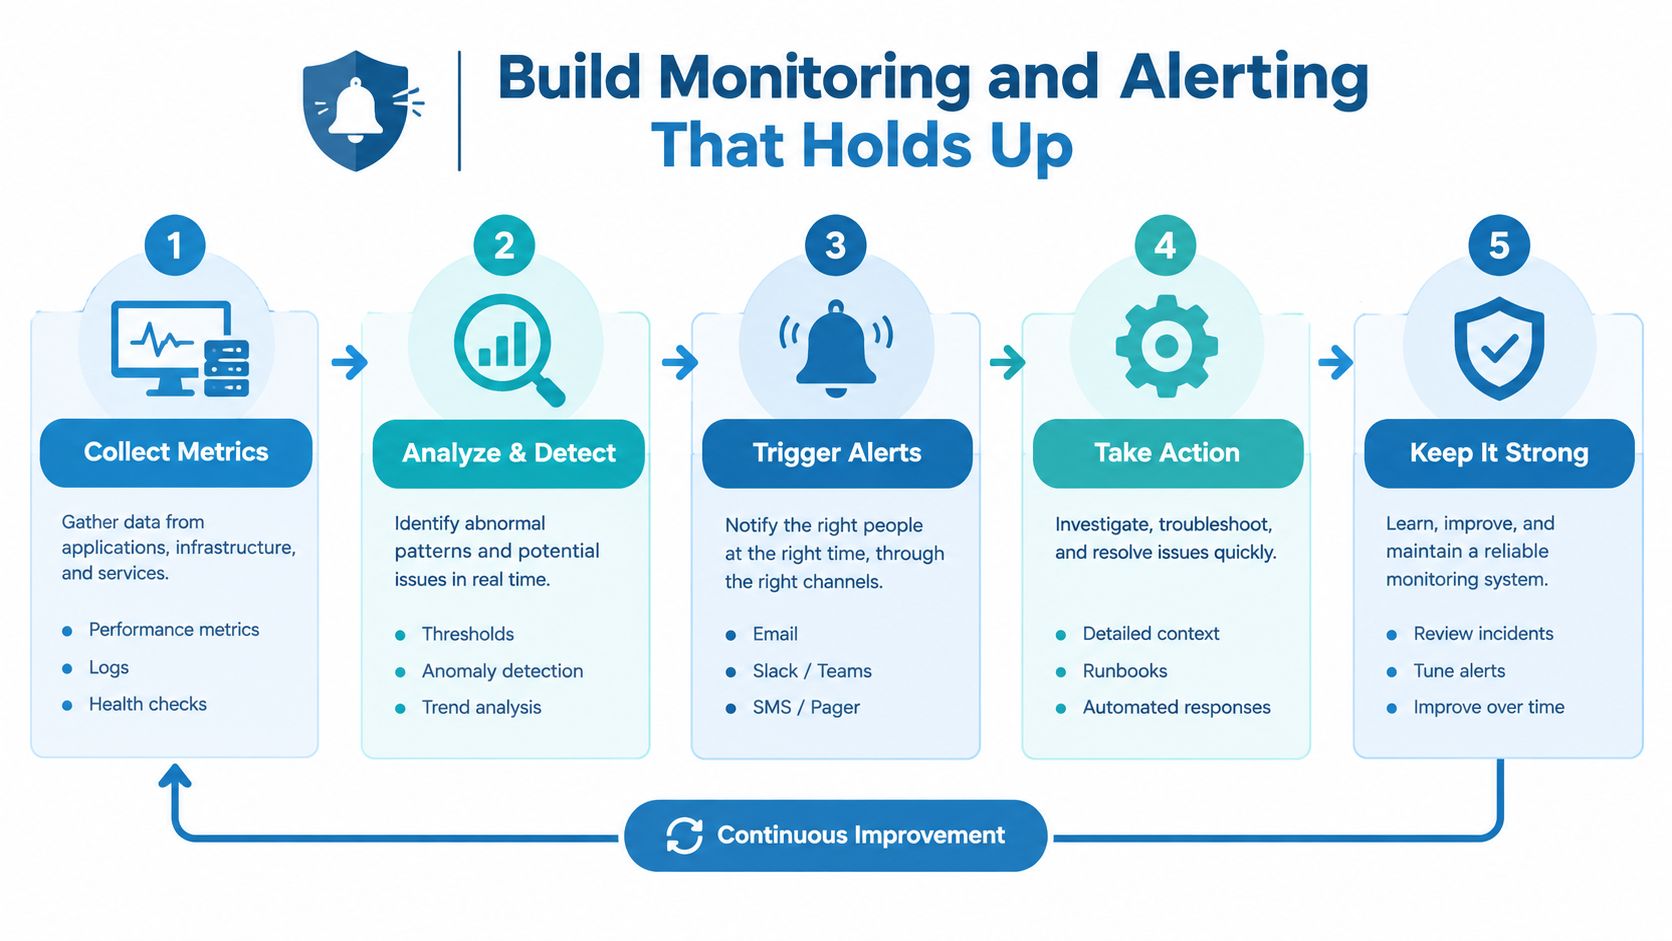
A trend model has no operating value if it reaches the wrong team, arrives too late, or lacks context. That's where many analytics programs stall. The signal exists, but the institution hasn't turned it into a decision system.
Define cohorts before thresholds
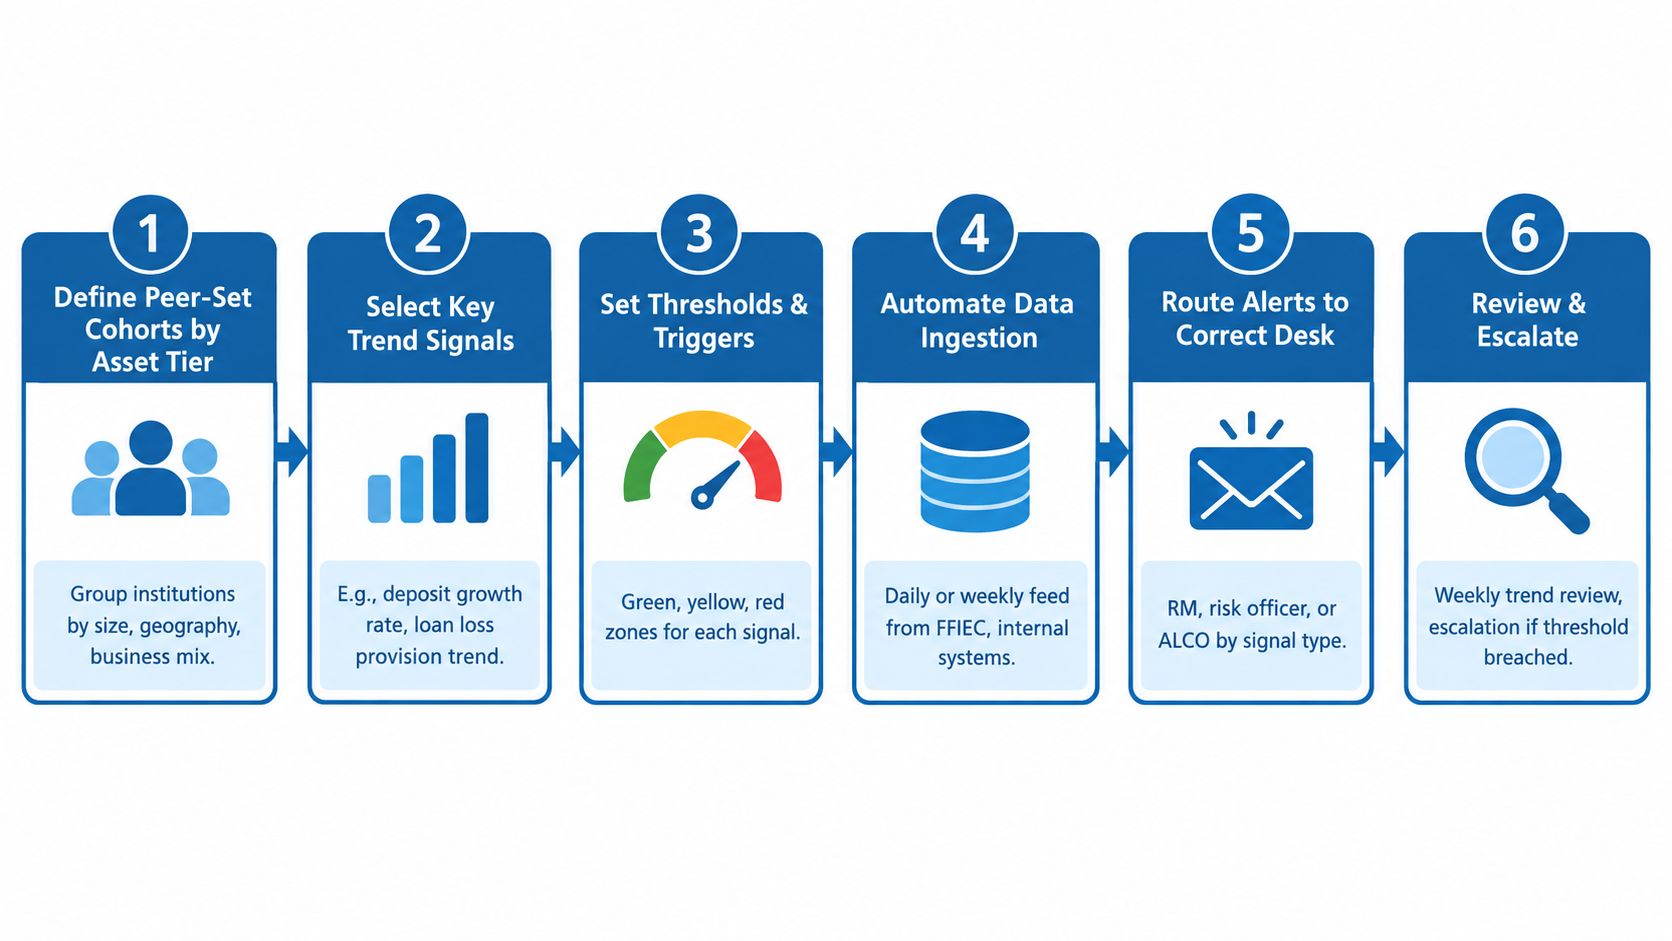
Alerts should be cohort-specific. Asset size, charter type, geography, and business mix all matter. A movement that's ordinary for one peer set can be material for another.
Broad market context helps. The FDIC's 2026 Risk Review noted that loan growth remained well below pre-pandemic levels and that asset quality stayed generally favorable despite weakness in certain portfolios, while unrealized losses remained high (FDIC 2026 Risk Review). An alerting framework should reflect that mixed picture. Institutions need signals that pair earnings momentum with duration and portfolio stress, not a one-dimensional profitability dashboard.
Use two kinds of thresholds
Absolute levels matter. Momentum matters too. Good alerting systems use both.
Examples include:
- Absolute deviation: A bank's funding cost or beta diverges from its direct peer cohort beyond a pre-set tolerance.
- Relative momentum: Loan or deposit growth accelerates or decelerates versus the institution's own recent history.
- Cross-signal conflict: Earnings look stable, but balance-sheet or risk indicators begin to move in the opposite direction.
A useful benchmark for this type of monitoring is the current operating backdrop. The FDIC reported that total loans at insured institutions increased by $215 billion, or 1.6%, in Q1 2026, with annual loan growth at 7.1%, while the net interest margin slipped to 3.31% (FDIC Quarterly Banking Profile PDF). That combination is exactly why alerting has to compare growth and margin together.
Route alerts to named owners
An alert should always answer three questions: who owns it, what threshold was breached, and what action is expected next.
- Relationship managers should receive deposit and treasury movement alerts tied to household or commercial funding opportunities.
- Credit leaders should receive concentration and portfolio migration alerts.
- Treasury and ALCO should receive margin compression and funding mix alerts.
Board-level takeaway: An alert without an owner is only a notification. It isn't governance.
Context is part of the signal
The alert should include peer comparisons, time-series history, and likely drivers. A number alone forces the analyst to reconstruct the story under meeting pressure. That wastes time and increases the odds of misinterpretation.
For executives, the goal isn't more alerts. It's fewer alerts with enough context that someone can act before the next committee cycle.
Turn Trend Signals into Sales and Risk Decisions
Nearly every bank can point to a trend deck. Far fewer can show which signal changed a target list, tightened a credit box, or justified a pricing exception.
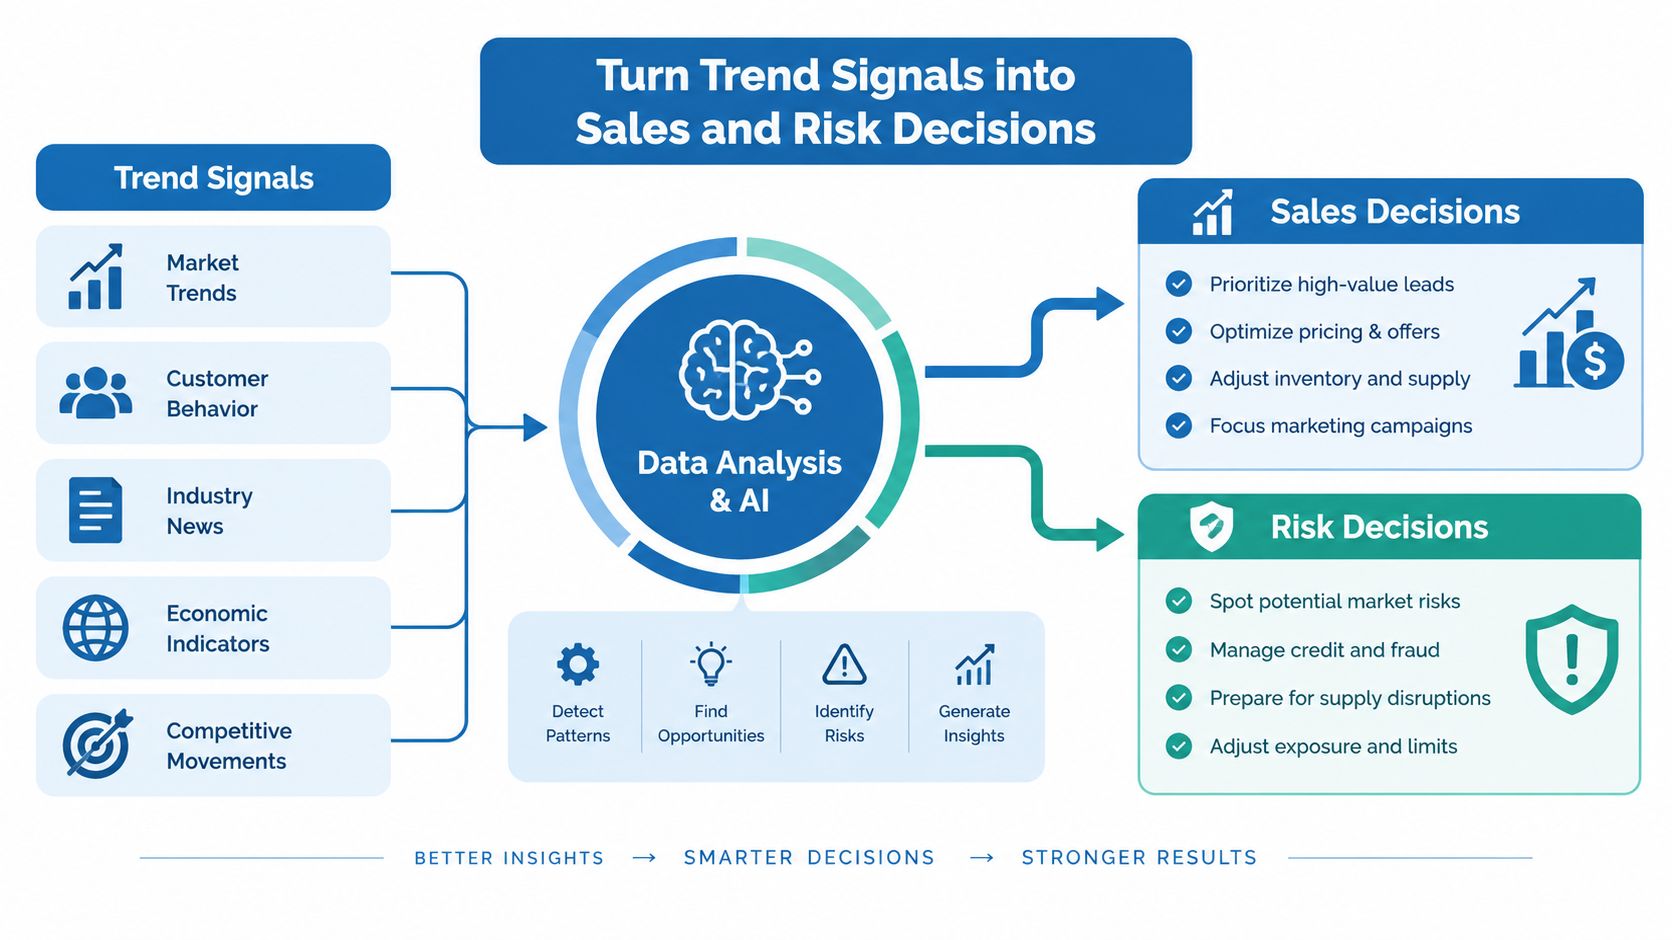
The distinction matters because headline trends rarely map cleanly to bank-level action. An evidence-grade process tests whether a change is visible in call reports, plausible in local macro conditions, and consistent with management commentary in filings. Only then should it influence prospecting, pricing, or portfolio posture.
Sales decisions
A middle-market banker does not need a broad summary of sector sentiment. That banker needs to know whether a specific competitor is losing funding flexibility, pulling back from a product set, or reshuffling leadership in a way that creates account-level openings.
That conclusion usually requires several sources at once. Call report data can show whether a peer is growing loans faster than deposits or absorbing margin pressure. Branch-market data can indicate whether that peer is gaining or losing presence in the counties that matter to your team. Public filings and earnings commentary can clarify whether management is choosing to retrench, reprice, or redirect capital. Customer and CRM data then determine whether your bank has a credible route into the account.
The final output should read like a decision memo. It should name the peer under pressure, explain why the pressure is likely to matter commercially, identify the segment most exposed, and assign the next sales action.
Prospecting decisions
Prospecting has a higher evidentiary bar than general trend analysis. A pattern is useful only if it points to demand your bank can serve and to prospects where your right to win is defensible.
That is why peer benchmarking matters more than headline momentum. If commercial real estate balances are rising across a region, the signal is still incomplete. The more useful question is whether growth is concentrated at a few banks, whether funding costs are rising with it, and whether filings suggest tighter credit terms ahead. In that case, the opportunity may sit with clients who will soon face repricing or slower responsiveness from incumbent lenders.
Recent guidance on market-gap analysis supports that narrower approach. The stronger method is to validate candidate opportunities with date-stamped evidence, group unmet needs from observed behavior, and refresh the work on a recurring basis rather than treating it as a one-time exercise (2025 guidance on finding market gaps).
A practical prospecting memo should include:
- Observed shift: The change in the peer set, product mix, or local market.
- Evidence trail: The call report, filing, macro, and internal relationship inputs that support the conclusion.
- Right to win: Why your bank can respond better on speed, structure, pricing, or treasury capabilities.
- Commercial action: Which accounts, sectors, or calling officers move first.
Risk decisions
Risk teams need the same discipline, but the question is different. The objective is not to find the next sales opening. It is to determine whether a visible market change should alter underwriting, concentration tolerance, monitoring intensity, or pricing.
Strong system-level performance does not remove that need. A favorable quarter for the industry can still mask pressure in office exposure, indirect consumer portfolios, or fast-growing commercial books in specific geographies. Executive teams should therefore test whether peer deterioration is showing up in banks with similar footprints, borrower mixes, and funding structures rather than assuming broad averages apply to their own portfolio.
A sound risk memo does three things well:
- Separates system conditions from bank-specific exposure.
- Compares your portfolio with a relevant peer set, not a national average.
- Recommends a measured response tied to the evidence, such as tighter structure, added review, or revised pricing.
That is where trend analysis starts to earn credibility with credit committee and line leadership. It stops being a record of what moved and becomes a basis for where the bank should pursue growth, where it should defend margin, and where it should accept less volume in exchange for better risk quality.
From Dashboards to Decisive Action
Most executive teams already have dashboards. What they usually lack is an evidence-grade workflow behind them.
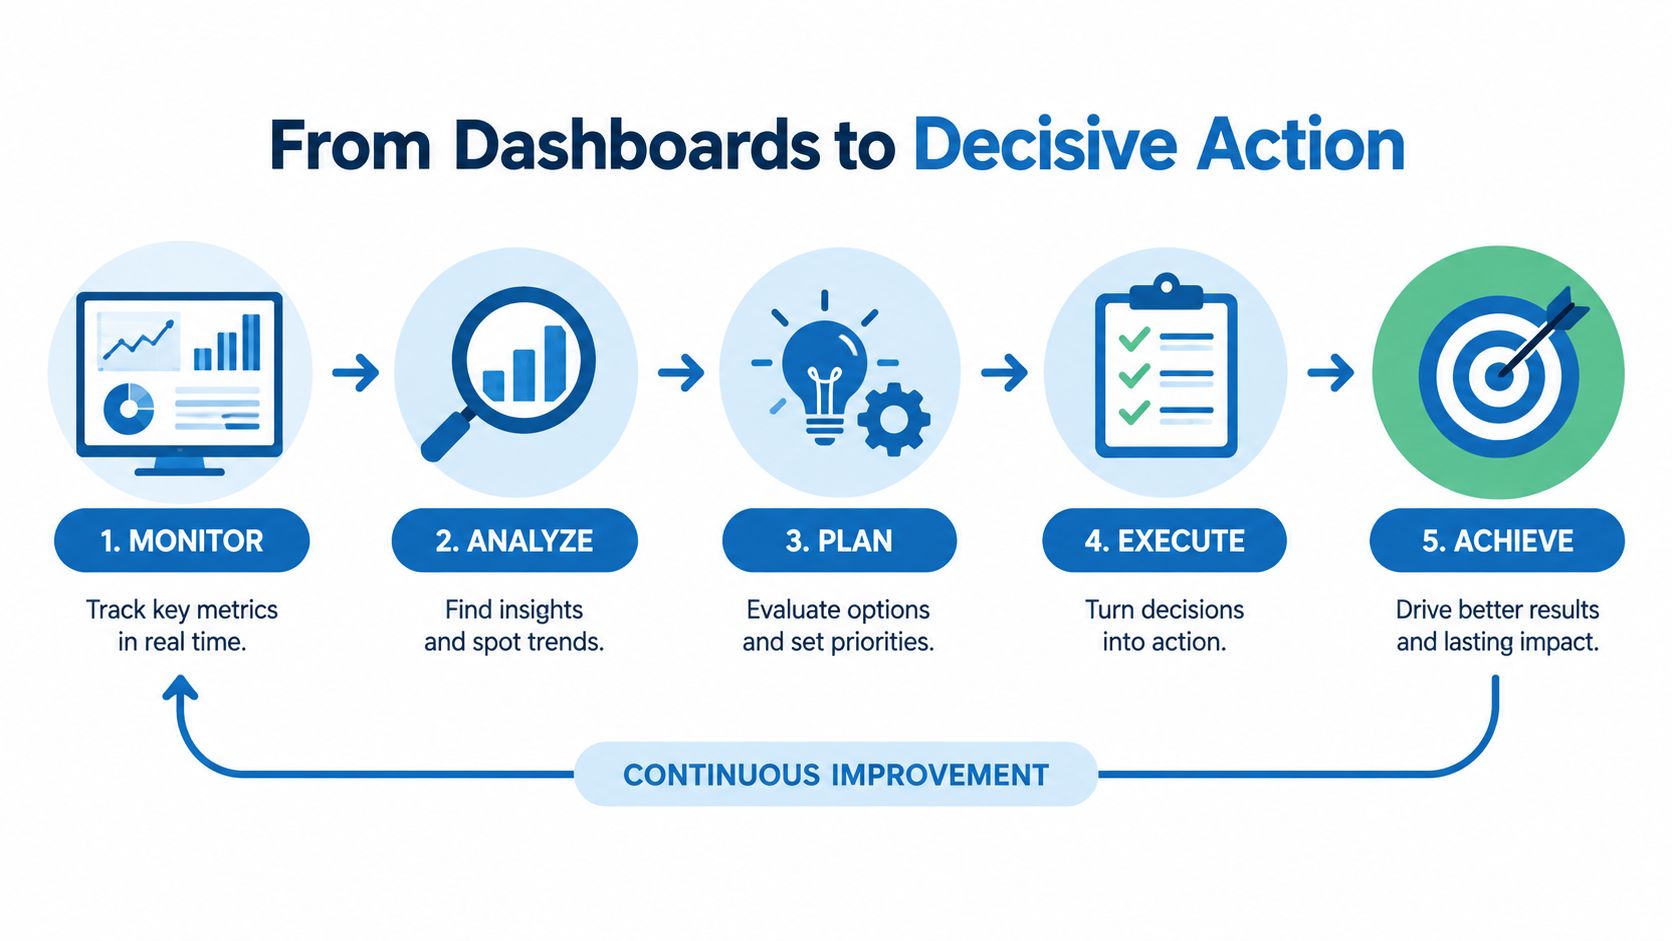
A sound workflow has four traits. It defines trigger thresholds in advance. It assigns owners before the signal fires. It links each trigger to an approved response playbook. It records whether the alert led to a measurable action that later proved useful or not. That last step matters because trend analysis improves only when institutions learn which signals were predictive and which were noise.
By contrast, many banks circulate every interesting peer move to senior leadership. That trains the room to ignore the feed. Executives stop seeing a distinction between a validated change in competitive position and another chart that happened to move.
If your team wants to create dashboards that drive decisions, the design principle is simple. Build around decisions first, not display density. A trend dashboard should answer who needs to act, on what, by when, and based on which evidence.
An operational system matters. The methodology only compounds when call report data, macro context, filings, peer benchmarks, prospecting workflows, and alerting logic live in the same environment. Used that way, Visbanking functions as an execution layer for bank intelligence: it unifies multi-sourced banking data, supports peer benchmarking and historical analysis across 4,600+ institutions from the past decade, and connects those insights to forecasting, alerts, and workflow-ready outputs for performance, prospecting, talent, and risk review.
Visbanking gives banks and credit unions a practical way to apply this discipline with unified regulatory, market, filing, and people data tied to benchmarking, forecasting, alerts, and action workflows. If you want to turn market trend analysis into a repeatable system for prospecting, performance review, and risk oversight, visit Visbanking.
Latest Articles

Brian's Banking Blog
How to Manage Vendor Relationships in Banking

Brian's Banking Blog
ISO 20022 Migration Strategy for Bank Leaders

Brian's Banking Blog
Lead Tracking Software for Banks: An Executive Guide

Brian's Banking Blog
What Are Key Metrics for Banks? a Decision Guide

Brian's Banking Blog
Customer Feedback Surveys: A Playbook for Banks

Brian's Banking Blog