
Customer Feedback Surveys: A Playbook for Banks
Brian's Banking Blog
A 31.81% average customer-feedback survey response rate still means that roughly two-thirds of invited customers didn't respond, based on a 2025 platform benchmark reported by Hello Customer. For a bank, that isn't a minor measurement issue. It means leadership may be hearing from the customers most motivated to answer, while silent customers carry the retention, cross-sell, and service-risk signals the bank needs most.
A survey is not successful because it produces a large number on a dashboard. It succeeds when the bank can show that the sample represents the customers it serves, the questions isolate a decision, and the answers trigger an accountable action. The operating standard should be simple: measure the right customers, ask about the right outcome, and route the signal before its commercial value decays.
Why Most Bank Surveys Quietly Mislead Leadership
A high response rate can still produce a misleading executive read. A digitally active, affluent panel may respond readily while branch-primary households, older customers, rural members, or customers with limited digital access remain underrepresented. The headline score can look stable while the customers most exposed to service friction are absent.
The American Customer Satisfaction Index offers the more durable model. Developed by researchers at the University of Michigan with the American Society for Quality and CFI Group, ACSI was introduced in the United States in 1994 after earlier work on Sweden's 1989 Customer Satisfaction Barometer. Its baseline study, conducted from May 10 to July 22, 1994, covered 7 economic sectors, 30 industries, and 180 companies, with an overall score of 74.5 on its satisfaction scale. Its value came from standardized questions, sampling, scoring, and timing that allowed results to be compared across companies and industries, as documented in this Cornell-hosted history of ACSI.
The four decisions that matter
Bank executives should treat customer feedback surveys as measurement instruments, not loyalty trophies. The program needs four connected disciplines:
- Question design: Ask about a defined interaction and one construct, such as resolution quality, effort, trust, or digital reliability.
- Response mechanics: Record who was invited, who responded, who abandoned the survey, and which segments are missing.
- Resolution measurement: Separate successful issue resolution from the quality of the channel or interaction.
- CRM and model integration: Convert a response into a service task, retention signal, relationship opportunity, or risk alert.
Net Promoter Score can remain a useful relationship indicator, but it shouldn't carry the board conversation by itself. A score becomes commercially useful only when leaders can connect it to account tenure, product holdings, service events, attrition, and subsequent behavior.
| Metric Reported | What Executives Assume It Means | What It Often Misses | Banking Decision It Should Inform |
|---|---|---|---|
| Response rate | The survey reflects customer opinion | Which segments didn't respond | Whether weighting, alternate channels, or targeted outreach is required |
| NPS | Customers will stay and recommend | The reason for sentiment and the affected product | Retention treatment, relationship-manager outreach, or cross-sell timing |
| CSAT | The bank delivered a good experience | Whether the underlying issue was actually resolved | Process redesign and service-recovery priorities |
| Completion rate | The questionnaire worked | Item-level refusal and breakoff patterns | Question removal, mobile redesign, or compliance review |
| Open-text volume | Customers are engaged | Whether comments are actionable or duplicated | Theme routing, root-cause analysis, and owner assignment |
Board standard: Never approve a customer-experience conclusion without seeing the responding sample beside the invited population.
Designing Survey Questions Banks Can Actually Act On
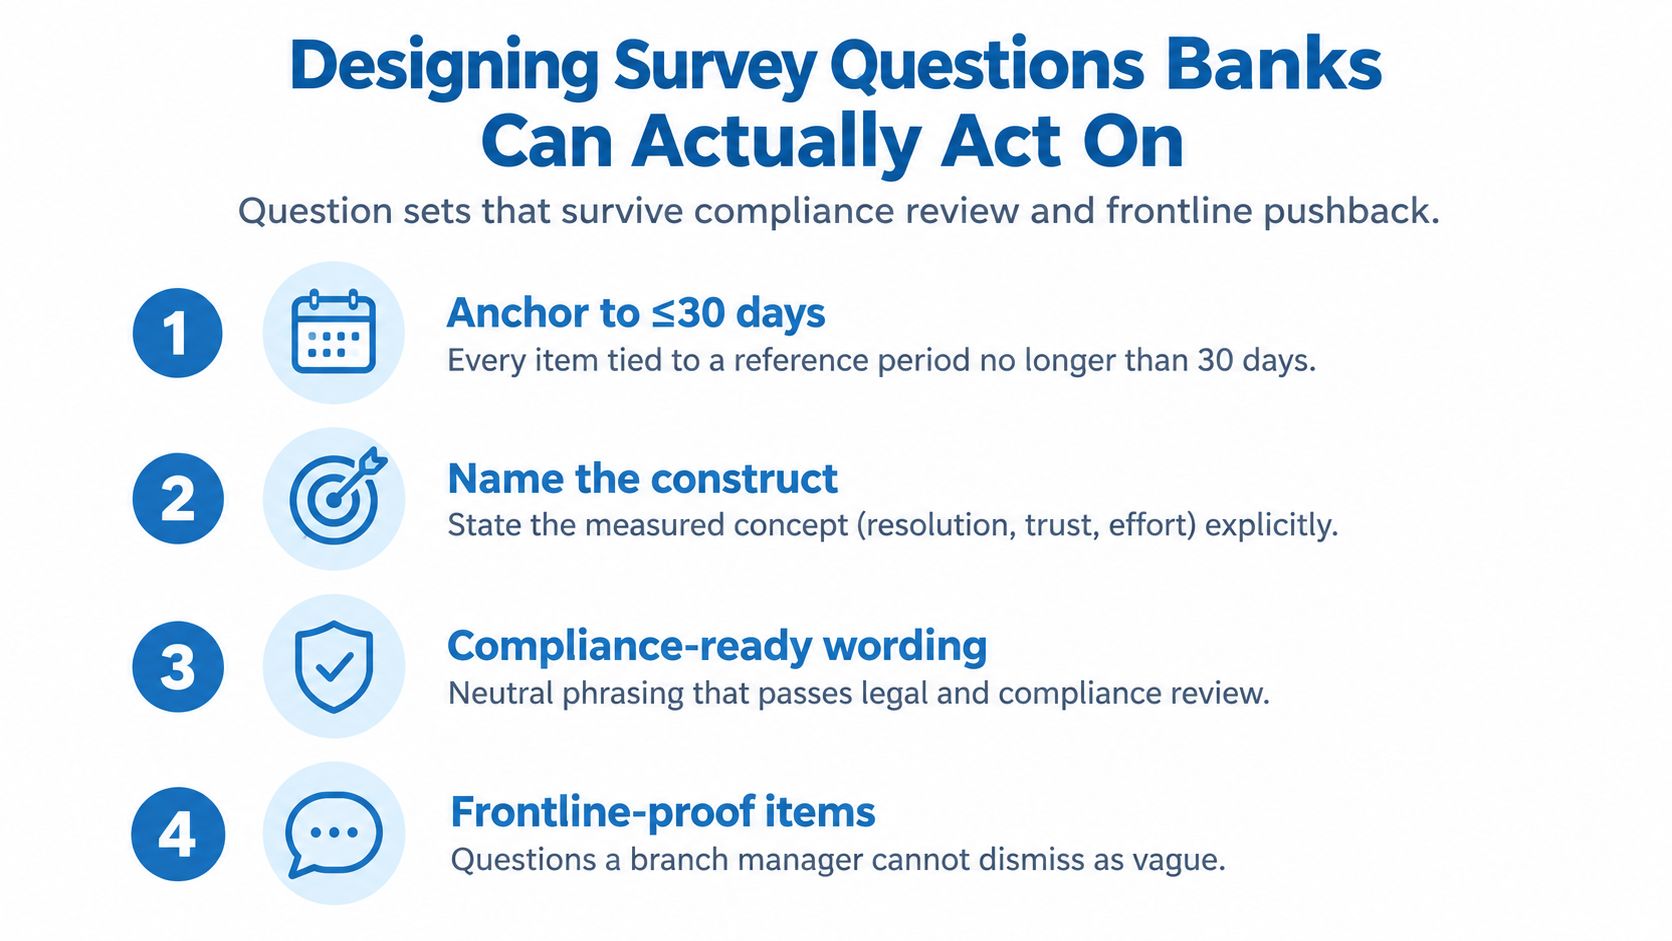
A bank should reject any question that doesn't map to a documented decision, CRM action, or risk signal. Start with a narrow reference period, such as the customer's most recent interaction with the bank, and keep the item tied to a recent event. A customer can reliably assess a dispute conversation or mobile-deposit attempt. They're less likely to give a useful answer about an undefined “overall service quality.”
Name the construct directly. Ask about resolution quality, customer effort, trust, digital reliability, or fee fairness rather than combining several ideas in one sentence. AAPOR and government questionnaire guidance recommends plain language, one concept per item, balanced wording, reduced memory demands, and explicit “don't know” or “prefer not to answer” options where uncertainty or sensitivity is likely. The government survey-technique guide also highlights common errors such as double-barreled questions, leading wording, negative constructions, and forced answers.
A bank-ready question set
A mid-size bank can deploy the following set after a defined interaction, adjusting only the product or event reference:
- Thinking about your most recent interaction with us, how easy was it to complete your task? Use a calibrated scale with clear endpoints.
- How satisfied are you with the resolution of your request?
- Was your request fully resolved during this interaction? Include “yes,” “no,” and “not sure.”
- How would you rate the representative's understanding of your situation?
- How clear was the information you received about fees, rates, or next steps?
- Which channel did you use, and would you choose the same channel next time?
- What was the main reason for your rating?
- Would you like a member of our team to follow up? Include a clear consent choice.
Use a five-point scale when management needs operational consistency, or a 0–10 scale when the bank has a defined reason to compare with an established relationship metric. Don't force a customer to answer a question that doesn't apply. Randomize answer options when order effects are plausible, but preserve logical order for scales and time sequences.
The open-ended item should be optional and should warn customers not to include account numbers, balances, credentials, or other sensitive information. Route low-sentiment comments to service recovery and high-value relationship opportunities, while keeping the collection and handling process aligned with privacy obligations, including the Gramm-Leach-Bliley Act and the bank's safeguards controls. The Visbanking customer-service survey guidance provides a practical reference for structuring NPS, CSAT, CES, diagnostic follow-ups, and optional open text.
Response Mechanics That Survive a Board-Level Audit
Response quality starts with the denominator. A board should know how many records were sampled, how many invitations were delivered, how many customers opened or started the survey, how many completed it, and how many abandoned it. A single “1,200 responses” figure hides too much to support a material retention or service decision.
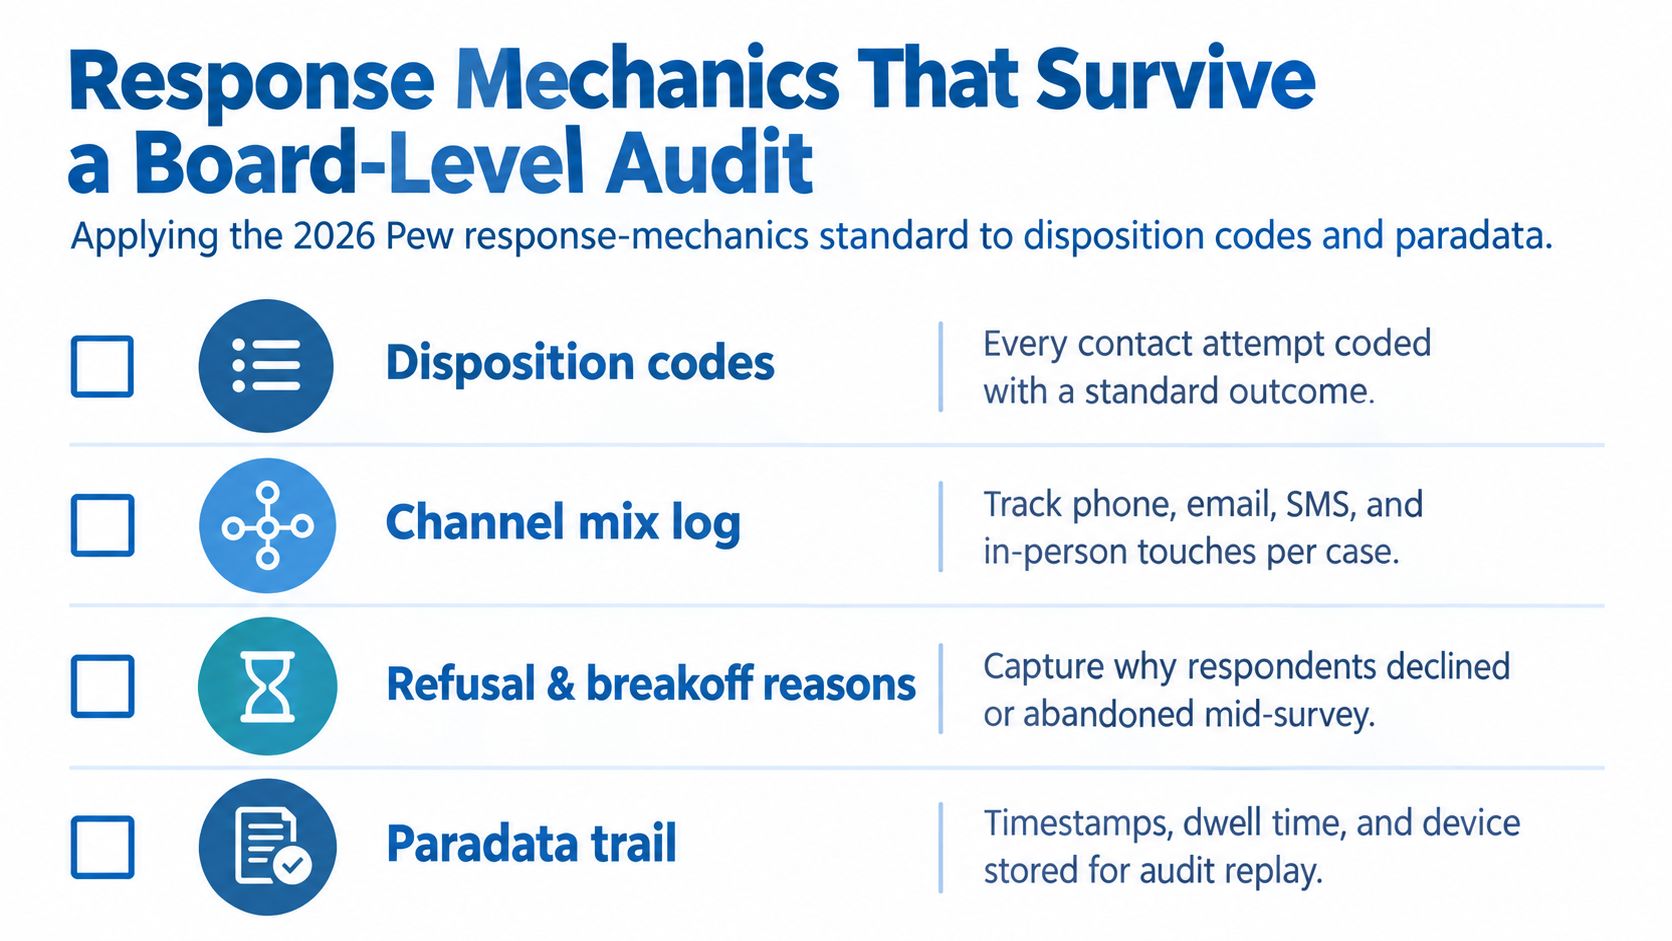
Pew Research Center's methodology for a 2026 American Trends Panel survey illustrates the discipline required. The survey reported 8,512 respondents from 9,302 sampled panelists, a 92% survey-level response rate, a 3% cumulative response rate after accounting for recruitment and attrition, and a 2% break-off rate among people who began the questionnaire. It used online self-administration and live telephone interviewing, in English and Spanish, and tested the web questionnaire on both PC and mobile devices. The Pew methodology report shows why invitation response, completion, recruitment, attrition, and breakoff should never be collapsed into one number.
The audit checklist
Disposition codes should be record-level data. Store delivered, bounced, opened, started, completed, partial, refused, and unreachable outcomes in a standard taxonomy. A bank should also record the invitation channel, contact attempt, timestamp, and relevant service event.
Paradata should explain behavior. Capture breakoff location, time spent, device type, and item-level nonresponse. A high completion rate can still conceal systematic refusal on pricing, trust, complaints, or data-governance questions.
Segment comparisons should precede executive reporting. Compare respondents with the sampled population by institution size, customer role, product usage, market, relationship tenure, channel usage, and engagement level. If an important segment responds at materially lower rates, investigate the gap and weight results where appropriate.
The analysis plan should be fixed before launch. Define the primary metric, expected unit and item response rates, inclusion rules, weighting approach, and escalation conditions in advance. AAPOR recommends standardized response-rate formulas and warns that response rate alone cannot establish data accuracy. Its survey-methods report also supports nonresponse-bias assessment when participation is weak or key items are frequently skipped.
A reminder cadence is not enough. Pair each deployment with a refusal-conversion test, such as a shorter questionnaire, a different contact mode, or a targeted call to a randomly selected group of nonrespondents. The objective isn't to chase a prettier rate. It's to learn whether the absent customers would change the decision.
Measuring Resolution, Not Just Touchpoints
A customer can praise a representative and still leave with an unresolved problem. That's why a survey captured immediately after contact can overstate performance when it measures courtesy, speed, or channel experience without asking whether the customer achieved the intended outcome.
Deloitte's 2026 Global Contact Center Survey found that 71% of banking customers ranked ease of resolving an issue among their three most important support factors, ahead of fast response times at 63% and a positive support experience at 52%. The same Deloitte banking contact-center research reported that 51% recommended their bank after positive service experiences, while 28% reduced spending and 31% stopped doing business with the institution after repeated negative contact-center experiences.
Four constructs belong on the same page
Measure these separately instead of hiding them inside one composite satisfaction score:
- First-contact resolution: Did the bank resolve the request during the initial interaction?
- Time to resolution: How long did the customer wait for the completed outcome?
- Resolution durability: Did the customer need to contact the bank again about the same issue?
- Outcome agreement: Does the customer agree that the result matched what they needed?
Use explicit anchors. “How satisfied were you with the interaction?” is a touchpoint item. “Was your disputed transaction fully resolved?” is an outcome item. Follow a low score with one optional diagnostic prompt: “What would have made the outcome better?” That answer can identify policy friction, unclear communication, authentication problems, or a failure to assign ownership.
| Metric | Definition | Data Source | Attrition Lift | Sample Question |
|---|---|---|---|---|
| First-contact resolution | Issue resolved without another contact | Survey plus contact history | Evaluate against subsequent attrition | “Was your request fully resolved during this interaction?” |
| Time to resolution | Elapsed time until the customer receives the outcome | Case system and survey | Compare with relationship-risk cohorts | “How satisfied are you with the time it took to resolve your request?” |
| Resolution durability | No repeat contact about the same issue | CRM and interaction logs | Track repeat-contact risk | “Have you contacted us again about this request?” |
| Outcome agreement | Customer accepts the result as appropriate | Survey and case outcome | Relate sentiment to retention behavior | “Did the outcome meet your needs?” |
A bank should never publish a single satisfaction score without the resolution breakdown beside it. Visbanking's first-contact-resolution resource is useful when designing this distinction, but the bank's own CRM and account data must determine whether a resolution signal predicts retention, product consolidation, or service escalation.
Wiring Survey Signals Into CRM and Predictive Workflows
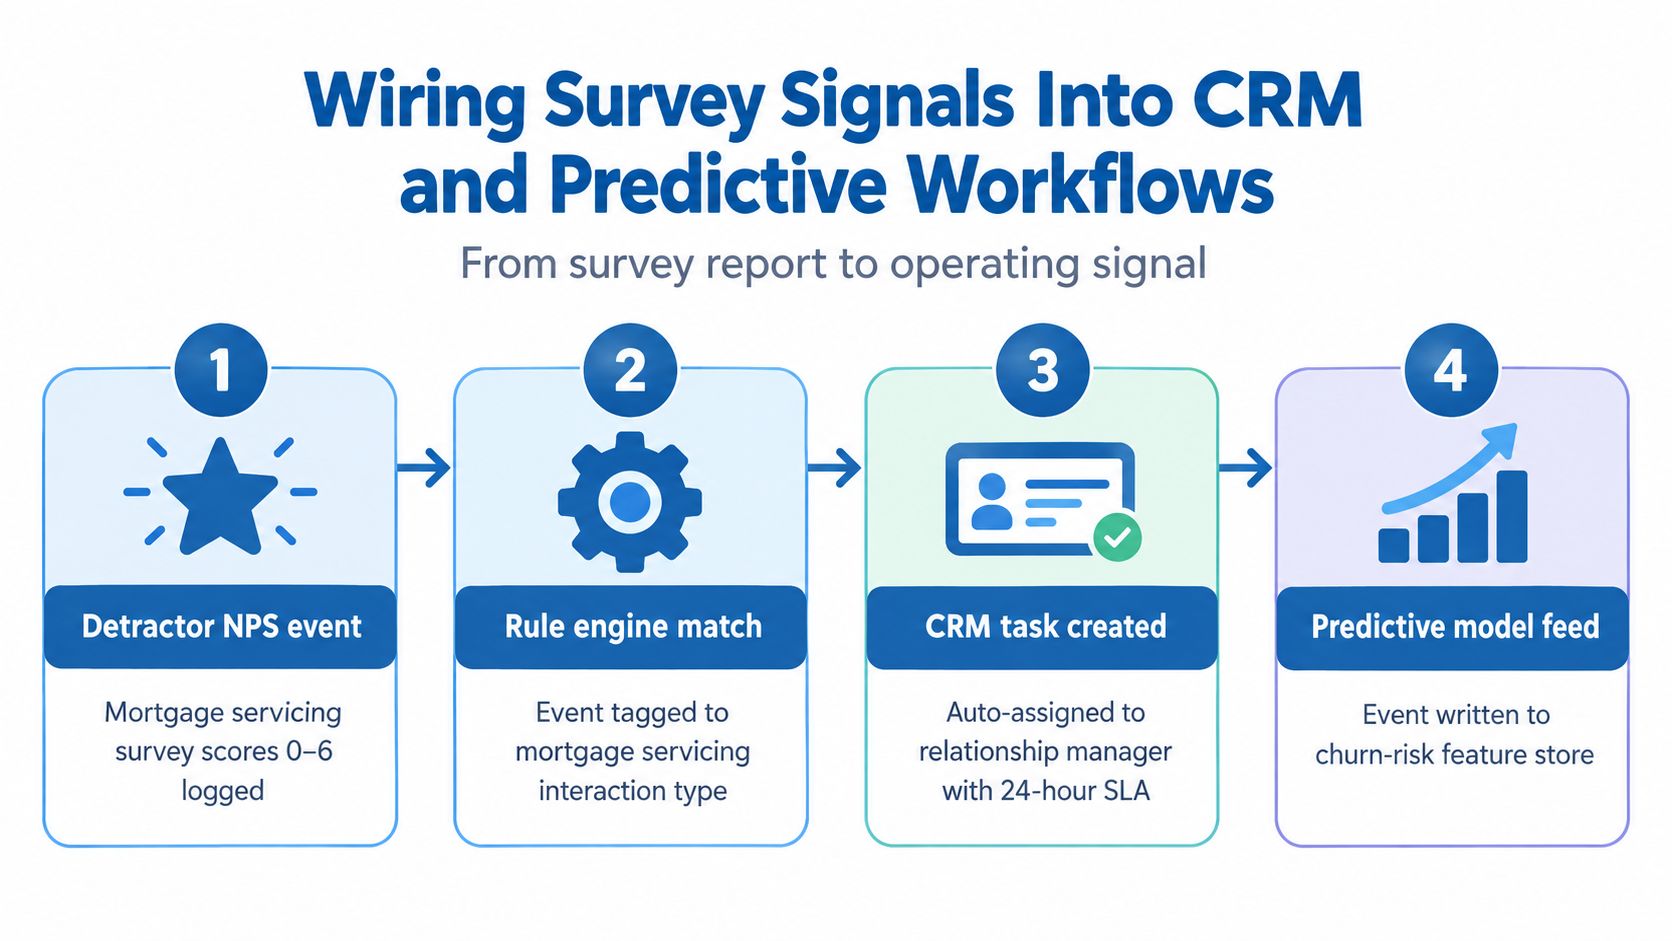
The survey becomes valuable when the answer changes what an employee does next. A detractor response that sits in a quarterly presentation has no operating value. A detractor response linked to a mortgage-servicing interaction, assigned to the right relationship manager, and added to a risk model is a usable signal.
Consider a practical workflow. A customer scores a mortgage-servicing interaction in the detractor range and indicates that the issue remains unresolved. The survey platform emits a payload containing a respondent token, segment, score, verbatim comment, product, interaction type, and disposition. The bank ingests that event into its customer-360 table, then applies rules based on score band, product, relationship tier, and existing risk status.
Build the handoff as a data contract
The payload should contain only fields the receiving systems need:
- Identity token: A stable, privacy-conscious key that lets the bank match the response to the customer record.
- Context: Product, channel, interaction type, service case, and customer segment.
- Measurement: Score, construct, answer timestamp, completion status, and disposition.
- Text: Verbatim feedback, filtered for prohibited sensitive information before broader distribution.
- Action state: Follow-up required, owner, service-level target, and closure status.
A relationship-manager task can be created within two hours for a high-risk mortgage-servicing detractor, with a 24-hour service-recovery target. The action should be calibrated to the relationship, not automatically reduced to a generic incentive. The same event should append a feature to the early-warning attrition model, where it can be evaluated alongside repeat contacts, product usage, balance movement, and unresolved cases.
Topic models should process verbatim themes on a weekly operating cycle rather than waiting for a quarterly report. A community bank can implement this architecture with a survey API, CRM webhook, rules engine, and lightweight feature store. Visbanking's Bank Intelligence and Action System can serve as an action layer that combines feedback with bank performance, market, and relationship signals, then sends alerts through existing advisor and risk dashboards without replacing core systems.
Operating rule: Every response needs an owner, an action, a deadline, and a closure code.
The Executive Scorecard Every Survey Program Owes You
The board deck should retire the single NPS headline as the primary proof of customer experience. Executives need a scorecard that separates sample quality from customer outcomes and operational follow-through.
The first quadrant tests whether leadership can trust the evidence. Report the representativeness index, completion rate, straight-lining rate, item nonresponse, and segment coverage. Set red, amber, and green bands before the reporting cycle begins. The threshold should reflect the bank's own sampling plan and peer benchmark, not an arbitrary number selected after results arrive.
The second quadrant measures resolution. Put first-contact resolution, time to resolution, resolution durability, and outcome agreement beside touchpoint satisfaction. This prevents an attractive interaction score from masking a failed dispute, an unresolved loan question, or repeated contact about the same issue.
A one-page board layout
| Quadrant | KPI | Target | Red Flag | Board Question Answered |
|---|---|---|---|---|
| Response quality | Segment coverage and completion | Coverage supports the stated decision | Important customer groups are absent | Can we trust the sample? |
| Resolution | First-contact resolution and durable outcome | Improvement against the bank's baseline | High satisfaction with repeat contacts | Are customers actually getting problems solved? |
| Closed loop | Detractors contacted within SLA and time to close | Every eligible case has an owner and closure code | Feedback accumulates without action | Does management respond to customer risk? |
| Financial outcome | Retention, cross-sell, and risk-event correlation | Movement linked to defined cohorts | No connection to account behavior | Did the program improve a funded business outcome? |
The third quadrant belongs to closed-loop discipline. Track the percentage of eligible detractors contacted within the service-level agreement, the recovery rate after intervention, and time to close. The fourth belongs to financial outcomes, including incremental retention dollars, cross-sell conversion among promoters, and risk-event correlation for low-sentiment cohorts. These metrics should be segmented by product, channel, customer type, and relationship manager.
Use peer percentiles from benchmarking data to establish red, amber, and green bands where comparable data exists. The CRO and CMO should be able to defend the entire page in a 15-minute board discussion.
Closed-loop recovery rate should anchor the program. It is the metric that proves the survey is doing work rather than collecting opinions.
A 90-Day Plan to Put This Playbook to Work
A bank can rebuild its customer feedback surveys without launching a large transformation program. The work should run as a controlled operating change, with named owners and deliverables at each stage.
Days 1 through 15
The chief customer officer, marketing operations lead, and data-governance owner should inventory every existing survey, trigger, audience, question bank, and dashboard. Audit the invitation funnel against the Pew response-mechanics standard. Define representativeness targets by segment, document disposition codes, and identify the decisions each survey is supposed to support.
Deliverables: survey inventory, sample-frame map, response-mechanics audit, segment coverage plan, and a list of unsupported metrics to remove from executive reporting.
Days 16 through 30
The customer-experience team should separate resolution questions from touchpoint questions and remove double-barreled or leading items. Compliance should review consent language, open-text handling, retention rules, and access controls. Relationship managers should test whether the questions produce actions they can execute.
Deliverables: approved question bank, pilot instrument, routing logic, compliance signoff, and CRM action map. Use a short pilot to test comprehension, mobile completion, answer options, and item-level missingness before launch.
Days 31 through 60
Deploy the rebuilt instrument against selected journeys, such as mortgage servicing, dispute handling, onboarding, treasury support, or relationship reviews. Data engineering should connect disposition codes, CRM handoffs, and customer-360 records. Risk analytics should create features for sentiment, unresolved issues, repeat contact, and follow-up completion.
Deliverables: live survey triggers, CRM webhook, rules engine, feature-store rows, service-recovery queue, and a documented escalation process. Owners should review alerts frequently enough to correct broken routing before the program scales.
Days 61 through 90
Launch the executive scorecard, run peer benchmarking, and compare survey cohorts with retention, cross-sell, service, and credit-performance outcomes. The audit committee should receive the response denominator, segment coverage, breakoffs, weighting decisions, and action-closure results, not only the satisfaction headline.
Deliverables: board-ready scorecard, peer benchmark view, closed-loop recovery report, model-monitoring log, and next-wave test plan. Leaders who want to expand their operating discipline can also consult AI playbooks for growth leaders for practical frameworks that connect data, execution, and accountable growth.
The next strategic step is benchmarking survey performance against peer institutions. A bank should know whether its response quality, resolution outcomes, recovery discipline, and customer-risk signals are improving relative to comparable organizations, not just relative to its own last quarter.
Visbanking combines bank performance, market, regulatory, and relationship data to help executives benchmark customer feedback signals against retention, cross-sell, and risk outcomes. Visit Visbanking to explore decision-ready analytics and workflow alerts that turn survey responses into accountable banking action.
Latest Articles

Brian's Banking Blog
ISO 20022 Migration Strategy for Bank Leaders

Brian's Banking Blog
Lead Tracking Software for Banks: An Executive Guide

Brian's Banking Blog
What Are Key Metrics for Banks? a Decision Guide

Brian's Banking Blog
How to Create a Dashboard That Banks Actually Use

Brian's Banking Blog
What Is Consultative Selling Approach and Why Banks Need It
Brian's Banking Blog