
Predictive Analytics Risk Management for Banks That Works
Brian's Banking Blog
Your quarterly packet looks solid until one page triggers discussion. Criticized assets are still manageable. Delinquencies haven't broken trend. Charge-offs aren't flashing red. Yet several lenders are telling a different story from the report. Sponsors are delaying draws. Deposits tied to a small commercial segment are getting less stable. A few high-value relationships are suddenly price shopping.
That's the executive problem. Traditional risk reporting tells you what has already landed in the books. It rarely tells you what is building just outside the frame.
Predictive analytics risk management changes that posture. Instead of waiting for a downgrade, a missed payment, or an examiner question, management teams use historical patterns, current signals, and model-based scoring to identify where losses, concentration stress, or relationship attrition are becoming more likely. In a bank, that doesn't just protect earnings. It improves how you deploy capital, how you prioritize relationship-manager time, and how you decide which parts of the portfolio are still worth growing.
Why Predictive Risk Management Matters Now for Bank Leaders
A familiar scenario plays out in many banks. A portfolio looks acceptable in the month-end package, but front-line teams already feel strain in the borrower base. By the time policy exceptions, covenant pressure, and collateral concerns show up clearly in lagging reports, the window for low-cost intervention has narrowed.
That gap between what executives can see and what is forming in the portfolio is where predictive risk management earns its place. It moves risk leadership from retrospective explanation to earlier judgment.
A 2021 study of predictive analytics in U.S. capital markets found that predictive analytics capability correlated r = 0.62 with forecasting accuracy and r = 0.58 with risk management effectiveness, with regression results of R² = 0.49 and R² = 0.45 respectively. The same study reported that 68.2% of respondents agreed predictive analytics improved forecasting and 64.0% agreed it enhanced risk management, a sign that predictive methods had become widely recognized decision-support tools by the early 2020s in financial risk functions (American Journal of Information Systems research findings).
What executives are really buying
Bank leaders aren't buying a model for its own sake. They're buying time.
Weeks of lead time can change the action set. A lender can tighten structure before renewal. Credit can review collateral assumptions while options still exist. Treasury can watch deposits linked to a vulnerable industry before balances migrate. Sales leaders can redirect calling effort toward safer, higher-quality growth rather than pushing volume into a segment already losing resilience.
Predictive risk management is most valuable when it changes a decision before the financial statement does.
That's also why governance matters. If a bank already uses a formal risk assessment methodology for accountants to document judgment, controls, and materiality, predictive analytics fits naturally as an added early-warning layer rather than a replacement for sound risk discipline.
The competitive difference is earlier action
Banks that act early don't just avoid downside. They can also grow more intelligently. If one market is weakening and another is stable, predictive signals help leaders shift calling plans, pricing posture, and portfolio appetite faster than peer institutions still reading the quarter through backward-looking ratios alone.
That broader industry shift is visible in many operating conversations across the sector, especially as institutions look for more timely intelligence on emerging conditions and performance trends (banking industry trend signals).
How Predictive Analytics Anticipates Risk Before It Hits
A practical way to think about predictive analytics is weather forecasting. A weather report doesn't say, "It will rain everywhere." It combines prior patterns, current readings, and model logic to estimate the likelihood of rain in a specific place over a specific time horizon.
Risk models work the same way. They take what the bank already knows, combine it with external signals, and produce an estimate of what is more likely next.
Three levels of analytics
Executives often hear three terms used interchangeably, which causes confusion.
- Descriptive analytics tells you what happened. Portfolio delinquency increased. Fee income slowed. Deposit runoff concentrated in one branch group.
- Predictive analytics estimates what is likely to happen next. Which credits are more likely to deteriorate? Which customers are showing churn risk? Which market conditions point to weaker new production quality?
- Prescriptive analytics supports action. Tighten underwriting in one niche, intensify outreach to another, or move selected accounts into enhanced monitoring.
A risk score sits in the middle of that progression. It isn't a verdict. It's a ranked estimate based on available evidence.
What a risk score actually means
Suppose two borrowers both show current payment performance. Descriptive reporting treats them similarly. A predictive model may not. One borrower's transaction activity is weakening, industry conditions are softening, and collateral values are becoming less certain. The second borrower shows stable inflows and stronger operating resilience. The score helps management prioritize the first borrower for review.
That distinction matters because banks don't manage probability alone. They manage probability multiplied by impact.
A useful score doesn't answer every question. It tells your team where a decision deserves attention first.
In finance, predictive analytics draws on a long statistical lineage that includes regression analysis, time-series methods, Bayesian statistics, and machine learning. These methods are used to forecast credit defaults, fraud, market volatility, and operational failures. Banking-focused empirical work has also shown classification accuracy above 80% in audit-risk applications, illustrating how historical data and algorithmic scoring can improve prioritization at scale (banking predictive analytics review).
Why this matters in banking operations
A model's output becomes practical when it enters a workflow. If a rising-risk signal lands inside an early warning system for banks, management can route the account for review, assign next actions, and document the decision path. That's the difference between analytics as a report and analytics as operating efficiency.
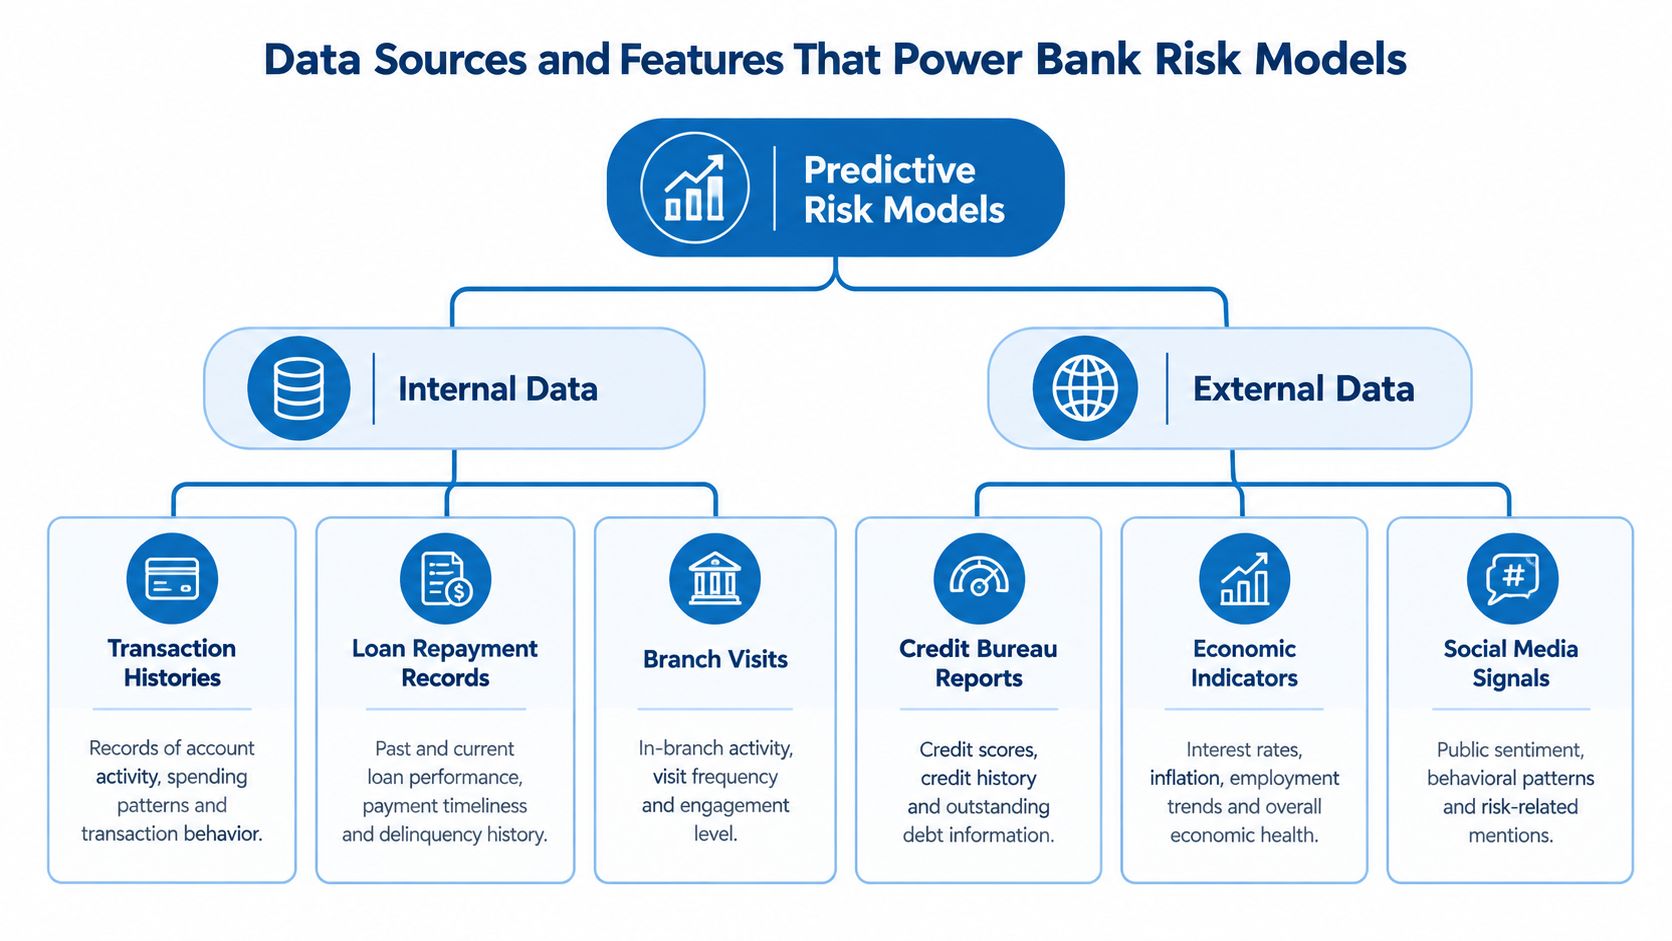
Data Sources and Features That Power Bank Risk Models
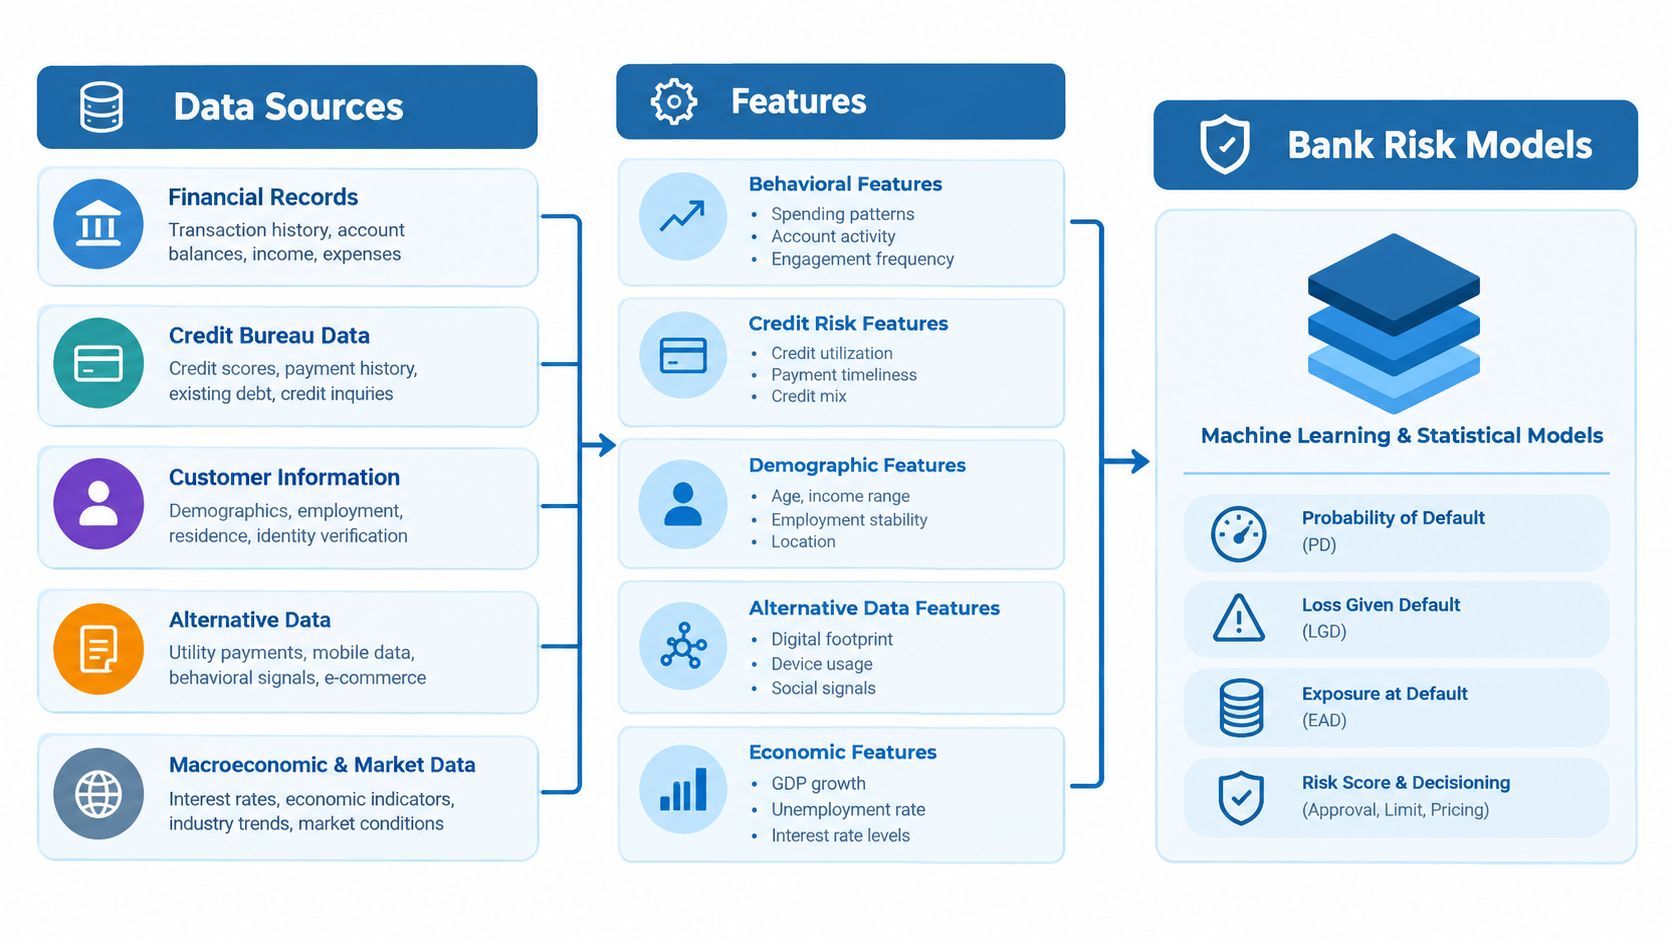
Most discussions of predictive analytics stop at credit scores. That's too narrow for a bank executive making portfolio and growth decisions. The strength of predictive risk management comes from combining many forms of data into a single operating view.
Internal signals show behavior
Internal data usually carries the clearest behavioral clues because it reflects how customers and portfolios are moving inside the institution.
Examples include:
- Loan performance data such as payment timing, renewals, exceptions, and migration history.
- Transaction patterns such as deposit volatility, draw activity, wire behavior, and cash concentration changes.
- Relationship activity including branch visits, treasury usage, product depth, and changes in account engagement.
- Operational control data such as exception trends, review timing, and process breakdowns.
These are often the first indicators that a customer relationship is changing before a formal default or downgrade occurs.
External signals add context
Internal data tells you what is happening with your customer. External data helps explain the environment around that customer and around competing institutions.
For banks, useful external sources can include FDIC call reports, FFIEC/UBPR, NCUA 5300, SBA program data, UCC filings, SEC/EDGAR, BLS/BEA macro series, and HMDA. The point isn't to collect everything. It's to identify which outside signals sharpen decisions on portfolio resilience, market selection, and sales timing.
A frequently underserved issue is how banks perform when they combine internal and external signals at scale. Recent industry research notes that advanced banks are joining structured and unstructured data to forecast risk events, including cash and collateral movements and control breaches, while implementation guidance remains thin on governance, explainability, and operating-model design (PwC global banking risk study projection and observations).
Features are the usable form of raw data
Raw data rarely goes straight into a model. Teams first create features, which are variables built to capture meaningful patterns.
A few simple examples make this concrete:
- Trend features compare current borrower cash activity with its own recent baseline.
- Concentration features measure how exposed a relationship or portfolio is to one property type, geography, or depositor group.
- Change features track acceleration, not just level. A stable metric that is weakening quickly may matter more than a weak metric that is improving.
- Relationship features combine product use, decision-maker changes, and interaction frequency to estimate churn or expansion potential.
Banks that want consistency across teams often use a feature store so credit, sales, analytics, and monitoring functions score against the same governed definitions.
Practical rule: If two teams calculate the same risk indicator differently, you don't have a modeling problem first. You have a data-governance problem.
A concise feature checklist
For executive review, these are the feature groups worth asking about:
| Use case | Feature groups that matter |
|---|---|
| Credit risk | Payment behavior, collateral movement, borrower cash flow patterns, covenant pressure, industry and geography context |
| Portfolio risk | Concentration, migration trends, segment sensitivity, deposit linkage, correlated exposures |
| Sales risk | Relationship depth, wallet share movement, pricing pressure, churn markers, peer and market positioning |
Choosing the Right Models for Credit Portfolio and Sales Risk
Model choice should start with the decision, not the algorithm. A bank asking, "Which relationships need attention this month?" may need a different tool from a bank asking, "How might this portfolio behave over the next several quarters?"
Start with the question
Some model families are built for trend estimation. Others are better at classification or anomaly detection. The most useful executive framing is simple: what are you trying to predict, how much explanation do you need, and how often will the answer drive action?
| Model Family | Best For | Strengths | Watchouts |
|---|---|---|---|
| Regression | Credit loss drivers, pricing sensitivity, relationship attrition factors | Clear interpretation, good for policy discussion, easier to explain to committees | Can miss nonlinear behavior if the specification is too simple |
| Time-series | Deposit trends, delinquency paths, seasonal runoff, market movement | Strong for sequences over time and planning horizons | May underperform when structural breaks hit and old patterns stop holding |
| Bayesian methods | Uncertain environments, sparse data segments, expert judgment overlays | Explicit handling of uncertainty, useful when data is thin | Harder to communicate if stakeholders aren't familiar with probabilistic updating |
| Machine learning | Fraud patterns, early warnings, complex interactions, large mixed data sets | Strong pattern detection, flexible with many variables | Requires tighter governance, drift monitoring, and explanation controls |
Interpretability versus lift
For executive and regulatory use cases, the most accurate model isn't always the best model. If the result affects credit decisions, reserves, or customer treatment, management needs a model that can be defended, challenged, and understood.
Consider two hypothetical examples:
A community bank reviewing commercial real estate renewals might prefer a regression-based scorecard because credit officers can see which variables are driving the ranking and discuss policy response with confidence.
A fraud or AML team facing high-volume event data might use machine learning because the pattern complexity is too high for simpler rules to capture reliably.
Neither choice is more advanced in the abstract. The right choice depends on the decision burden around it.
Match the model to operating pressure
Executives should ask four direct questions before approving a modeling path:
- What business decision will this score change?
- How quickly does the signal need to update?
- How much explanation will auditors, validators, lenders, or directors need?
- What happens if the model is wrong?
One practical option in banks is a layered approach. Use interpretable models for core credit and policy decisions, then add more complex models around triage, surveillance, or lead prioritization where speed and pattern detection matter most.
In workflow-heavy environments, platforms such as Visbanking's BIAS unify regulatory, market, and people data so predictive signals can be surfaced to both risk and sales teams in a decision-ready format. The important point isn't the brand. It's the operating design. Signals need to be explainable enough for governance and timely enough for action.
Validating Monitoring and Explaining Models With Confidence
A risk model isn't trustworthy because it scored well during development. It's trustworthy only if the bank can show that it remains accurate, stable, and appropriately governed after deployment.
Validation is a control system
Independent validation is the first line of discipline. A separate review function should test assumptions, data lineage, variable behavior, and output reasonableness. That review shouldn't stop at launch.
Banks also need ongoing checks:
- Back-testing compares predictions with actual outcomes over time.
- Challenger models test whether another method performs better or fails differently.
- Threshold recalibration keeps action bands aligned with current portfolio conditions.
- Segment review checks whether the model behaves consistently across borrower types, geographies, and cycles.
A model can appear healthy in aggregate while drifting badly in one segment that matters.
Why silent degradation is dangerous
Supervisory thinking on model risk is clear on an important point. Machine learning models can create losses not only when they are wrong, but also when they are misused or allowed to degrade as data drift and spurious correlations build up. That makes drift monitoring, challenger testing, and formal escalation thresholds central controls, especially in early-warning, credit-risk, and AML settings where forecast stability affects capital, provisioning, and alerting decisions (banking model-risk guidance summary).
When a model grows stale quietly, management doesn't just lose precision. It starts making confident decisions on outdated assumptions.
Explainability is a technical requirement
For regulatory and credit-use models, explainability isn't optional polish. The Federal Reserve notes that common explanation methods include feature-importance summaries, visualizations, internal model parameters, and nearest-counterfactual-style data-point explanations. In practice, banks should pair these with independent validation, periodic back-testing, and threshold recalibration so outputs remain auditable and stable across time, segments, and changing macro conditions (Federal Reserve discussion of explanation methods).
What boards and executives should require
A concise governance checklist helps:
- Escalation triggers that define when score movement, drift, or performance decline requires review.
- Documented ownership across business, risk, data, and validation teams.
- Decision logs that record how model outputs informed approvals, pricing, monitoring, or outreach.
- Periodic reviews tied to portfolio changes, not just annual calendar routines.
Confidence comes from. Not from believing the model is smart, but from knowing the bank can inspect, challenge, and correct it.
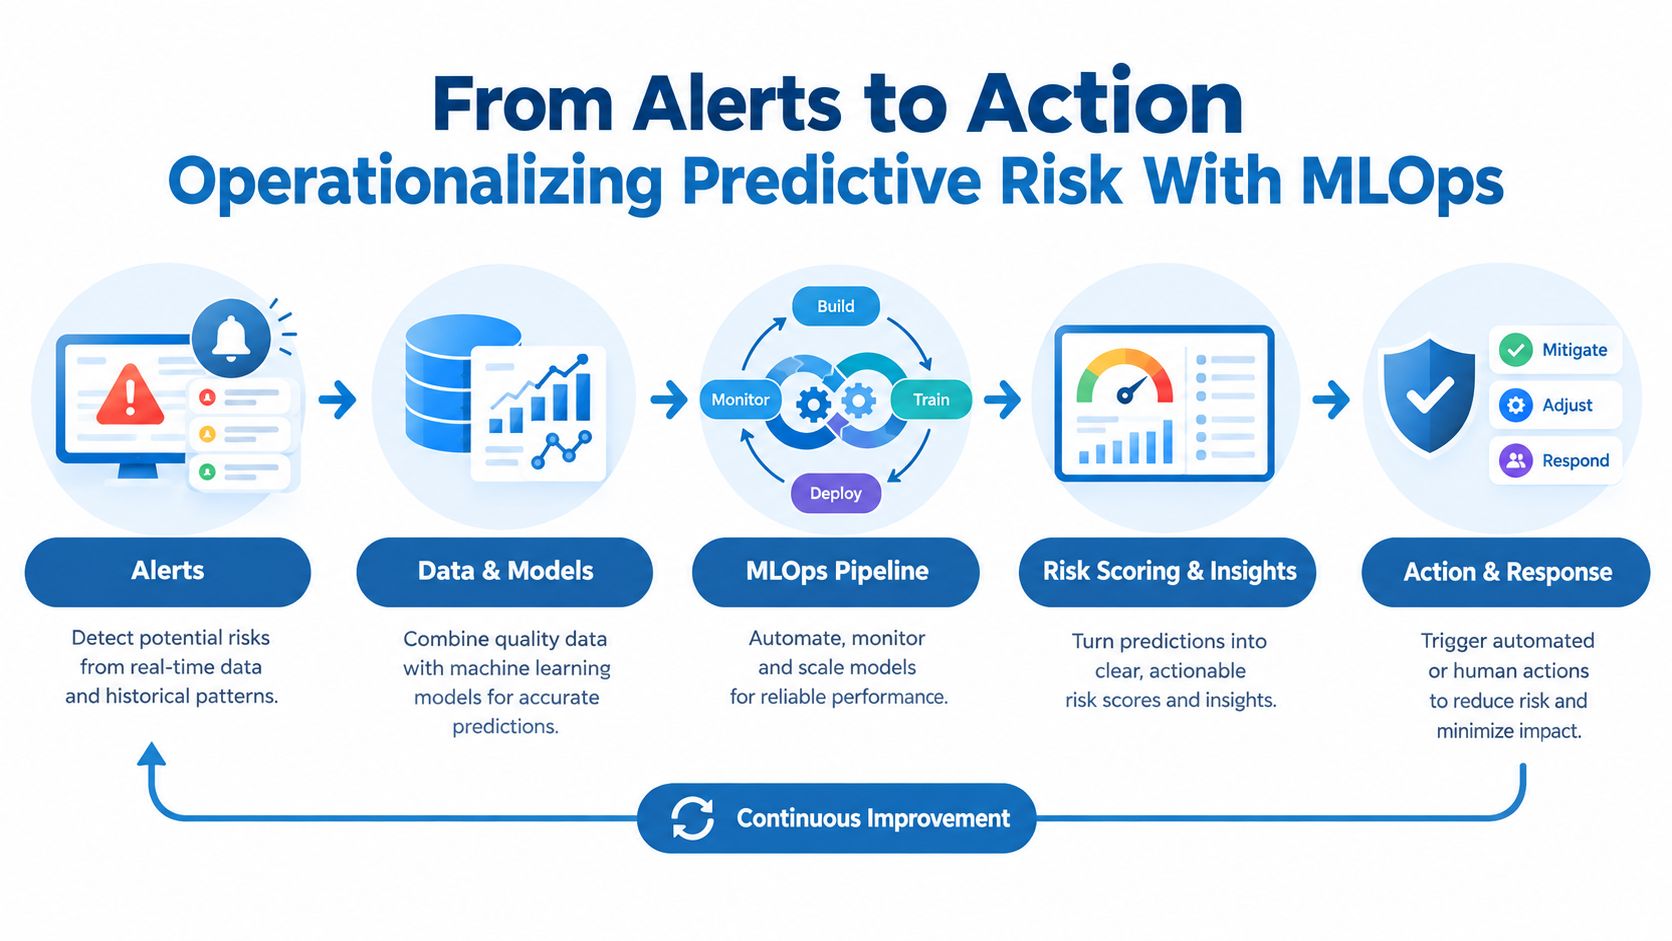
From Alerts to Action Operationalizing Predictive Risk With MLOps
A good score delivered too late is just a historical note in a modern format. The operational question is whether predictive risk signals can move through the bank fast enough to change lender behavior, portfolio monitoring, or customer outreach.
Production matters as much as modeling
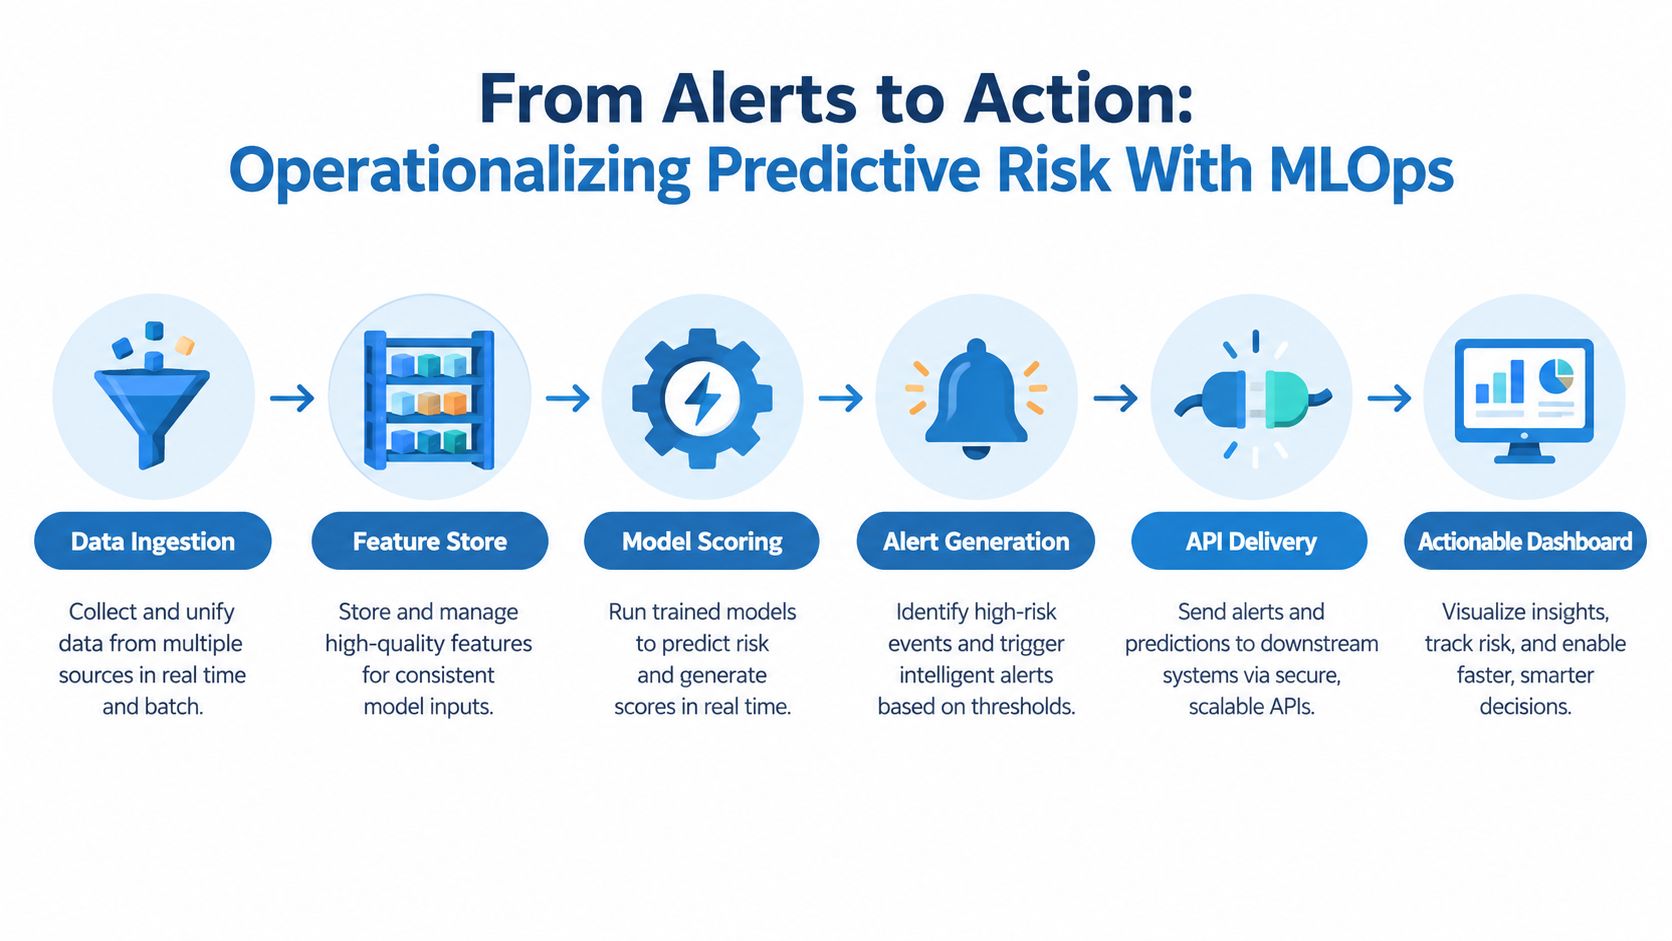
MLOps is the discipline that keeps predictive risk management usable in daily operations. It covers the pipelines, feature management, scoring jobs, observability, and secure delivery mechanisms that turn models into repeatable processes rather than isolated analytics projects.
In banking, that usually means a chain like this:
- Data ingestion pulls fresh internal and external inputs into governed pipelines.
- Feature processing updates the variables the model depends on.
- Model scoring generates current risk or opportunity estimates.
- Alert routing sends selected signals to the right teams.
- Workflow delivery places those alerts inside dashboards, email queues, Slack, CRM tasks, or review systems.
Turn early warnings into plays
The opportunity sits in how banks connect risk signals to commercial action.
If a model shows rising stress in one borrower cluster, credit can intensify monitoring while sales teams avoid pushing fresh exposure into the same pocket. If another segment shows stable performance and strong relationship depth, business development can increase outreach there. If a competitor bank shows weakening fundamentals or turnover among key decision-makers, prospecting teams can treat that as a targeted growth window rather than broad cold outreach.
That's how predictive risk management supports portfolio growth decisions, not just risk reporting.
Avoid alert fatigue
Banks often fail at this stage because they produce too many warnings with too little triage logic.
A disciplined operating model usually includes:
- Priority bands so only the highest-value alerts force immediate action.
- Role-based routing so lenders, credit officers, and sales teams each see what they can act on.
- Feedback loops so closed alerts improve later scoring and threshold design.
- Review cadences that separate urgent intervention from routine portfolio watch-list work.
The technical controls described earlier matter here too. Without monitoring, a production system can keep sending alerts long after the underlying data has shifted. With the right MLOps design, predictions stay fresh enough to support portfolio monitoring, early-warning triage, and relationship-manager outreach in one connected process.
Putting Predictive Risk Management to Work in Your Bank
The executive case for predictive analytics risk management is straightforward. Banks need earlier signals, clearer prioritization, and a tighter link between risk intelligence and commercial action.
Consider a hypothetical $1.2B community bank. Management notices that a commercial real estate niche is still performing acceptably on lagging metrics, but predictive monitoring flags a 15% rise in early delinquency risk across a defined segment. That doesn't force an exit. It prompts practical moves: tighter renewals, faster borrower contact, revised stress assumptions, and a pause on aggressive new production in that pocket.
Now take the growth side. A business-development team receives risk-adjusted opportunity scores that combine market position, relationship clues, and competitor stress signals. Instead of spreading calls evenly, managers shift outreach toward accounts with stronger expansion potential and lower downside risk. The same analytic framework that protects the balance sheet improves sales efficiency.
What leaders should do next
A practical starting sequence is short:
- Identify one portfolio decision where earlier warning would change action.
- Align data owners and business owners before discussing model complexity.
- Define what action follows a score so analytics doesn't end as another dashboard.
- Benchmark your posture against peers and market conditions, then monitor change over time.
The banks that get this right don't treat predictive analytics as a side project for data science. They treat it as decision infrastructure.
For institutions building that capability, unified intelligence matters. Platforms that combine regulatory, market, financial, and people data help teams compare their position against peers, monitor emerging stress, and document why they acted when they did. That is how a bank stops collecting data and starts using it to protect earnings and direct growth.
Visbanking provides a bank intelligence and action platform that unifies regulatory, market, financial, and people data into decision-ready analytics for risk, sales, and performance teams. If you want to benchmark your institution, monitor predictive signals, or explore how early-warning insights can support portfolio growth decisions, visit Visbanking.
Latest Articles
Brian's Banking Blog
Automated Alerts and Notifications for Banks
Brian's Banking Blog
Customer Feedback Loop for Banks: A Practical Playbook
Brian's Banking Blog
Commercial Lending Trends: What Bank Executives Must Know
Brian's Banking Blog
Bank Marketing Dataset Analysis Strategy

Brian's Banking Blog
ESG Peer Benchmarking for Bank Leaders
Brian's Banking Blog