
What Are Key Metrics for Banks? a Decision Guide
Brian's Banking Blog
The ALCO meeting is usually not short on numbers. It's short on interpretation. Two banks can report the same ROA, the same capital ratio, and similar loan growth, yet one may be building durable earnings while the other is consuming its funding advantage and masking credit deterioration.
That's why the answer to what are key metrics shouldn't be a static list of ratios. For bank executives, directors, and relationship managers, a key metric is a linked signal that explains what changed, why it changed, and what someone should do next.
Why Key Metrics Are a Decision System, Not a Dashboard
Two hypothetical banks report 1.20% ROA. Bank A earns it through stronger margins, stable funding, and controlled expenses. Bank B reaches the same result through fee income while its core spread narrows and delinquencies worsen. The ratio matches. The correct management response does not.
A key metric must tie profitability to the balance-sheet scale and risk that produced it, or it cannot guide action. ROA, or return on assets, expresses net income as a percentage of average assets, making comparisons across institutions possible. The FDIC's quarterly banking profile supports that balance-sheet view, but the ratio still requires context about its earnings drivers and risk exposures.
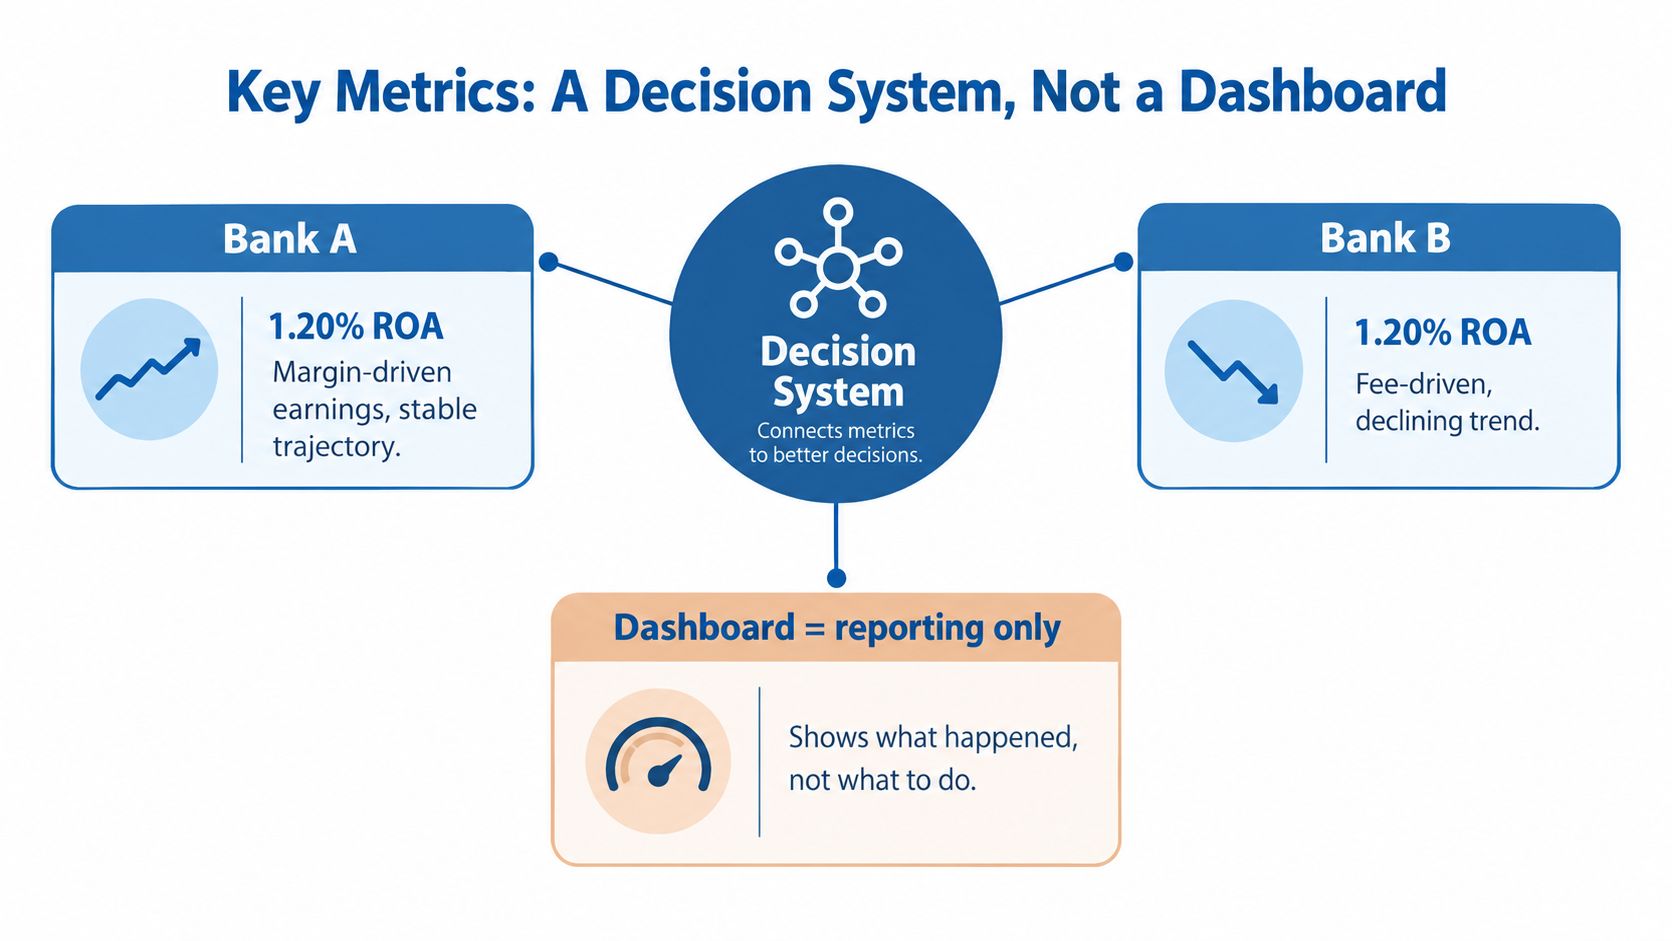
A vanity ratio reports an outcome without showing whether it will last. A decision-useful metric must:
- Show direction, rather than only the latest quarter.
- Connect to a driver, such as funding cost, credit losses, or operating expense.
- Trigger an action, such as repricing deposits, tightening underwriting, contacting a prospect, or escalating a concentration.
Practical rule: Never approve an executive action from one ratio. Review the ratio, its trend, its peer-relative position, and the operating driver behind the change.
These metric families work as one diagnostic frame. Profitability shows whether the institution generates returns. Credit, capital, and liquidity show whether those returns can withstand pressure. Growth and sales show where the franchise is expanding and where relationship managers should focus. Operational and talent measures show whether the bank can execute without adding structural cost.
| Metric Family | Leading Question | Typical Executive Action |
|---|---|---|
| Performance and profitability | Are earnings improving, and what is producing them? | Adjust pricing, balance-sheet mix, or expense priorities |
| Credit and risk | Is asset quality weakening in a specific exposure? | Change underwriting, reserves, concentration limits, or monitoring |
| Capital and liquidity | Can the bank absorb stress while funding growth? | Revisit distributions, liquidity sources, and capital planning |
| Growth and sales | Is growth high quality and commercially actionable? | Prioritize accounts, products, markets, and relationship coverage |
| Operational and talent | Can the organization execute without adding structural cost? | Automate work, redesign processes, or address capacity gaps |
Executives reviewing ways to present operating measures can consult these 7 metrics dashboard examples. Bank leaders need a stricter test: the display should identify the decision, owner, and trigger. A dashboard reports what happened. A decision system shows who acts when the combination of signals changes.
Profitability and Performance Metrics
A bank can post higher earnings while its economics deteriorate. Executives need the formula, the trend, and the signal combination before changing pricing, balance-sheet mix, or expense priorities.
ROA divides net income by average assets, showing how effectively the balance sheet produces earnings. ROE divides net income by average equity capital and measures returns to shareholders. ROE can rise because of borrowing or lower capital, even when asset economics weaken. Historical ROAA and ROE series document this distinction.
NIM, or net interest margin, divides net interest income by interest-earning assets. It captures loan pricing, deposit costs, funding mix, asset duration, and repricing speed. The Federal Reserve's supervision and regulation report reported U.S. banking industry NIM at 3.46% in the first quarter of 2025 and 3.62% in the second quarter, while the efficiency ratio improved from 64.69% to 62.95% over the same periods. Review the mechanics behind this spread in net interest margin in banks.
The efficiency ratio divides noninterest expense by revenue. Lower is generally better because the bank keeps more revenue after operating costs. Read it beside NIM. Rising NIM with a falling efficiency ratio supports stronger operating performance. Rising NIM with a worsening efficiency ratio means cost growth is consuming the gain.
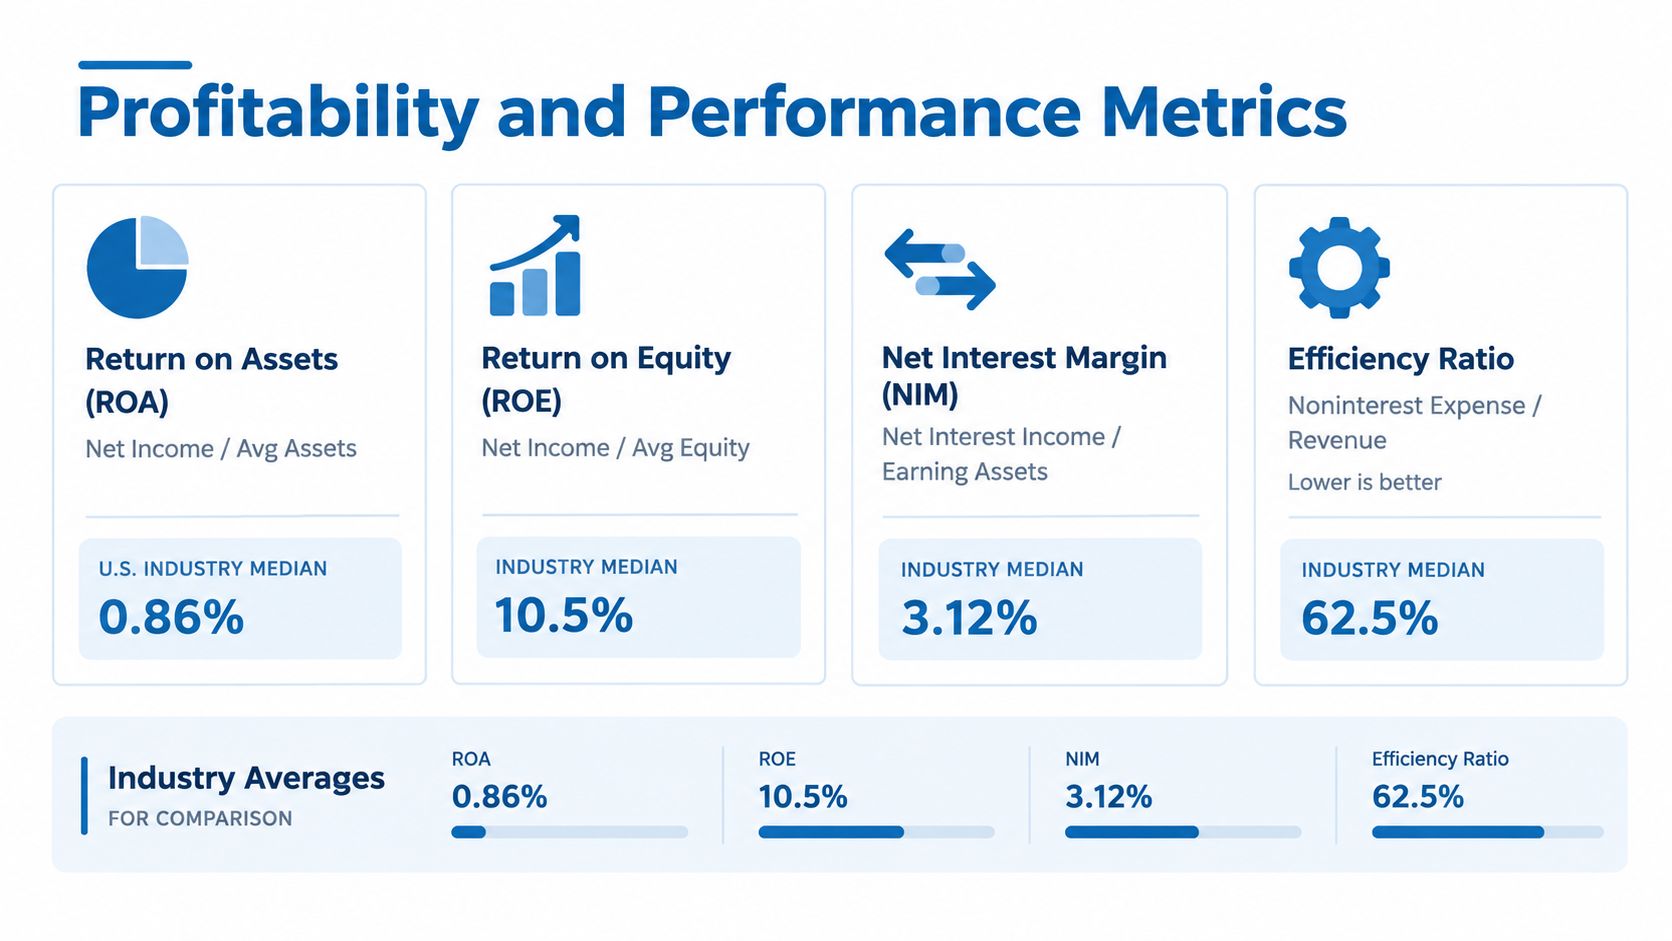
The FDIC reported that the U.S. banking industry generated $79.3 billion in net income in the third quarter of 2025, an increase of $9.4 billion, or 13.5%, from the previous quarter. Industry ROA reached 1.27%, compared with 1.13% in the second quarter and 1.09% in the third quarter of 2024, an 18-basis-point year-over-year increase, according to the FDIC's third-quarter 2025 profile.
Do not treat 1.27% ROA as universally strong. Peer group, charter, geography, asset mix, and risk profile determine its meaning. A quarterly improvement can reflect sustainable pricing, temporary funding relief, balance-sheet contraction, or delayed credit costs. The decision trigger is the combination: confirm better ROA with NIM, ROE, and efficiency before calling performance healthy.
Historical downside matters too. The Federal Reserve's documented series shows aggregate ROAA falling from 1.30% in the third quarter of 2007 to 0.04% in the fourth quarter, while ROE fell from 14.36% to 0.45%. That range gives executives a reason to escalate deteriorating profitability early, rather than dismissing a weak quarter as noise.
Credit Quality, Capital, and Liquidity as a Resilience Stack
A bank can report strong earnings and still lack room to absorb the next shock. Credit quality, capital, and liquidity must therefore be read as one resilience stack, with each signal changing the meaning of the others.
Start with credit quality. The allowance for credit losses estimates expected losses embedded in the portfolio. The net charge-off rate records loans removed after recoveries, while delinquency migration shows whether borrowers are approaching stress before losses become fully visible. Review these measures together. A stable charge-off rate can mask worsening early-stage delinquencies, concentrated exposure, or a vulnerable loan vintage.
Capital provides the loss-absorption layer. The CET1 ratio compares common equity capital with risk-weighted assets. The supplementary capital measure, calculated against total assets rather than risk-weighted assets, provides a useful counterweight. Liquidity coverage indicates whether high-quality liquid assets and projected cash flows can withstand funding pressure.
Community-bank data shows why growth decisions require capital context. In the third quarter of 2025, the community-bank capital measure reached 14.27%, while the ratio of capital to total assets remained 11%. The figures in BerryDunn's summary of the FDIC profile support a clear operating rule: evaluate loan expansion alongside the capital and liquidity available to support it.
Large-bank capital requires more precision. The regulatory framework combines a 4.5% minimum CET1 ratio, a stress capital buffer of at least 2.5%, and, where applicable, a global systemically important bank surcharge of at least 1.0%, according to the Federal Reserve's large-bank capital requirements. A reported ratio can appear comfortable even when the usable buffer differs materially by institution.
Stress testing turns that distinction into an action signal. The Federal Reserve's 2025 test projected the aggregate CET1 ratio of 22 participating banks to decline from 13.4% in the fourth quarter of 2024 to a minimum of 11.6% under the severely adverse scenario, then recover to 12.8% at the end of the projection horizon. The 2025 DFAST results document the projection.
Credit unions need the same discipline. The NCUA reported an aggregate net-worth ratio of 11.11% in the second quarter of 2025, up from 10.84% a year earlier, and identifies 7% as the statutory threshold for being well-capitalized. Its published performance data also explains denominator mechanics, including excluded PPP balances.
Use capital ratios for banks within a linked review of concentration, liquidity, delinquencies, provisions, and stressed losses. That combination shows whether earnings are creating strategic capacity or delaying a balance-sheet problem.
Growth, Sales, and Operational Signals That Move the Pipeline
Bank sales teams often receive dashboards full of activity metrics and still lack a credible reason to call an institution. The missing layer is interpretation.
Deposit growth is a leading signal, but the total can mislead. In the first quarter of 2026, domestic deposits increased by $389.7 billion, or 2.1%, while bank ROA rose to 1.26% and NIM fell 8 basis points quarter over quarter. Those figures from the FDIC's first-quarter 2026 profile describe a familiar conflict. Deposits may be growing while their cost, duration, concentration, or product mix pressures earnings.
The right sales question is not, “Did deposits increase?” It's, “What does the deposit change make harder or more valuable?” Deposit growth paired with declining NIM can create an opening for treasury services, pricing analysis, liquidity planning, or funding-mix advice. Loan growth paired with worsening delinquencies calls for risk-sensitive engagement, not broad product outreach.
Relationship managers should monitor:
- Deposit composition: Separate stable operating balances from rate-sensitive or concentrated funding.
- Loan momentum: Compare growth with delinquency migration, provisions, and capital consumption.
- Cross-sell depth: Identify whether the relationship has treasury, payments, lending, investment, or cash-management gaps.
- Cost to serve: Find accounts whose operational burden consumes the value of the relationship.
- Coverage productivity: Compare relationship-manager capacity with pipeline quality and account complexity.
- Talent capacity: Track hiring velocity, role vacancies, competitive attrition, and the availability of revenue-generating skills.
Talent belongs in the same operating model because staffing limits execution. Visbanking's talent data includes a 2.6M+ professional graph, which can help teams examine hiring signals and competitive movement alongside institution-level performance. That doesn't replace judgment. It gives executives an earlier view of whether the bank can support its growth plan.
A rising efficiency ratio alongside strong top-line growth is not automatically success. It may signal operational debt, manual processes, expensive core infrastructure, or weak account economics. The FDIC has correctly identified the problem with static metric lists: they don't tell relationship managers how to interpret conflicting signals or convert them into account-level actions.
A credible prospecting trigger: Growth tells you where momentum exists. Margin, credit, and funding metrics tell you why the institution may be ready to talk.
When Healthy Headlines Hide Emerging Stress
Aggregate strength can conceal segment weakness. In the second quarter of 2025, more than 99% of U.S. banks were well capitalized, aggregate CET1 ratios were about 13% for both large and small banks, and the total loan delinquency rate was approximately 1.5%, below the 10-year average of 1.7%, according to the Federal Reserve's banking system conditions report.
Those are reassuring system-level indicators. They don't prove that every portfolio, borrower segment, geography, or loan vintage is healthy. The same Federal Reserve discussion identified rising auto-loan and credit-card delinquencies as potential signs of consumer pressure while overall bank conditions remained stable.
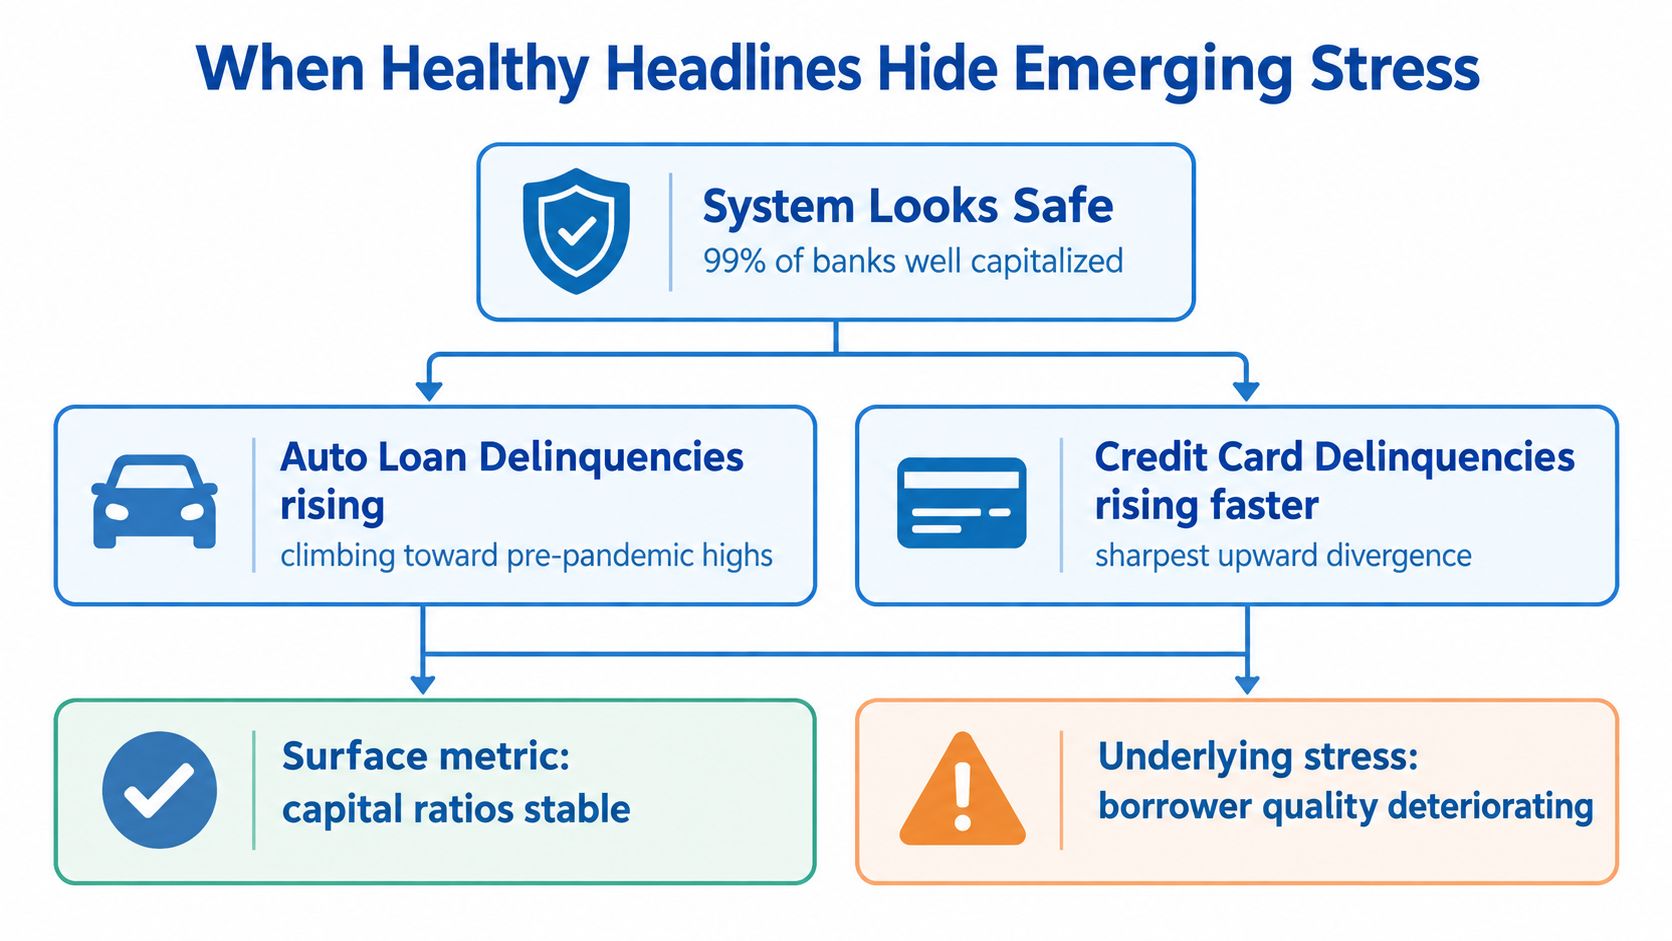
A bank can therefore pass a headline health test while carrying a growing problem in a narrow exposure. Directors should watch trajectory and distribution, not only threshold status.
Use four labels for every important metric:
- Baseline health: Capital, liquidity, asset quality, and profitability relative to policy and regulatory expectations.
- Momentum: The direction and speed of deposits, loans, margin, expenses, earnings, and capital.
- Exposure: Concentrations by product, borrower, geography, vintage, collateral, and funding source.
- Early warning: Delinquency migration, deposit instability, funding concentration, provision movement, and peer-relative outliers.
The label changes the response. A baseline metric may support board reporting. Momentum may trigger pricing or growth decisions. Exposure may require portfolio limits. An early warning should route to risk management before the headline ratio moves.
Do not let a healthy CET1 ratio close the investigation. Ask which borrowers are deteriorating, which funding sources are leaving, and whether peer distributions show the same movement. Aggregate metrics describe the institution. Granular signals explain where the institution is vulnerable.
Turning Metrics Into Monitored Signals and Workflow Triggers
A monitoring architecture should assign each signal an owner, cadence, comparison set, and action. Weekly monitoring suits deposits, funding concentration, pipeline activity, liquidity position, and delinquency migration. Quarterly monitoring suits ROA, ROE, NIM, efficiency, capital, provisions, and peer benchmarking. The cadence should follow how quickly management can act, not how often a report is traditionally produced.
Alert on deltas and divergence, not arbitrary thresholds alone. A community bank with accelerating deposits and an 8-basis-point quarter-over-quarter NIM compression has a treasury problem to investigate, even if absolute NIM remains acceptable. Route that alert to the treasury sales team and ALCO, not only to the loan team. The FDIC's first-quarter 2026 profile provides the broader context for why deposit growth and margin movement must be read together.
A large bank may hold ROA steady while credit-card delinquencies rise within a specific vintage. That signal belongs with the risk team, accompanied by peer-distribution context, borrower segmentation, and the exposure's effect on projected losses. A stable earnings ratio shouldn't suppress an early warning.
Every alert needs a documented next step:
- Validate the movement: Confirm the source, period, denominator, and peer set.
- Identify the driver: Separate pricing, volume, mix, credit, funding, and expense effects.
- Assign the owner: Route the signal to ALCO, credit, treasury, sales, finance, or talent leadership.
- Record the decision: Capture the action, deadline, and evidence that will confirm or disprove the interpretation.
A workflow tool such as Visbanking's workflow creation capability can help connect monitored signals with email, Slack, CRM, and documented actions. The technology matters less than the discipline. An alert without ownership is just another dashboard notification.
From Ratios to Decisions with Visbanking
Executives don't need more disconnected reports. They need a common evidence layer that joins profitability, capital, liquidity, credit quality, market context, prospects, and talent signals.
Visbanking's Bank Intelligence and Action System, or BIAS, unifies data from FDIC call reports, FFIEC and UBPR, NCUA 5300, SBA program data, UCC filings, SEC and EDGAR, BLS and BEA macro series, and HMDA. Its Bank Performance app supports peer benchmarking and historical analysis across 4,600+ institutions. Prospect supports relationship intelligence, Talent uses a 2.6M+ professional graph, and Bank Intelligence, in beta, surfaces predictive risk and performance signals.

The point isn't to replace ALCO judgment or relationship-manager experience. It's to make the evidence consistent enough that teams can benchmark ratios, isolate drivers, detect divergence, and route the resulting decision without rebuilding the analysis every quarter.
Benchmark your institution against the right peer set, then identify which metric combinations deserve action rather than passive reporting. Explore Visbanking to connect bank performance, prospect intelligence, talent signals, and workflow-ready data in one operating view.
Latest Articles

Brian's Banking Blog
ISO 20022 Migration Strategy for Bank Leaders

Brian's Banking Blog
Lead Tracking Software for Banks: An Executive Guide

Brian's Banking Blog
Customer Feedback Surveys: A Playbook for Banks

Brian's Banking Blog
How to Create a Dashboard That Banks Actually Use

Brian's Banking Blog
What Is Consultative Selling Approach and Why Banks Need It
Brian's Banking Blog