
Bank Shares Performance: Metrics That Drive Returns
Brian's Banking Blog
FDIC-insured commercial banks and savings institutions generated $295.6 billion in net income in full-year 2025, a 10.2% increase from 2024, and industry return on assets rose 8 basis points to 1.20%, according to the FDIC's fourth-quarter 2025 Quarterly Banking Profile. Higher net interest income and noninterest income more than offset higher noninterest expense.
That profit didn't settle bank shares performance. Investors paid up for some business models and discounted others, because headline earnings don't show whether the result will last or whether the balance sheet is taking more rate and credit risk.
Directors and relationship managers need the inputs behind the price. Margin quality, reserve coverage, securities marks, and the peer set you choose will change a credit view, a funding plan, or a board conversation long before the next close.
Core Metrics That Explain Bank Share Performance
A bank executive should be able to read share performance in one pass. Price is the output. The six lines below are the inputs investors are already using, whether or not the board packet shows them together.
| Metric | What It Signals | Latest Reference |
|---|---|---|
| Price-to-earnings ratio | How much investors pay per dollar of earnings | Median 9.6x at end of 2025, below long-term average |
| Net interest margin | Spread earned on loans and securities | 3.34% in Q3 2025; pre-pandemic average 3.25% |
| Return on assets | Profit generated per dollar of assets | 1.20% for full-year 2025 |
| Unrealized securities losses | Hidden drag on tangible equity | $337.1 billion in Q3 2025, down 14.7% quarter over quarter |
| Allowance to noncurrent loans | Reserve cushion against credit losses | 178.4% in Q3 2025, down from 179.4% |
| Median EPS growth | Earnings momentum behind the multiple | 12% estimated for 2025; 11% for 2026 |
What The Multiple Is Refusing To Pay For
The median price-to-earnings ratio ended 2025 at 9.6x, below its long-term average, while estimated median EPS growth was 12% for 2025 and 11% for 2026. A cheap multiple next to double-digit earnings growth isn't an automatic bargain. It's a statement that buyers don't trust the earnings to repeat. Pair that multiple with return on equity for banks when you want the equity-side view of the same profit, then ask which dollars of EPS came from spread, fees, or a release.
Net interest margin at 3.34% in the third quarter of 2025 sits above the 3.25% pre-pandemic average, and community banks printed 3.73%. A wider spread supports the share price only when funding is stable and the assets repricing are credits you still want. Return on assets at 1.20% tells you profit per dollar of balance sheet, not whether that profit is concentrated in one quarter's credit costs.
Marks And Reserves Beside The Earnings
Unrealized securities losses of $337.1 billion fell 14.7% from the prior quarter and still sit on tangible equity until the bonds mature or rates move. The allowance-to-noncurrent-loans ratio at 178.4%, down from 179.4%, is a thinner cushion, not a collapse. Direction matters more than the single print. Coverage that slips while noncurrent loans rise is a different share-price story from coverage that slips because problem loans were cured.
Board read: a rising margin with a growing securities hole is not the same credit as a rising margin and a clean bond book.
Read the lines in pairs. Margin up and unrealized losses up means profitability improved while rate risk didn't. EPS up and the multiple stuck at 9.6x means the market already haircut the growth. ROA up and allowance coverage down means this year's return used some of next year's reserve. That's the scorecard. Everything else in a share-price narrative is commentary on these rows.
Benchmarking Bank Shares Against The Right Peers
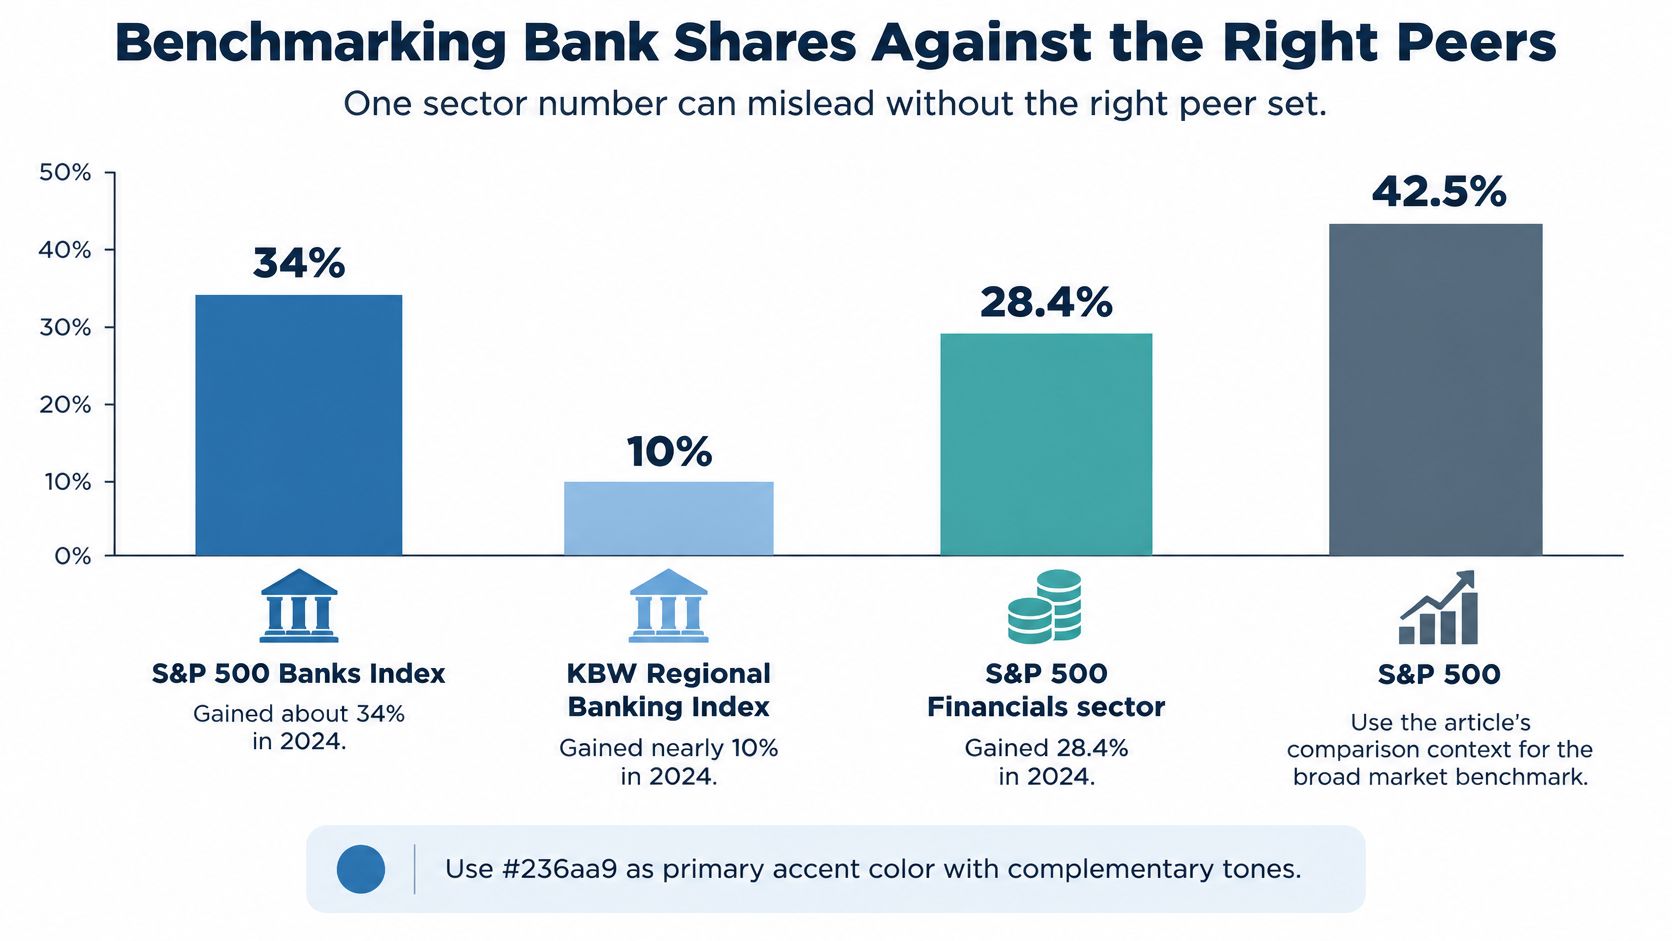
In 2024, the S&P 500 Banks Index gained approximately 34%, while the KBW Regional Banking Index rose nearly 10%, according to Reuters' report on 2024 market performance. The S&P 500 Financials sector advanced 28.4%, and the S&P 500 delivered a 25.0% total return. Large, diversified banks outpaced regional banks by roughly 24 percentage points and the broad market by about 9 percentage points. Those differences show why a sector headline can obscure how business mix and balance-sheet exposure shape share performance.
The Year Before Ran The Other Way
A single up year is a weak basis for peer selection. Mercer Capital reported that the Nasdaq Bank Index and KBW Nasdaq Regional Bank Index both declined in 2023. Regional shares fell less than the broader bank index that year, then lagged in the 2024 rebound. A two-year comparison therefore gives a different read than either year alone.
| Index or Benchmark | 2023 Return | 2024 Return |
|---|---|---|
| S&P 500 Banks Index | , | About 34% |
| KBW Regional Banking Index | , | Nearly 10% |
| S&P 500 Financials sector | , | 28.4% |
| S&P 500 total return | , | 25.0% |
| Nasdaq Bank Index | -7% | , |
| KBW Nasdaq Regional Bank Index | -4% | , |
The index split reflects differences in business mix. Large banks can draw on fee income, trading, scale, and funding access. Regional banks may have greater exposure to commercial real estate, deposit competition, and concentrated loan books. A bank without a trading business should not use a money-center rally as its main performance hurdle.
How To Build The Comparison
Choose peers by asset size, business model, geography, and index construction. Compare relative returns over at least two calendar years, using total return with dividends and the same calendar window for the bank and its benchmark. Report the difference in percentage points, not dollars.
For a $12 billion regional bank with 60% of loans in commercial real estate, a regional index is a more relevant comparison than the S&P 500. A flat year against a regional gauge is a different result from a flat year against the broad market. If a financials ETF is part of the comparison, explore XLF compliance details before treating it as a bank-only peer.
Build a peer set of 10 to 15 institutions and compare its share returns with the matching index each quarter. A bank peer group analysis is useful when the selected institutions compete for similar deposits and loans. A close operating match makes the comparison more informative than a famous index.
Separating Durable Earnings From Temporary Profit
In the third quarter of 2025, industry net income reached $79.3 billion, up $9.4 billion, or 13.5%, from the prior quarter, according to the FDIC's third-quarter 2025 earnings release. A $9.2 billion, or 30.7%, decline in provision expense contributed nearly as much as the full profit increase. Net interest income rose $7.6 billion, or 4.2%, while higher taxes and noninterest expense partly offset the gains.
| Earnings Driver | Change vs. Prior Quarter | Durability Test |
|---|---|---|
| Net income | Up $9.4 billion (13.5%) to $79.3 billion | Outcome of the drivers below, not a driver itself |
| Provision expense | Down $9.2 billion (30.7%) | Reverses if credit costs normalize |
| Net interest income | Up $7.6 billion (4.2%) | Recurring if spreads and loan growth hold |
| Higher taxes and noninterest expense | Partly offset the gains | Partly controllable through cost programs |
Two Banks, Same 15% Headline
Take two lenders that each report 15% earnings growth. The headline is identical; the quality of the growth is not.
Bank A generated most of its growth from lower provisions. If credit costs normalize, that contribution can reverse, leaving the share-price gain vulnerable. Flag any quarter where provision relief explains more than half of the earnings increase. At roughly 98% of the gain, this industry quarter is well past that line, so provision relief, not operating performance, drove most of the increase. The comparison of the provision decline with the net profit increase also shows why the NII gain alone does not establish a clean operating beat: taxes and expenses absorbed part of it.
Bank B generated its growth from net interest income. That earnings stream is more durable if spreads and loan growth hold. A dashboard that separates net interest income, provisions, fees, expenses, asset quality, and capital, then compares each with peers and the prior period, prevents a 15% print driven by credit-cost relief from being treated as equivalent to one driven by ongoing operations.
Why The Multiple Stayed Cheap
Valuation put a price on earnings durability in 2025. Mercer Capital reported that the median bank's share price rose 8%, while estimated median EPS growth reached 12% for 2025 and 11% for 2026. Yet the median price-to-earnings ratio ended the year at 9.6x, below its long-term average. The gap suggests that buyers were not treating forecast EPS growth as assured: margin durability, balance-sheet rate risk, expected regulation, and revenue quality remained relevant. Large banks found support from capital-markets activity and anticipated deregulatory benefits, while smaller banks lagged.
A low multiple can reflect rational doubt about earnings quality, not a missed bargain.
Apply the same discipline to individual banks. If a lender reports 12% EPS growth, with 4 points from a securities gain, model recurring growth at roughly 8%. Lead the board pack with recurring revenue, then the provision effect, then the net result. The sequence makes clear which gains the franchise can sustain and which depend on conditions that may reverse.
When Margin Gains Hide Balance-Sheet Risk
A higher net interest margin isn't automatically good news for the shares. In the third quarter of 2025, net interest margin rose 9 basis points to 3.34%, above the pre-pandemic average of 3.25%, and the community-bank margin reached 3.73%, the FDIC's third-quarter 2025 banking profile shows. In the same quarter, unrealized securities losses were still $337.1 billion after a 14.7% quarterly decline, and the allowance-for-credit-losses-to-noncurrent-loans ratio eased from 179.4% to 178.4%.

The question to ask is where the extra spread came from. Healthy asset repricing and stable funding are one source. Riskier loan growth, lagging deposit costs, or a rate backdrop that won't last are the others. Banks with similar share-price gains can sit on very different commercial real estate, consumer stress, long-duration bonds, uninsured deposits, and refinancing risk.
Same Margin, Opposite Shares
Say Bank X and Bank Y both show a 3.9% margin and the same year-to-date share gain. Bank X is funded by low-cost deposits and holds short-duration assets. Its margin can survive a repricing cycle, and the share gain is describing balance-sheet strength. Bank Y holds long-duration securities and a high share of uninsured deposits. It reports the same margin while carrying a rate and liquidity shock the share price hasn't priced. Treating those two ticks as confirmation of each other is how a board applauds the wrong franchise.
Watch these indicators for direction, not for a magic threshold:
- Unrealized losses relative to tangible common equity: a ratio that climbs is equity the market will eventually notice.
- Noncurrent-loan trend: flat or falling problem loans support the margin story. A rising trend doesn't.
- Reserve coverage: slipping coverage against rising problem loans is a warning, not a efficiency gain.
- Deposit beta: funding costs that reprice faster than asset yields will take the margin back.
- Loan concentrations: one property type or one sponsor can dominate a small book.
- Capital generation: retained earnings have to refill capital if marks or credit costs hit.
A bank can report better profitability and become more exposed to a rate or credit shock in the same quarter. Put the profitability line and the risk lines on the same page. If the share price has run and only the margin improved, you don't have evidence that risk fell. You have evidence that earnings, for now, look better.
Early Warning Signals Before Bank Shares Fall
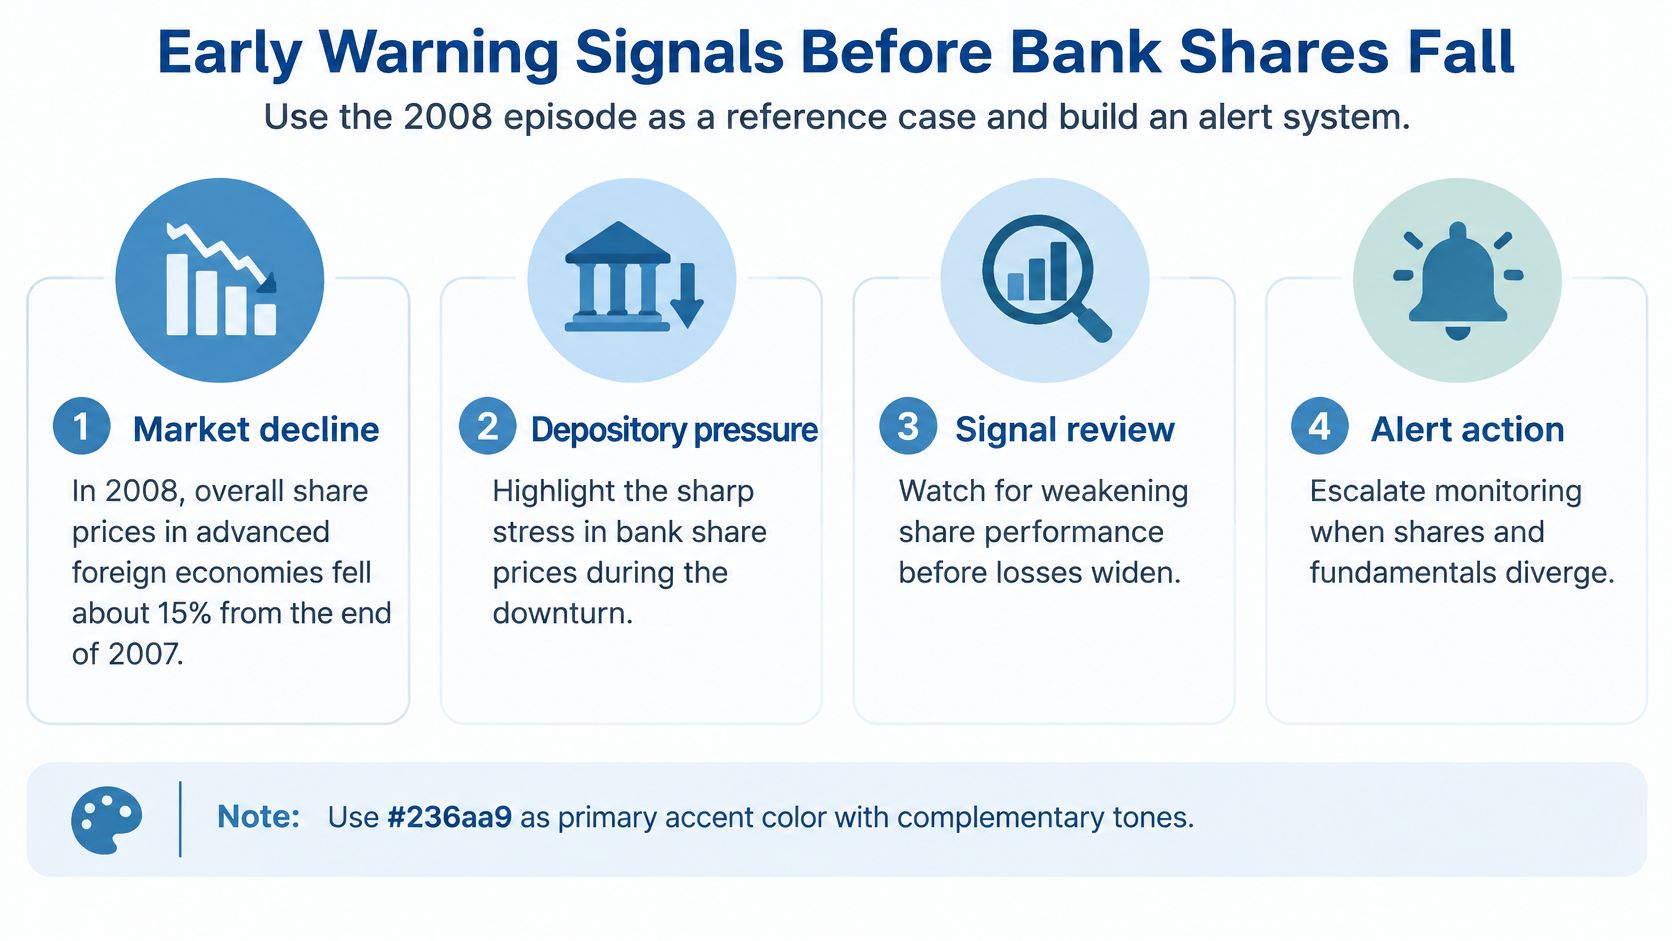
Bank equity breaks before the broad market when investors doubt solvency. In its 2008 Annual Report, the Federal Reserve reported that overall share prices in advanced foreign economies had fallen approximately 15% from the end of 2007. Depository institutions fell an average of 37%, and broker-dealers declined 41%. That gap, roughly 22 to 26 percentage points worse than the overall market, is what borrowing does. Equity absorbs losses before depositors and senior creditors, so a tolerable index year can sit next to a severe loss in bank shares.
What To Watch Before The Price Breaks
You don't need a crisis to use the pattern. Monitor a short list, and don't wait for all of it to flash.
- A widening gap between your shares, or your peer index, and the broad market.
- Rising noncurrent loans, especially in one book.
- Falling reserve coverage against those loans.
- Unrealized securities losses growing against equity.
- Funding costs rising faster than asset yields.
- Concentration in one property type or one deposit source.
The Texas ratio for banks belongs on that list because it compresses problem assets and capital into one early read. It doesn't replace the share price. It tells you whether the price is late.
| Alert Level | Trigger | Required Response |
|---|---|---|
| Watch | One signal moves for two quarters | Log it in the account plan and monitor next quarter |
| Act | Two signals move together | Hold a review with the lending team within the quarter |
| Escalate | A capital or funding signal moves | Escalate to senior risk leadership the same day |
Route the alert by email, Slack, or the CRM so the relationship owner sees it the same day. A signal that waits for the monthly pack is a signal the client will hear about from someone else.
Say a regional bank's shares lagged its index for three quarters while reserve coverage fell from 180% to 150%. That's two signals together, so it's an act-level review with the lending team inside the quarter, not a note for the next strategy offsite. If the third move is a jump in wholesale funding or a capital ratio sliding toward the internal minimum, it escalates the same day. The 2008 gap shows why. By the time depository shares are 22 percentage points behind the market, the conversation with the client is about damage, not about design.
Turn Share Performance Data Into Your Next Move
A quarterly review is useful only if it changes a decision. Use four outputs to turn share performance into an action plan:
- Benchmark shares against the matching index and a peer set of 10 to 15 banks. Output: a one-page peer scorecard.
- Decompose the last two quarters into recurring and temporary drivers. Output: an earnings bridge.
- Pair margin with balance-sheet risk. Output: a risk panel covering marks, coverage, deposit beta, concentrations, and capital generation.
- Choose the two or three signals that would change the account plan. Output: an alert list with an owner.
Then connect the findings to the next conversation. A regional bank with a lagging share price, a strong margin, and a rising deposit beta needs a deposit-retention and funding discussion. Deposit repricing could erode the margin. If the earnings bridge shows that provision relief accounts for much of the result, prioritize a credit review over celebrating the EPS beat.

Visbanking's Bank Performance app supports peer benchmarking and historical trend analysis across 4,600+ institutions. Bank Intelligence surfaces predictive risk and performance signals, with automated alerts. Directors can also monitor large-whale activity as a market check, but ownership activity does not replace analysis of earnings durability or balance-sheet risk. Visbanking's apps don't replace the four-step pack; they shorten the time between a signal and the meeting.
Build the scorecard this quarter, before the next earnings release shapes the client conversation.
Visbanking turns peer returns, earnings bridges, and balance-sheet signals into a quarterly pack directors can act on, connecting bank share performance to earnings durability rather than a headline EPS beat. Benchmark your institution against the right peers, or explore the underlying data, at Visbanking.
Latest Articles
Brian's Banking Blog
Help to Identify Bank Prospects and Risk Signals
Brian's Banking Blog
API Security Testing Tools: 10 Options for Banks in 2026
Brian's Banking Blog
HMDA Data Reporting: How to File Without Costly Errors

Brian's Banking Blog
Talent Market Intelligence: A Guide for Bank Leaders
Brian's Banking Blog
Bank Loan Performance: Metrics, Formulas and Benchmarks
Brian's Banking Blog