Mastering Return on Equity: A Strategic Guide for Bank Executives
Brian's Banking Blog
For bank leadership, Return on Equity (ROE) is the definitive measure of performance. It cuts through complexity to answer a single, critical question: for every dollar of shareholder capital deployed, how much profit are we generating?
A superior ROE is not merely a data point for a board presentation; it is the hallmark of a disciplined, high-performing institution.
Why ROE Is Your Bank's Ultimate Performance Metric
As a bank executive or director, you are inundated with metrics. While other industries may focus on Earnings Per Share (EPS), for banking, Return on Equity (ROE) remains the most crucial indicator of strategic success.
This focus is not arbitrary—it is embedded in the fundamental structure of the banking business.
The pivot to ROE as a primary target began in the 1970s, as industry leaders recognized its superiority in capturing performance within the constraints of stringent capital requirements.
Unlike a non-financial corporation, a bank's capacity for growth and risk-taking is directly governed by its capital base. As research from the Federal Reserve Bank of New York has long established, ROE provides the clearest lens through which to evaluate shareholder value creation in a highly regulated and competitive environment. Further analysis on why banks target ROE confirms its strategic importance.
The Strategic Importance for Leadership
A strong ROE is more than a metric; it is a clear signal to the market of leadership's strategic acumen.
A consistently high ROE demonstrates management's command of:
- Profit Generation: Efficiently converting assets into net income.
- Leverage Management: Prudently using shareholder equity to fund the balance sheet.
- Shareholder Value Creation: Delivering a return that justifies the investment and its inherent risk.
In essence, ROE is the ultimate scorecard for capital allocation. It forces a disciplined approach, compelling leadership to ask whether every line of business and strategic initiative is generating a return that exceeds its cost of equity.
This is where precise data intelligence becomes a strategic imperative. Platforms like Visbanking enable leadership to move beyond static, internal ROE reporting.
By benchmarking your institution against a curated peer group, you can deconstruct performance drivers. Is a competitor's superior ROE a function of higher margins, greater efficiency, or simply increased risk appetite? This level of insight transforms a lagging indicator into a forward-looking tool for decisive action. Explore Visbanking’s data to see how your institution compares.
Deconstructing ROE With The DuPont Analysis
A headline ROE figure provides the final score but reveals little about the underlying strategy. To truly understand performance drivers, the number must be deconstructed into its core components. The DuPont analysis is the essential framework for this diagnostic work, disaggregating ROE into three distinct levers of value.
View it not as a mere formula, but as a strategic diagnostic tool. It allows you to examine your bank's financial engine and identify precisely how it generates returns—isolating profitability, operational efficiency, and the application of leverage. A firm grasp of how to analyze financial statements is foundational to this exercise.
The Three Levers Of Bank Performance
The DuPont framework is a strategic map. Each component points to a critical area where executive decisions directly impact performance:
- Net Profit Margin (Profitability): This measures the profit generated from each dollar of revenue. It is a direct reflection of pricing strategy, cost control, and credit risk management.
- Asset Turnover (Efficiency): This indicates how effectively the bank utilizes its assets to generate revenue. A higher turnover ratio signals superior operational efficiency and balance sheet management.
- Equity Multiplier (Leverage): This ratio shows the extent to which assets are funded by shareholder equity. It is a direct measure of financial leverage, which can amplify returns but also magnifies risk.
This infographic illustrates the centrality of ROE and its drivers to modern banking strategy.
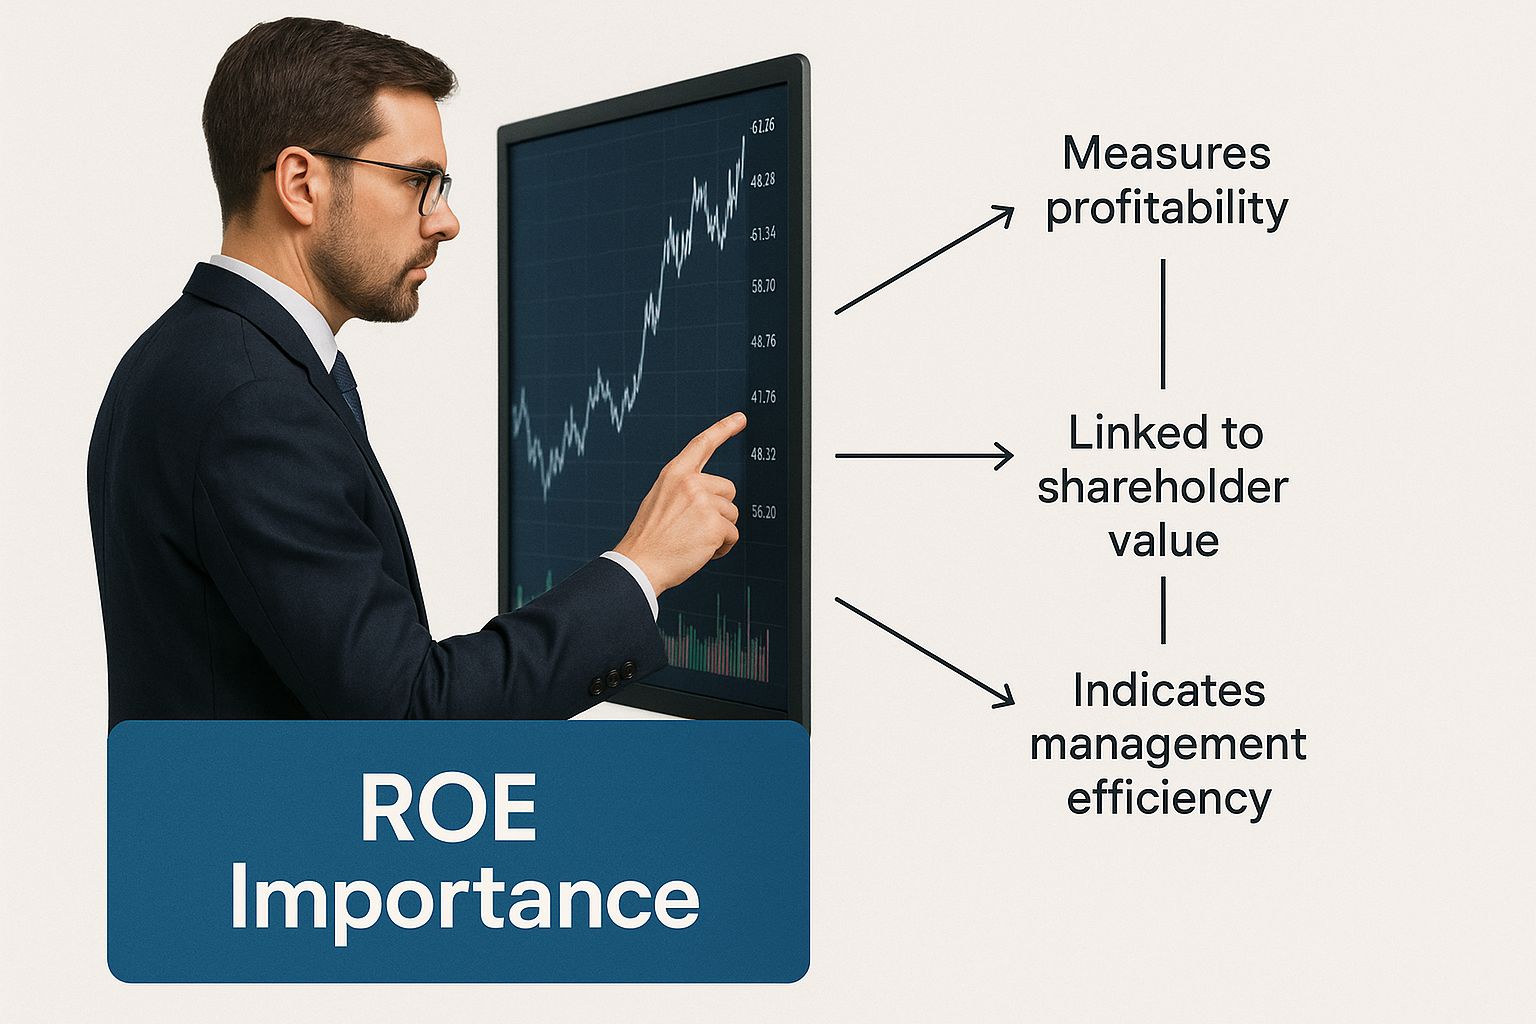
As shown, continuous monitoring of ROE and its components on a digital dashboard has become fundamental to effective strategic oversight.
ROE In Action: A Tale Of Two Banks
Consider two hypothetical institutions, Bank A and Bank B. Both report an identical 12% ROE. However, applying the DuPont analysis reveals two fundamentally different business models and risk profiles.
The following table breaks down how each bank achieves the same 12% ROE.
DuPont Analysis for Hypothetical Banks A and B
| Component | Bank A (Margin-Driven) | Bank B (Leverage-Driven) | Formula |
|---|---|---|---|
| Net Profit Margin | 2.0% | 1.0% | Net Income / Revenue |
| Asset Turnover | 0.75x | 1.00x | Revenue / Average Assets |
| Equity Multiplier | 8.0x | 12.0x | Average Assets / Equity |
| Return on Equity (ROE) | 12.0% | 12.0% | Margin x Turnover x Multiplier |
Bank A achieves its return through strong profitability, suggesting disciplined cost management and effective pricing, supported by a conservative, lower-leverage capital structure.
Bank B, in contrast, relies on higher asset efficiency and aggressive leverage to reach the same 12% ROE, despite having half the profit margin of Bank A. This represents a significantly riskier path to an identical outcome.
This comparison underscores a critical principle: not all ROEs are created equal. Understanding how peers generate their returns is as important as the headline number itself.
This is where data intelligence platforms become indispensable. With a tool like Visbanking, you can deconstruct any competitor's ROE, benchmark each DuPont component against your own, and pinpoint precise strategic divergences. This capability is what enables a shift from reactive reporting to informed decisions that drive sustainable, high-quality returns.
Interpreting ROE in Today's Economic Landscape
An ROE figure in isolation is a vanity metric. Its true meaning is only revealed when viewed against the prevailing economic backdrop. Macroeconomic forces—from interest rate shifts to regulatory changes—directly influence every component of a bank's profitability and capital structure. Context is paramount.

Consider the current interest rate environment. Rising rates can rapidly expand Net Interest Margins (NIM), providing a significant tailwind to profitability and ROE.
However, this is a double-edged sword. The same rate hikes can suppress loan demand, increase credit risk in variable-rate portfolios, and necessitate higher provisions for potential losses. The net impact on the bottom line is often complex and contradictory.
Distinguishing Strategy From Market Tailwinds
The core challenge for leadership is to discern whether strong performance is the result of sound strategy or merely favorable market conditions. Was last quarter's robust ROE a product of superior risk management, or did a rising tide lift all boats? Answering this question correctly is fundamental to strategic planning.
A recent example is illustrative. European banks saw their average ROE fluctuate from 5.9% pre-pandemic to a low of 1.2% during the 2020 crisis, before rebounding to 8.8% in subsequent years. As detailed in the full analysis from the European Central Bank, these dramatic swings highlight the profound influence of economic cycles.
This is precisely why robust data intelligence is no longer optional. A platform like Visbanking allows you to move beyond simple peer comparisons. You can benchmark performance against historical trends during analogous economic cycles. For a review of the core metrics, see our guide on understanding ROA and ROE in banking.
An executive's most critical task is to understand causation. Data allows you to isolate the impact of your decisions from the noise of the market, providing a true and defensible picture of your bank’s performance.
By contextualizing ROE within the broader economic landscape, you transform it from a simple metric into a powerful diagnostic instrument. This data-driven approach is the only way to formulate intelligent strategy, manage investor expectations, and build an institution resilient to market volatility. See how Visbanking’s peer analysis tools can provide the crucial context your team requires.
Putting Your Bank's ROE Strategy into Action
Knowing your ROE is analysis. Improving it is strategy. This is not an accounting exercise; it is a strategic mandate.
The DuPont framework serves as your operational playbook, breaking ROE into its three core drivers: profitability, efficiency, and leverage. Effective leadership involves pulling the right levers at the right time to build sustainable shareholder value.
A surgical approach is required. Deploy specific, targeted initiatives for each component to ensure improvements are deliberate and aligned with the bank's overarching strategy and risk appetite.
Boosting Your Net Profit Margin
Profitability is the engine of ROE. Enhancing the Net Profit Margin requires rigorous attention to both revenue generation and cost management. For example, a bank with $2 billion in revenue and a 20% net profit margin generates $400 million in net income. Increasing that margin by just 100 basis points to 21% adds $20 million directly to the bottom line.
- Refine Loan Pricing and Risk Management: This extends beyond adjusting rates. It involves leveraging data to price risk with precision, ensuring portfolio yield adequately compensates for expected credit losses. The effective use of ratios like the Debt Service Coverage Ratio (DSCR) is a critical discipline in this process, enhancing profitability while mitigating downside risk.
- Expand Non-Interest Income: Over-reliance on net interest income creates vulnerability to interest rate cycles. A focused strategy to grow fee-based income from wealth management, treasury services, or mortgage banking provides a more stable, diversified revenue stream that strengthens the profit margin.
- Optimize Funding Costs: Actively managing the deposit mix is a powerful lever. Shifting the funding base from high-cost certificates of deposit to low-cost transactional accounts can significantly widen the net interest margin.
Driving Efficiency with Asset Turnover
Asset Turnover measures how effectively your bank uses its asset base to generate revenue, serving as a direct proxy for operational excellence. Improving this ratio is about making the entire organization leaner and more productive.
Consider a bank with $10 billion in average assets that generates $500 million in revenue, resulting in an Asset Turnover of 0.05x. Through back-office automation and branch network optimization, it increases revenue to $550 million without growing its asset base. The turnover ratio improves to 0.055x.
This 10% improvement in efficiency contributes directly to a higher ROE, demonstrating a more productive use of the balance sheet.
A relentless focus on the efficiency ratio is non-negotiable. Every basis point of cost saved through technology, process optimization, or improved vendor management is a direct contribution to shareholder returns.
Mastering Leverage with the Equity Multiplier
The Equity Multiplier amplifies returns, but it must be managed with discipline. Increasing leverage provides a mechanical lift to ROE but also elevates risk and invites regulatory scrutiny. The objective is not to maximize leverage, but to optimize it.
A prudent capital management strategy includes:
- Strategic Share Repurchases: When the bank's stock trades below its intrinsic value, buybacks are an efficient mechanism to return capital to shareholders and increase ROE by reducing the equity base.
- Disciplined Dividend Policies: A predictable dividend policy signals financial strength and maintains investor confidence. This must be balanced against the need to retain earnings for growth and maintain robust capital adequacy.
Ultimately, every significant decision—from a product launch to an acquisition—must be evaluated through the lens of its impact on ROE. By using a data intelligence platform to benchmark each DuPont component against a well-defined peer group, you can identify precise areas of opportunity.
This approach transforms ROE from a historical metric into a forward-looking tool for decisive leadership. See how Visbanking’s analytics can provide the clarity needed to execute these strategies.
Benchmarking ROE for a Competitive Advantage
Evaluating your bank's ROE in isolation is a strategic failure. A 12% ROE may appear satisfactory, but it becomes a point of concern if direct competitors are consistently achieving 15%.
Effective benchmarking is not a simple numerical comparison. It is a strategic analysis to understand the drivers behind peer performance. This is how routine reporting becomes actionable competitive intelligence.
The process begins with defining an appropriate peer group. Comparing a $500 million community bank to a $50 billion regional institution yields distorted and useless insights. A precise peer set must be constructed based on asset size, geography, and business model.
Looking Beyond the Headline Number
With a relevant peer group established, the real analysis can commence. A competitor's superior ROE does not inherently signify superior management. It may be the outcome of a higher-risk strategy that you would consciously choose not to emulate. This is where data intelligence provides critical differentiation.
Suppose your bank and a key competitor both report a 14% ROE. On the surface, performance appears equal. However, using a platform like Visbanking to perform a DuPont decomposition reveals a critical strategic divergence:
- Your Bank: Achieved with a strong 1.2% Return on Assets (ROA) and a moderate Equity Multiplier of 11.7x.
- Competitor Bank: Reliant on a thin 0.8% ROA, amplified by a much higher Equity Multiplier of 17.5x.
This single insight reframes the entire competitive landscape. Your competitor is not more profitable; they are simply more leveraged. You can now articulate to your board that your institution's ROE is of higher quality and is more sustainable. This level of granular analysis is central to understanding the full suite of bank performance metrics.
This dashboard view demonstrates how modern platforms enable side-by-side comparison of key metrics against a custom peer group.
The ability to instantly benchmark your efficiency ratio or net interest margin against direct rivals reveals opportunities and threats that are otherwise invisible.
Uncovering Threats and Opportunities
Consider this scenario: A new competitor enters your market and begins to gain share. Their marketing is aggressive, but their public financial statements appear unremarkable. You leverage a data platform to benchmark their efficiency ratio against yours.
You discover their non-interest expense is 30 basis points lower than yours. This is not a rounding error; it is a significant structural cost advantage funding their aggressive loan pricing and marketing campaigns.
What began as a routine benchmark is now identified as a direct strategic threat demanding an immediate response. Without that component-level analysis, leadership would be operating blind, reacting to market pressure without understanding its source.
True competitive advantage is derived from insights others miss. The ability to benchmark every component of return on equity for banks is what separates data-driven leaders from the competition.
Looking Ahead: A Storm on the Horizon for Global Bank ROE?
The strong return on equity for banks in recent years has been heavily supported by a significant tailwind: rising interest rates. This environment has been beneficial for net interest margins, but this cycle will not last indefinitely.
As macroeconomic conditions shift and interest rates normalize or decline, bank leadership must prepare for the inevitable margin compression.
Relying on a favorable rate cycle is not a sustainable strategy for value creation. Enduring success is built on fundamentals—the core drivers of profitability that are resilient to macroeconomic shifts.
The Real Story Behind the Recent Numbers
A recent McKinsey analysis on global banking performance revealed a sobering reality. In 2023, global banks reported an average Return on Tangible Equity (ROTE) of approximately 11%.
However, a deeper analysis showed that absent the benefit of higher rates, the industry’s underlying ROTE would have been closer to 8%. This is dangerously close to, or even below, the cost of capital for many institutions.
This exposes a critical vulnerability. Should rates decline as projected, industry ROTE could revert toward the cost of equity within two years, erasing recent gains and exposing underlying operational weaknesses.
For executive teams, this is a clear call to action. The time to build a more resilient earnings model is now—one founded on superior operational efficiency, diversified non-interest income, and rigorous cost discipline—before the macroeconomic tide recedes.
Waiting until margins are actively contracting is a strategic error. The time to stress-test your strategy and benchmark your operational efficiency against best-in-class peers is today.
Tools like Visbanking are designed for this purpose. They provide the analytical power to dissect competitor strategies and identify the structural advantages necessary to protect your return on equity, regardless of interest rate direction.
Big Questions from the Boardroom on Bank ROE
In any strategic review, certain key questions regarding ROE invariably arise. As an executive or director, you must provide clear, data-driven answers. These are not academic queries; they go to the heart of how you are creating sustainable shareholder value.
Here are the most common questions and how to address them.
So, What’s a “Good” ROE for a Bank?
While a 10-15% range is often cited, this is a misleading simplification.
A "good" ROE is one that consistently exceeds your bank's cost of equity. If your institution is not clearing this hurdle, it is, by definition, destroying shareholder value.
The appropriate target is specific to your institution and depends on its risk profile, business model, and the prevailing economic conditions. A 12% ROE achieved with a conservative, well-capitalized balance sheet is far more impressive than a 14% ROE generated through excessive risk and leverage. Context is determinative.
How Is ROE Different From ROA?
Think of Return on Assets (ROA) as a measure of pure operational profitability. It assesses management's ability to generate profit from the bank's asset base, independent of how those assets are financed.
Return on Equity (ROE), in contrast, measures the return delivered to the owners. It incorporates the operational profit measured by ROA and then shows how effectively financial leverage has been used to amplify that return for shareholders.
A high ROA indicates efficient management. A high ROE demonstrates that this efficiency is being successfully translated into shareholder value. Both are required for a complete picture.
What’s the Danger of Focusing Only on ROE?
The primary risk of a singular focus on ROE is the temptation to achieve targets through excessive leverage.
You can always mechanically increase ROE by taking on more debt. However, this strategy increases financial risk, strains capital ratios, and attracts negative regulatory attention.
A prudent ROE strategy must be balanced with disciplined risk management and robust capital adequacy. Modern data intelligence platforms are critical here. They allow leadership to view the complete picture—benchmarking not just the headline ROE, but also the leverage and risk components relative to peers. This ensures the pursuit of higher returns does not compromise the safety and soundness of the institution.
At Visbanking, we convert complex financial data into clear, actionable intelligence. Our platform empowers executive teams to move from static reporting to dynamic benchmarking and deep-dive analytics. We provide the data-driven confidence needed to make the strategic decisions that drive superior performance. See how we can sharpen your decision-making.
Related Articles

Visbanking Blog
Capital Banking in the USA: An Overview of Investment Services, Financial Instruments, and Regulations

Visbanking Blog
Bank Failure: Understanding the Risks and Protections for Consumers

Visbanking Blog
Bank Efficiency Ratio Explained: What 60% Really Means

Visbanking Blog
ROA vs ROE: Which Banking Metric Predicts Future Success?

Visbanking Blog
Net Interest Margin Secrets: How Top Banks Maximize Profits

Visbanking Blog