
Annual Contract Value Explained: Formula and Examples
Brian's Banking Blog
Annual contract value is the recurring value of a single contract restated as a 12-month figure, calculated as ACV = total recurring contract value ÷ contract term in years. A two-year subscription carrying $200,000 in recurring fees has an ACV of $100,000, and that's the number you compare against every other deal in the pipeline.
Most bank sales reviews don't have that problem, which is the problem. One relationship manager quotes a three-year platform commitment at its full signed value, another quotes a one-year pilot at list price, and a third folds implementation into the total because the invoice was large. The committee sees three numbers in the same column and reads them as comparable. They aren't. Annual contract value is a good metric undermined by loose definitions, and fixing the definition is cheaper than fixing the forecast later.
What Annual Contract Value Measures and How to Calculate It
The arithmetic takes ten seconds. The judgment takes longer, because the numerator is where deals get inflated. Zendesk's guide to annual contract value as a sales metric describes it as a normalization metric that converts the recurring portion of one customer contract into a 12-month figure, and it excludes non-recurring charges such as implementation, onboarding, setup, consulting and other one-time fees, on the grounds that those items inflate the first invoice without representing repeatable annual revenue.
Think of a commercial lease. The annual rent is the number that tells you whether the space fits the budget. The signing fee, the build-out and the moving costs are real money, and you pay them once. Nobody compares two buildings by adding rent to build-out and dividing by the lease term. Annual contract value follows the same discipline.
Normalization is the entire point. A $60,000 one-year agreement and a $180,000 three-year agreement both produce a $60,000 ACV, per the same Zendesk breakdown of ACV calculation. Ranked on total signed value, the second looks three times larger. Ranked on annual economics, they're identical deals.
| Contract | Recurring fees | Term | ACV |
|---|---|---|---|
| Two-year subscription | $200,000 | 2 years | $100,000 |
| One-year agreement | $60,000 | 1 year | $60,000 |
| Three-year agreement | $180,000 | 3 years | $60,000 |
| Three-year platform plus $40,000 implementation | $300,000 recurring, $40,000 one-time | 3 years | $100,000 |
The last row is the one that trips up relationship teams. A three-year platform with $300,000 in recurring fees and $40,000 of implementation carries a first-year invoice of $340,000 and an ACV of $100,000. Report the invoice and the deal looks 70% more valuable than it is per year.
The three-question check
Before any contract enters a pipeline report, one person should be able to answer three questions in writing.
- What is the total recurring value across the full term? Not the first-year rate, not the booked amount, the recurring total.
- How many years does the term run? Include renewal options only if they're contractually binding.
- Is any one-time fee sitting in the numerator? Implementation, onboarding, setup and training come out.
If the answers aren't recorded next to the number, the number will drift by the next review. Teams rebuilding a metrics sheet from scratch will find a useful short list in which sales numbers indie founders need, which keeps the tracked set small enough to stay honest.
One scope note before comparing anything. ACV is measured per contract or per relationship, not across a book of business. That makes it the right tool for judging a single institution relationship and the wrong tool for describing a company's recurring revenue base.
ACV Compared with ARR, TCV and MRR
Take a hypothetical portfolio of 40 active contracts averaging $75,000 in annual contract value. The recurring base is about $3,000,000 a year. That figure is annual recurring revenue, not ACV, and confusing the two is how board decks end up describing a business that doesn't exist.
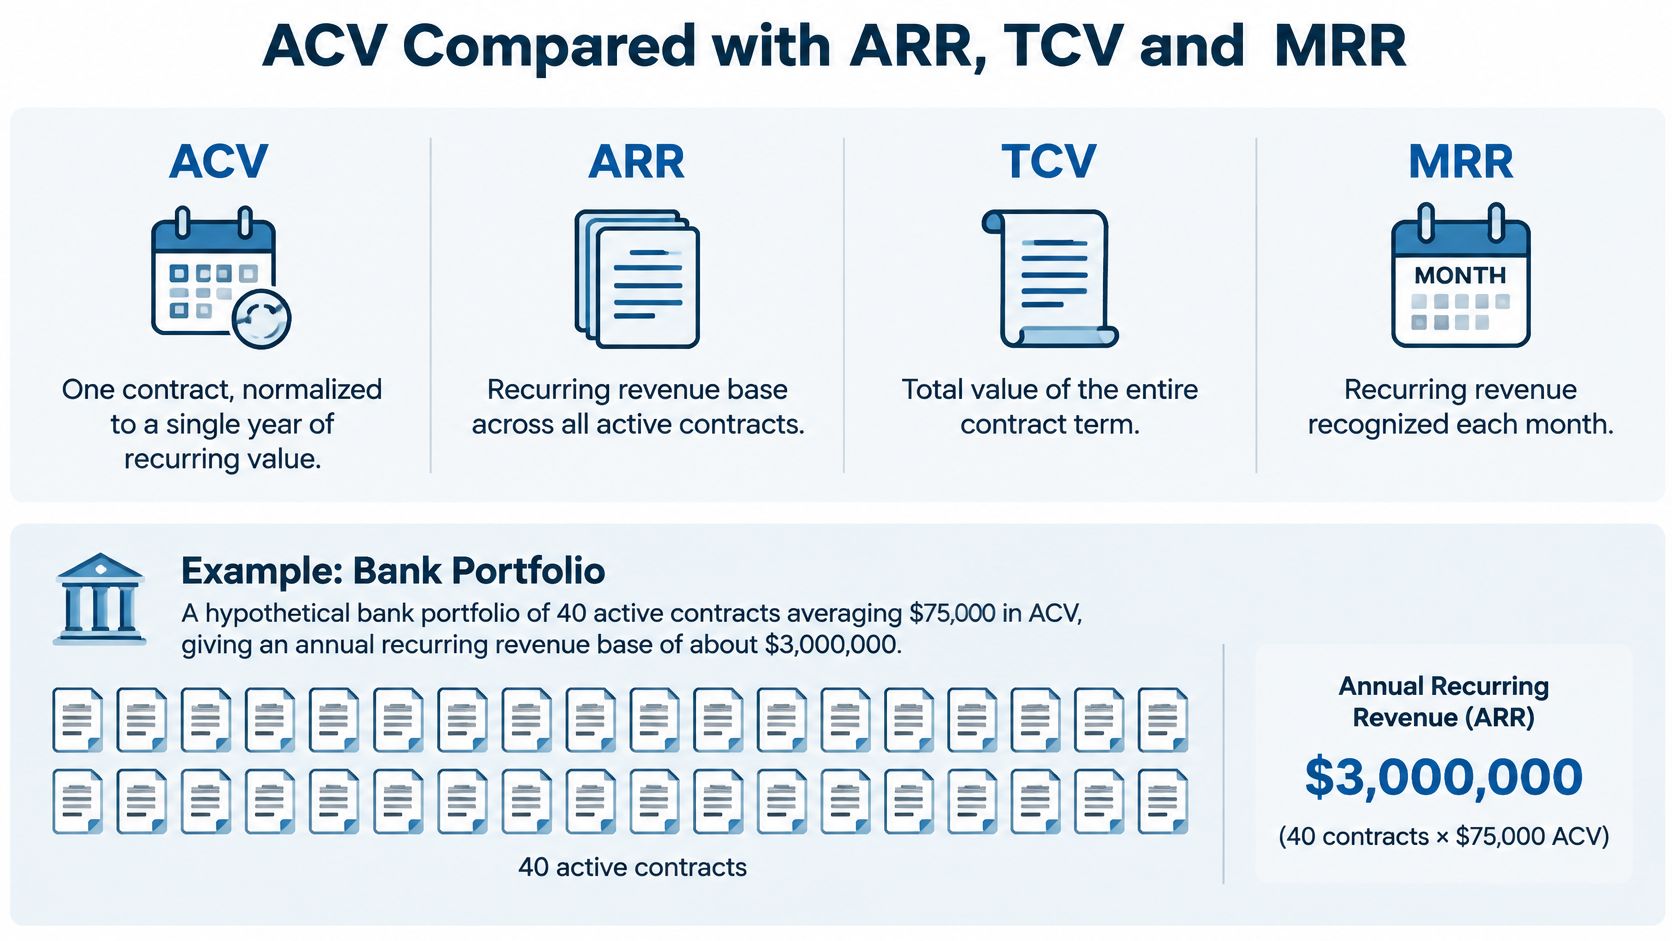
Four measures come up in every review, and each answers a different question.
| Metric | Scope | Calculation basis | Question it answers |
|---|---|---|---|
| ACV | One contract or relationship | Recurring value ÷ term in years | What is this bank relationship worth per year? |
| ARR | Entire active portfolio | Sum of annualized recurring value | How large is our recurring revenue base? |
| TCV | One contract | Total value over the full term, including one-time fees | How large is the signed commitment? |
| MRR | Entire portfolio, monthly | Recurring revenue in one month | How steady is cash flow this month? |
The TCV trap
Total contract value is the figure that flatters. A three-year $300,000 deal is a $300,000 commitment, and it's also a $100,000 a year relationship. Add TCV across a portfolio and multi-year contracts count the same dollars two or three times in a single annual view. A book built mostly on one-year renewals will look smaller than one with a handful of long commitments, even when the annual economics are identical.
That's not an argument against tracking TCV. Signed value matters for backlog, for legal exposure and for capacity planning. It's an argument against quoting it in answer to a question about annual worth.
Reporting rule: ACV per account, ARR for the portfolio, TCV for signed-value tracking only. When a number gets quoted outside its lane, the review loses an hour to untangling it.
The distinction also shapes how pricing decisions get judged. A deal can look strong on ACV while contributing little after delivery costs, which is why margin thinking from Ploot is worth pairing with the revenue line before anyone celebrates a segment average.
How to Calculate ACV for a Multi-Year Bank Contract
A financial institution contract rarely arrives as a clean subscription. It arrives as an order form with platform fees, three data feeds, an implementation statement of work, training days and a minimum usage commitment. The division is trivial. Deciding what belongs in the numerator is the work.
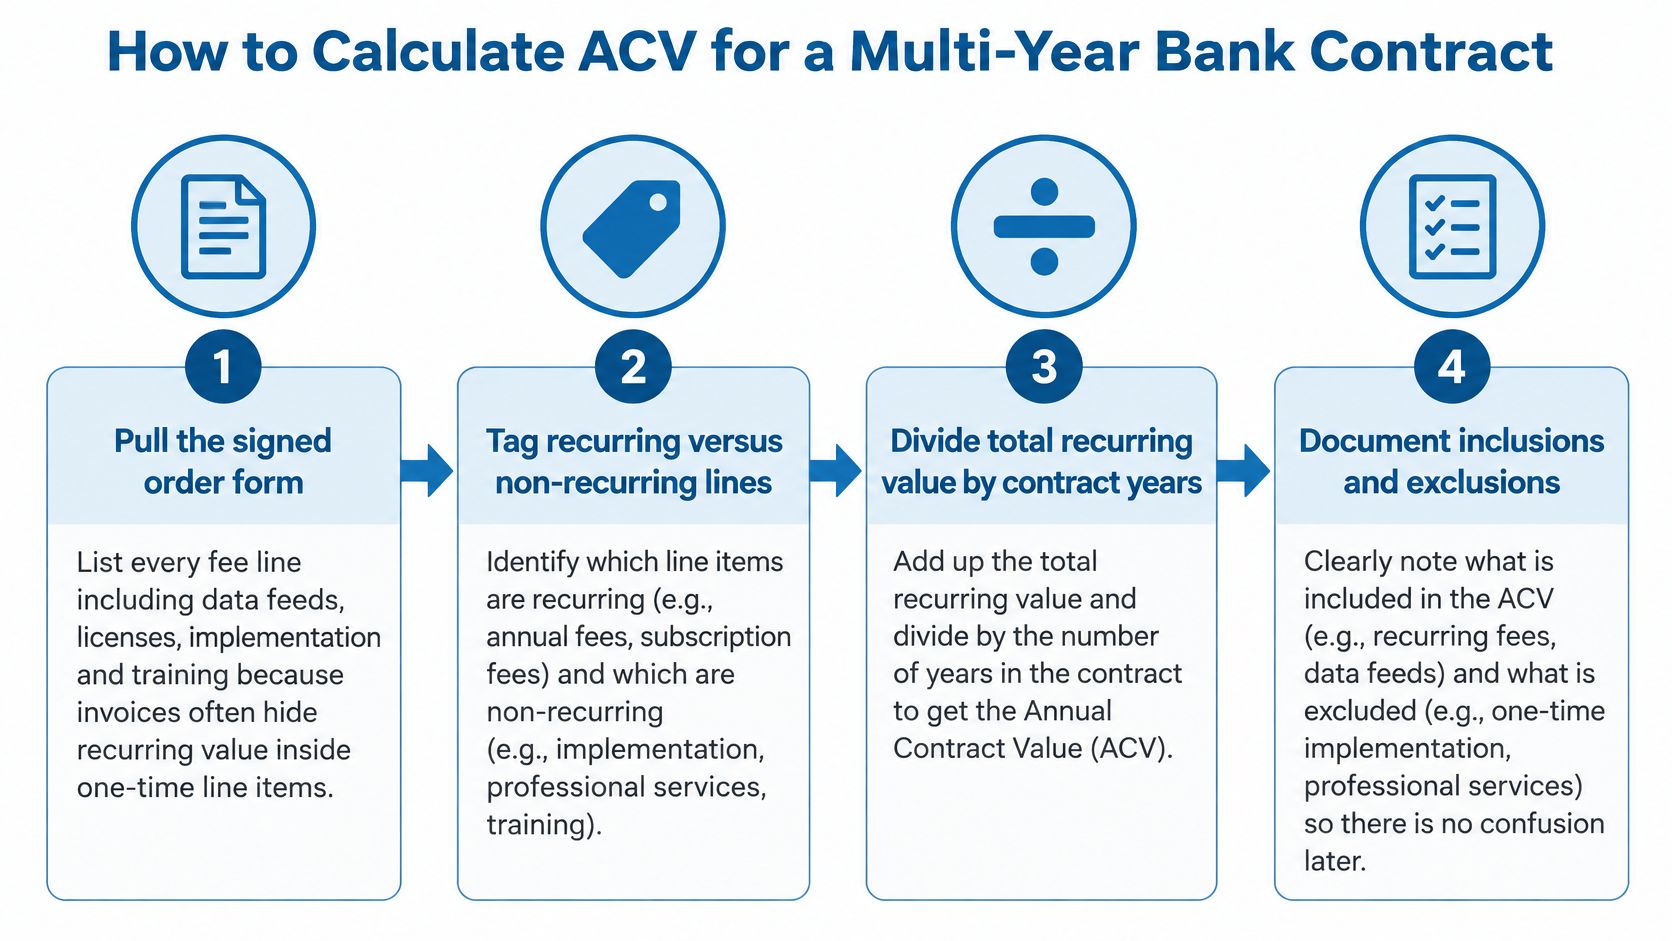
- Pull the signed order form and list every fee line. Data feeds, licences, implementation, training, pass-through charges. Invoices routinely hide recurring value inside a line item labelled as a setup cost, and the only way to catch it is to read the attachments.
- Tag each line as recurring or one-time. Recurring covers platform and subscription fees, data feeds, and committed minimum usage. One-time covers implementation, onboarding, training and setup. The common slip is treating a platform fee billed upfront as one-time because of its timing. Billing timing says nothing about whether the charge repeats.
- Add the recurring fees across the full term. Use contractual minimums rather than a hopeful usage forecast. Minimums are the part the institution has agreed to pay, and a forecast that misses them turns into a variance explanation six months later.
- Divide by the term in years. Here's the worked case. A contract carries $540,000 of recurring fees over three years plus $60,000 of implementation. Adding everything and dividing gives $200,000. Correctly excluding implementation gives an ACV of $180,000, and that $20,000 gap compounds across a portfolio of dozens of contracts.
- For stepped pricing, use the total recurring value across the term. If year one is $150,000 and years two and three are $195,000 each, the three-year recurring total is $540,000, and the ACV is $180,000. Quoting the first-year rate understates the relationship; quoting the final-year rate overstates what the institution pays today.
- Treat midterm expansions as a new ACV starting on the expansion date. Restating the original contract rewrites history and makes renewal performance impossible to read.
- Record free months, early-termination rights and any currency conversion beside the result. Each one changes what the number commits the institution to. A contract with a 90-day termination right for convenience is not economically equivalent to a three-year lock, even at identical ACV.
Sanity check: whenever implementation fees exist, ACV must sit below the first-year invoice. In the example above, the first-year invoice is $240,000 against a $180,000 ACV. If your calculation produces the opposite, a one-time charge is still in the numerator.
Typical ACV Ranges by Customer Segment
Two vendors can report similar ACVs while measuring different commitments. Fix the definition first, then compare like with like. Customer segment is a useful starting point: compiled SaaS benchmark data cited in enterprise pricing statistics puts approximate ACV at $220,000 for public companies focused on enterprise customers, $40,000 for mid-market-focused companies, and $4,800 for businesses focused on small and medium-sized customers.
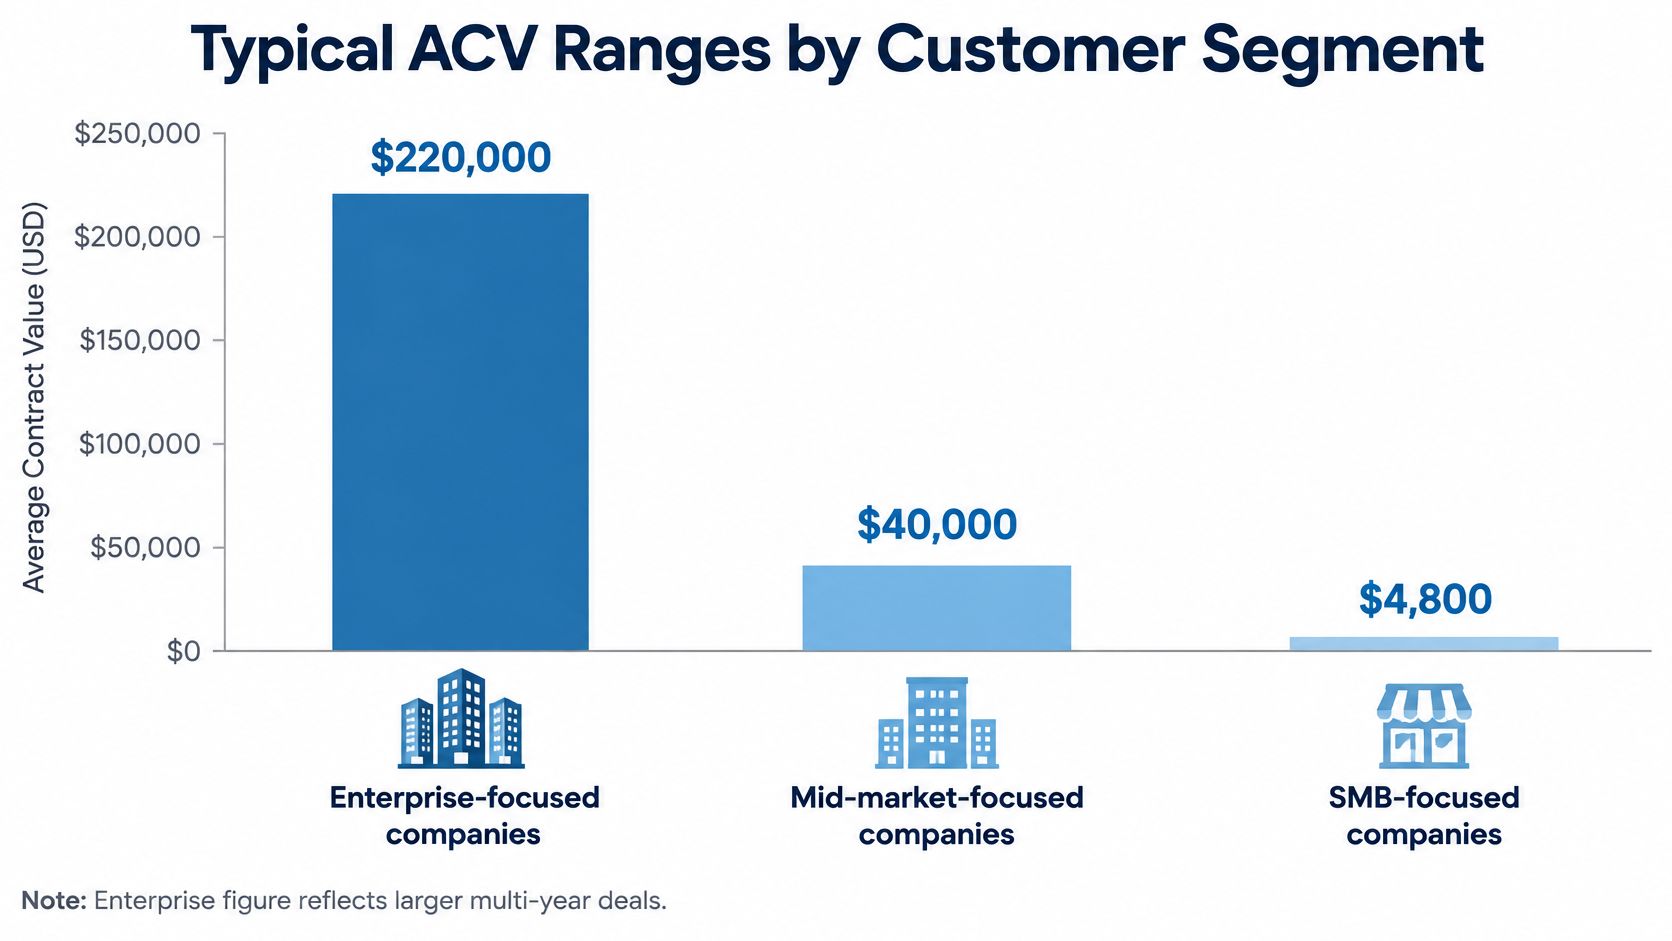
| Benchmark focus | Approximate ACV | Closest bank equivalent |
|---|---|---|
| Enterprise-focused public companies | $220,000 | Larger financial institutions |
| Mid-market-focused companies | $40,000 | Regional banks |
| SMB-focused businesses | $4,800 | Community banks and credit unions |
These are software benchmarks, not banking standards, so treat them as directional anchors rather than targets. The enterprise figure is about 5.5 times the mid-market figure and roughly 46 times the SMB figure. Those gaps reflect differences in the commitments being measured, including deployment breadth, number of users, departments served, support, security requirements, and products included. A bank comparing its ACV with these benchmarks should first check whether both figures include the same recurring services and contract commitments.
What this means for a bank portfolio
Place each prospect in a suitable peer group before setting a target. Visbanking's Bank Performance supports peer benchmarking across 4,600+ institutions, helping sales leaders compare prospects with institutions of similar size and complexity.
Report ACV by segment, such as community banks, credit unions, regional banks, and larger institutions, alongside deal count and renewal data. A blended average can conceal whether growth came from more customers or larger relationships. Those patterns imply different coverage decisions, and a single large institution is not interchangeable with a dozen community-bank relationships when their renewal exposure differs. Segment-level reporting also makes it easier to assess retention economics alongside deal size. For that broader view, read about improving customer lifetime value.
Where ACV Misleads Bank Sales Teams
A rising average ACV can mask weaker growth. One strategic deal may lift the average even as smaller purchases slow, while a multi-year discount can front-load value that will not recur at the same level. Concentration in one account or an expansion likely to contract at renewal can make the headline number look stronger than the portfolio is.
New purchases and renewals can also move differently. Vendr's software trends report indicates that renewal prices have held up far better than new-purchase prices. For bank sales teams, that distinction matters: ACV from signed renewals describes retained commitments, while new-deal ACV depends on continuing to win business.
Consider a pipeline with ten credit-union contracts at $25,000 each and one regional-bank contract at $250,000. Both produce $250,000 in ACV, but the second concentrates that value in one renewal, one procurement cycle and one relationship owner. If the renewal slips, the full $250,000 is exposed, with no other accounts in that example to offset the loss.
The metrics to read alongside ACV
ACV measures deal size, not its quality or the risk attached to it. Read it with other indicators before ranking opportunities.
- Renewal probability: A 90% likelihood across ten small contracts distributes renewal risk more broadly than a 60% likelihood on one large contract.
- Gross retention: Shows whether recurring revenue is holding before expansion makes the total look stronger.
- Sales-cycle length: A 14-month procurement at a large institution consumes capacity that ACV does not capture.
- Implementation cost: Heavy onboarding can erode the first-year contribution from a contract that appears strong on paper.
- Account concentration: Track the share of portfolio ACV held by the top five relationships, and set a ceiling appropriate to the portfolio.
- Pipeline coverage: New ACV is more difficult to sustain when the pipeline cannot replace a lost renewal.
The principle: assess risk-adjusted annual contract value and portfolio resilience, not ACV alone. A smaller book of renewable relationships may be less exposed to the loss of one dominant account.
A concentrated renewal loss also creates a replacement task: rebuilding the revenue requires new sales activity and acquisition spending. Include bank customer acquisition cost in the same review as ACV to see the cost of replacing that value.
How to Define ACV Consistently Across Your Portfolio
Two institutions can report similar annual contract values while measuring entirely different commitments. Annual contract value is a commercial measurement, not an accounting-standard metric, and companies vary on whether implementation, onboarding, training and usage-based charges are included, as Stripe's explanation of ACV in SaaS sets out. That definitional variance is fine across companies and corrosive inside one.

Three measures, kept separate
Report all three rather than picking a favorite, because each one supports a different decision.
- Recurring ACV: platform and subscription fees only. This is the cleanest comparison across prospects and the right input for territory forecasting.
- Committed ACV: recurring fees plus contractual minimums. This is what finance can underwrite, and it's the number to use when evaluating capacity and staffing.
- First-year contract value: everything including one-time fees. This is what the institution pays in year one, and it belongs in cash planning rather than in deal ranking.
Complex financial-institution contracts then raise the awkward cases. Stepped pricing, midterm expansions, early-termination rights, free periods, pass-through costs such as third-party data charges, and contracts denominated in different currencies all change what the annual figure commits anyone to. Each needs a written rule, and the rule needs to be the same one a quarter later.
Comparability beats precision. A narrower definition applied without exception is more decision-useful than a larger number that mixes recurring revenue with services. The bigger figure feels better in a board pack and forecasts worse.
Put the whole thing on one page. Write the definition, list what's included and excluded, name the person who owns the policy, and set an annual review date. Then attach that page to every pipeline report so nobody has to guess which version of the number they're reading.
Benchmark Your Bank's ACV Before the Next Pipeline Review
Run this sequence once and the next review has a defensible baseline.
- Take the 20 largest relationships and apply recurring fees divided by term to each one.
- Tag every account by segment: community bank, credit union, regional bank or larger institution.
- Compare each figure to its segment benchmark and flag anything sitting far above or below the range.
- Check every flagged account for concentration, renewal probability and expansion or contraction history before it gets ranked.
- Adopt the written definition so next quarter's numbers match this quarter's.
The decision that follows is straightforward: whether coverage and marketing effort should shift toward accounts with high risk-adjusted annual contract value, or toward segments where the relationships are smaller and steadier. Both can be right. Guessing between them is not.
Visbanking's pricing depends on your use case and team size, so request a demo for specifics, and use our Sales contact option for pricing, demos and enterprise questions. Benchmarking against 4,600+ institutions in Bank Performance gives you the segment range before you set the target, and what performance benchmarking covers explains how those peer sets get built.
Visbanking turns bank intelligence into decisions your sales team can act on, from peer benchmarking across 4,600+ institutions to prospect data that shows which banks are ready for a new relationship. When you're ready to compare your portfolio against real peer ranges instead of guesses, explore the platform at Visbanking and see how the numbers line up for the institutions you cover.
Latest Articles
Brian's Banking Blog
8 Case Study Examples Banking Executives Can Reuse

Brian's Banking Blog
Configure Price Quote Explained for Bank Executives
Brian's Banking Blog
Bank Marketing Regulations: A Guide for Bank Executives
Brian's Banking Blog
What Is Predictive Analytics? a Guide for Bank Leaders

Brian's Banking Blog
Agentic AI in Banking: What It Is and How It Works

Brian's Banking Blog