Mastering Bank Peer Group Analysis for Strategic Advantage
Brian's Banking Blog
Bank peer group analysis is the discipline of benchmarking your institution against a carefully selected group of comparable banks. It moves beyond historical self-assessment to provide essential context on performance against direct competitors. For bank leadership, this is not a regulatory check-box exercise; it is a fundamental tool for strategic decision-making.
A well-executed peer analysis answers the most critical question on any executive's mind: "How are we really performing?"
Why Peer Analysis Is a Strategic Imperative

Operating without a clear view of the competitive landscape is like driving blind. In a dynamic banking environment shaped by fluctuating interest rates and shifting depositor behavior, internal-only metrics are insufficient. You require a precise understanding of your performance relative to your rivals to lead effectively.
A disciplined peer analysis illuminates your bank's true market position, exposing hidden vulnerabilities and validating strategic initiatives.
It provides data-driven answers to core business questions:
- Loan and Deposit Strategy: Are our product pricing and composition competitive? For instance, if our cost of funds is 50 basis points higher than the peer median, is it due to an aggressive rate strategy or an unfavorable deposit mix?
- Operational Efficiency: How does our non-interest expense per employee compare to institutions with a similar operational footprint? An efficiency ratio of 55% against a peer average of 60% is a quantifiable advantage.
- Profitability and Risk: Is our Return on Assets (ROA) or Net Interest Margin (NIM) leading the peer group, or does a lag indicate underlying issues in asset quality or pricing power?
The Critical Importance of Peer Group Selection
The value of any analysis hinges on the quality of the peer group. Data from the Federal Financial Institutions Examination Council (FFIEC) illustrates this point clearly.
For example, FFIEC Peer Group 5, which includes 1,205 U.S. banks, reports an average ROA of 1.16%. However, individual performance within this group ranges from -1.94% to 9.47%. This vast dispersion demonstrates the necessity of filtering out statistical noise and irrelevant institutions to create a meaningful benchmark. You can review these aggregate numbers on the FFIEC's public site.
A peer group is not merely a list of banks in your asset class. It is a reflection of your strategic reality—your market, your business model, and your competitive ambition.
A precise peer analysis delivers the data-driven clarity required for confident leadership. Using an advanced intelligence platform like Visbanking’s BIAS, executives can move beyond guesswork, benchmark against a truly relevant cohort, and translate sharp insights into decisive action. To begin, it is crucial to identify the key performance indicators (KPIs) that form the foundation of any rigorous comparison.
Core Metrics in Peer Group Analysis
The following table outlines essential metrics used to compare institutions and the strategic questions they help answer for executive leadership.
| Metric Category | Key Performance Indicator (KPI) | Strategic Question It Answers |
|---|---|---|
| Profitability | Return on Assets (ROA) | How efficiently are we deploying assets to generate net income? |
| Profitability | Net Interest Margin (NIM) | Is our core lending and funding model generating a superior spread? |
| Efficiency | Efficiency Ratio | How much non-interest expense is required to generate one dollar of revenue? |
| Capital Adequacy | Tier 1 Leverage Ratio | Is our capital base sufficient to absorb unexpected losses? |
| Asset Quality | Nonperforming Assets to Total Assets | What is the level of inherent credit risk in our loan portfolio? |
| Growth | Loan Growth / Deposit Growth | Are we expanding our core balance sheet faster or slower than our peers? |
| Liquidity | Loans to Deposits Ratio | To what extent is our loan portfolio funded by core deposits? |
This framework covers the vital signs of institutional health. By tracking these KPIs against a relevant peer group, you transform raw data into a clear, competitive narrative that informs where the institution stands and where it must focus its efforts.
How to Define Your True Competitive Set
The entire value of your bank peer group analysis depends on selecting the right peers. A common and costly error is to rely on generic FFIEC groups or simple asset-size comparisons. This approach produces flawed, misleading insights that can obscure serious risks or mask significant opportunities.
Your bank’s strategic reality is far more nuanced. A $1 billion asset community bank in a rural, agriculture-based market operates in a completely different environment than a $1 billion bank in a high-growth urban center. Their business models, client bases, and competitive threats are fundamentally dissimilar. For your analysis to yield actionable intelligence, the peer group must reflect your specific operating reality.
Moving Beyond Asset Size
To construct a strategically relevant peer group, the criteria must be more sophisticated. A robust bank peer group analysis requires viewing potential peers through multiple lenses to ensure a true apples-to-apples comparison.
Key dimensions for defining your competitive set include:
- Business Model: Compare your bank to institutions with a similar strategic focus. Is your primary driver commercial and industrial (C&I) lending, mortgage banking, or treasury management services?
- Geographic Footprint: Select banks operating in markets with similar economic drivers, population density, and growth prospects.
- Market Demographics: Factor in the wealth, age, and financial behavior of the customers you and your true competitors are vying for.
- Operational Scale: Assess institutions with comparable technology stacks and branch networks to accurately gauge efficiency and operating leverage.
This level of detail transforms peer analysis from a compliance exercise into a powerful diagnostic instrument.
The objective is not to find a carbon copy of your bank. It is to build a "strategic cohort" of institutions contending with the same market opportunities and constraints. This is what provides a realistic performance benchmark.
This visual illustrates how to translate peer selection into strategic action.
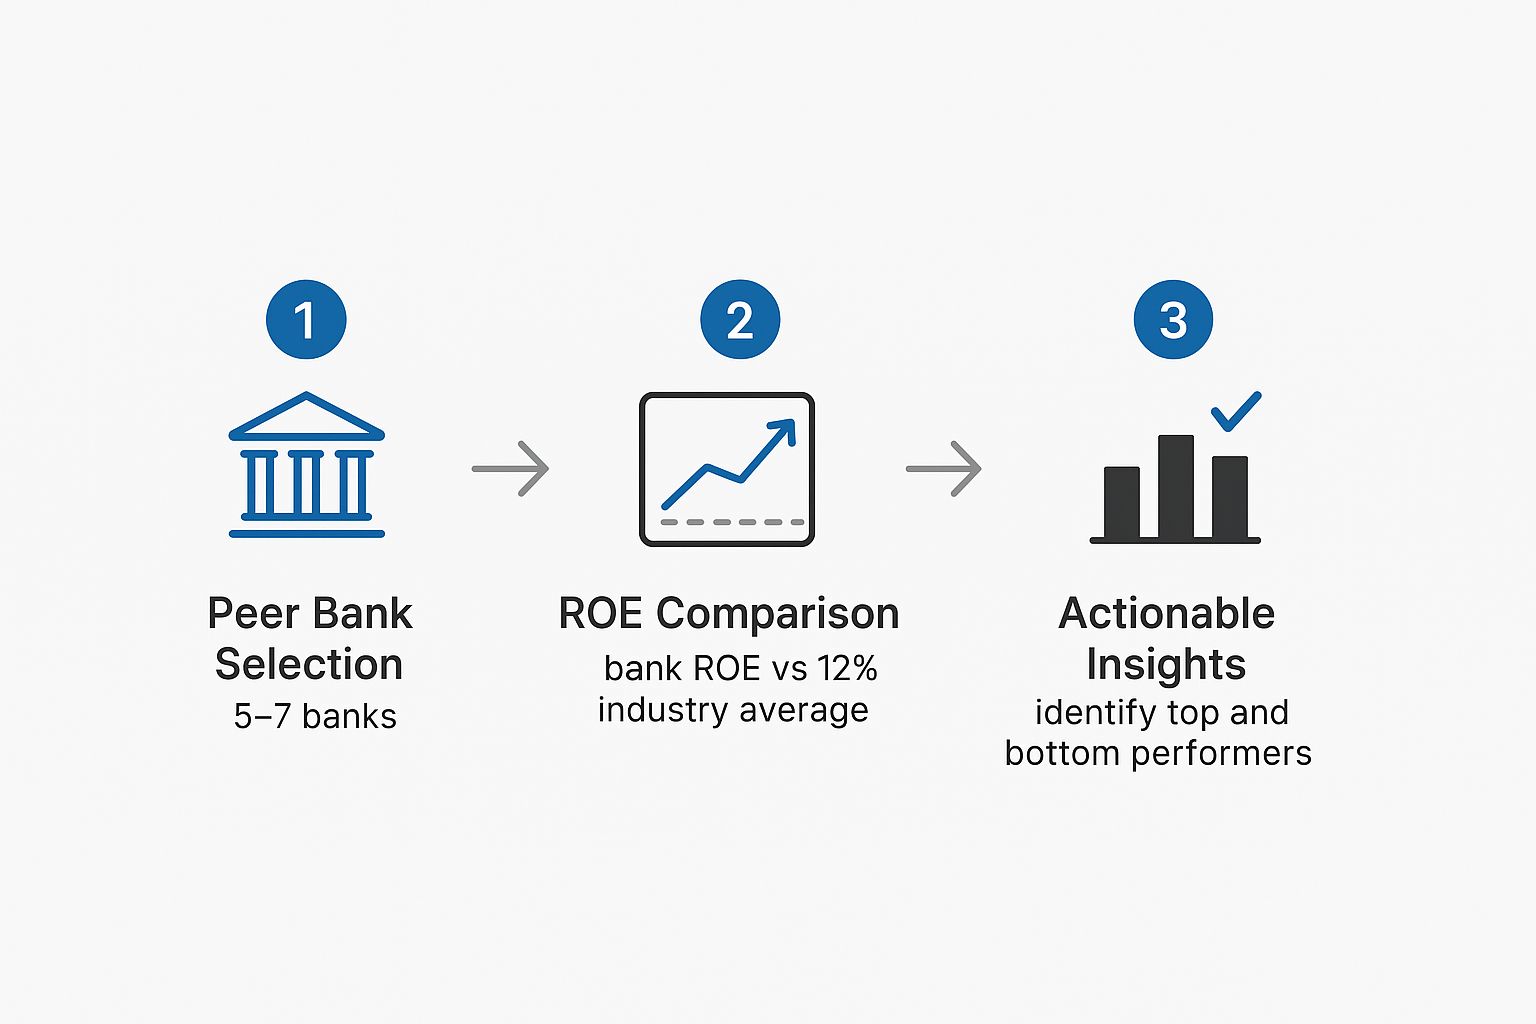
The process flows from selecting the right peers and comparing a core metric like Return on Equity (ROE) to identifying specific performance gaps and strengths. Modern data intelligence platforms like Visbanking’s BIAS are essential here. They enable executives to dynamically build, test, and refine multiple peer groups on the fly.
With the right tools, you can move beyond static, rearview-mirror reports and extract the nuanced, actionable intelligence needed to make superior strategic decisions. It is time to determine how you truly measure up against the competitors that matter.
Turning Peer Data Into Actionable Intelligence

You have defined a relevant peer group. The real work now begins.
Raw data from a peer analysis is inert until it is shaped into a clear narrative that directs executive action. The first step is to benchmark your bank’s key performance indicators (KPIs) against your custom peer set to identify material variances. This is where you transition from high-level observation to sharp, specific inquiry.
From High-Level KPIs to Root-Cause Analysis
Consider a common scenario: your bank's Net Interest Margin (NIM) is lagging the peer median by 25 basis points. A surface-level review is insufficient. Astute leaders must dig deeper to determine if this is a temporary anomaly or a symptom of a fundamental weakness.
A proper peer analysis compels a granular investigation.
- Is our loan pricing misaligned? Are we systematically underpricing new commercial loans relative to peers with a similar risk appetite?
- Is it a funding cost issue? Are our deposit rates excessively high, or are we over-reliant on expensive wholesale funding that is eroding margins?
- Is our balance sheet mix suboptimal? Do we hold a lower concentration of high-yielding assets compared to top-quartile performers in our peer group?
This analytical process moves you from identifying a symptom (low NIM) to diagnosing the underlying cause. To execute this effectively requires an analyst's mindset. Understanding the role of a Financial Planning and Analyst is key to converting a complex dataset into a clear strategic directive.
A peer benchmark isn’t a final report card. It is the starting point for a rigorous internal investigation. The objective is to move from "what" the data says to "why"—and then, most importantly, to "what will we do about it?"
A Practical Case Study in Action
Let's apply this to a real-world example. Imagine your bank's efficiency ratio is 62%, while your carefully selected peer group operates at a leaner 56%. This 600-basis-point gap represents a significant drag on profitability.
This is where a modern business intelligence tool proves its value. Instead of guessing, you can instantly decompose noninterest expenses. You might discover that compensation costs are in line with peers, but technology and occupancy expenses are 15% higher.
Suddenly, a vague goal like "improve efficiency" becomes a precise mission: "We must review our key vendor contracts and re-evaluate our branch network strategy." This is the power of platforms offering seamless financial data integration. They connect the dots for you.
Without this level of detail, leadership is operating in the dark. With it, they have a clear mandate supported by empirical evidence. This is how you convert peer data into strategic leverage. The next move is to dive into the data, benchmark against your true competitors, and take decisive action.
Using Macro Trends to Contextualize Performance

Conducting a peer group analysis in a vacuum leads to incomplete, and often flawed, conclusions. Your bank does not operate in isolation; it is subject to the same broad economic forces as its competitors. To build a resilient, forward-looking strategy, you must overlay your peer comparisons with an understanding of macroeconomic trends, including interest rate cycles, regulatory shifts, and regional economic health.
This contextual layer elevates your analysis from a simple report card to a powerful diagnostic tool. It helps answer critical questions that a direct peer-to-peer comparison cannot.
For example, is your net interest margin (NIM) compressing due to a strategic misstep, or is it an industry-wide squeeze from monetary policy that is affecting your entire peer group? The answer dictates your response. One requires an internal course correction; the other demands a strategy to navigate a challenging market environment.
Connecting Global Trends to Your Balance Sheet
Global and national trends directly impact your balance sheet, shaping competitive dynamics and strategic imperatives. A brief look at asset concentration across major markets highlights these differences.
Global Banking Asset Concentration by Region
A high-level comparison of asset control among top banks in key global markets, providing context for international benchmarking.
| Region | Leading Banks | Combined Assets (Approx.) |
|---|---|---|
| United States | JPMorgan Chase, Bank of America, Citigroup, Wells Fargo | $11.5 trillion |
| Europe | BNP Paribas, HSBC, Crédit Agricole, Santander | €8.9 trillion |
| China | ICBC, China Construction Bank, Agricultural Bank, Bank of China | $18.8 trillion |
These figures, based on recent banking data (you can review global banking statistics on CoinLaw.io for more detail), illustrate that strategies for deposit gathering and loan pricing must be adapted to market structure.
A peer analysis without macro context is like navigating with a map but no compass. It shows you where you are relative to others but fails to indicate the direction the entire landscape is shifting.
Stress-Testing Strategy Against Economic Realities
The most effective use of this contextual layer is in stress testing for banks. How does your credit risk profile compare to your peers' under an adverse economic scenario? If your analysis shows your commercial real estate (CRE) concentration is 20% higher than the peer median, that data point becomes far more urgent when economic forecasts predict a downturn in the CRE sector.
This is where a platform like Visbanking’s BIAS excels. It allows you to filter peer data through various economic scenarios, transforming static benchmarks into a dynamic risk assessment tool.
This integrated approach is the foundation of effective risk management. It ensures your leadership team is prepared not only for today's competition but also for tomorrow’s economic challenges. By adding this layer, your peer analysis becomes a proactive instrument for building resilience and identifying opportunities that others may miss.
Embedding Peer Analysis Into Your Strategic Cycle
For too long, peer group analysis has been treated as a static, annual report—a data autopsy that quickly becomes obsolete. To be effective, it must be a living, dynamic component of your bank's strategic rhythm. When properly integrated, peer data transitions from an "interesting fact" to the foundation of executive decisions and board-level conversations.
The objective is to foster a culture of data-driven accountability. This requires moving beyond static spreadsheets to interactive dashboards. Modern BI tools like our BIAS platform can present key variances at a glance, transforming quarterly board meetings from historical reviews into forward-looking strategy sessions.
From Annual Plan to Daily Decisions
This integration extends beyond the boardroom. Peer data must inform decision-making throughout the strategic cycle. During your annual banking strategic planning, peer performance data serves as a crucial reality check on your ambitions.
For example, if your peer group is averaging 5% loan growth, and your strategic plan targets 10%, the board must ask: "What specific, defensible advantage do we possess that will allow us to capture market share at twice the peer rate?" This grounds strategy in market reality, not aspiration.
This discipline must cascade to your line-of-business teams:
- Lending Teams: Are growth targets and pricing strategies informed by peer performance? A plan to enter a new lending vertical is more credible when supported by data showing how peer institutions are successfully operating in that space.
- Deposit & Treasury Teams: Deposit pricing requires constant benchmarking. If your cost of funds rises 15 basis points above the peer median, it is a critical signal to re-evaluate your funding strategy before it erodes your net interest margin.
Putting Performance in Context and Setting Realistic Expectations
Continuous benchmarking also helps interpret performance in the context of broader economic conditions. For instance, the banking sector is preparing for an increase in credit losses, with some forecasts projecting a rise of roughly 7% to $850 billion.
Simultaneously, an S&P Global report notes that approximately 80% of banking groups maintain stable credit rating outlooks, signaling broad financial resilience. This critical intelligence helps your board distinguish between industry-wide headwinds and institution-specific performance issues.
Your strategic cycle requires a north star: peer performance. When every key decision—from setting loan targets to managing liquidity—is made with this competitive context, you stop reacting to the market and start proactively shaping your position within it.
By embedding peer analysis into your bank's operational DNA, you ensure alignment and accountability across every department. The first step is to see how a dedicated data platform can deliver this clarity to your next board meeting.
Taking Command of Your Competitive Position
For bank executives and directors, operating without a clear view of the competitive landscape is not an option. A rigorous bank peer group analysis provides this clarity, turning a sea of abstract data into a strategic roadmap.
The most critical truth for any banking leader is this: sustained, top-quartile performance is never an accident. It is the direct result of the discipline to consistently measure your institution against the right competitors and the courage to act on the findings. This is what separates market leaders from the rest of the pack.
Consider this scenario: your analysis reveals your loan-to-deposit ratio is 10% higher than your peers, while your net interest margin lags by 15 basis points. This is not merely an interesting data point; it is a critical alert. It provides a clear directive to investigate your funding strategy and loan pricing before profitability deteriorates further. It replaces boardroom speculation with actionable facts.
By embracing a dynamic, customized approach to benchmarking, your bank can proactively manage risk, optimize performance, and seize market opportunities that others miss.
The tools and data for this level of analysis are more accessible than ever. The primary differentiator is a leadership team committed to using them. It is time to see how a dedicated data intelligence platform like Visbanking can empower your bank to perform this essential analysis with precision and ease, turning competitive data into your own strategic advantage.
Your Top Questions About Peer Analysis, Answered
As a bank leader, you require direct answers to guide your strategy. Here are the most common and critical questions regarding bank peer group analysis.
How Often Should We Be Looking at Our Peer Group?
A dual cadence is most effective. The deep-dive analysis should be conducted quarterly, aligned with the release of fresh call report data. This ensures your board and leadership team are operating with the most current intelligence for timely decisions on deposit costs, loan pricing, and other dynamic metrics.
The peer group itself—the list of institutions you benchmark against—should be formally re-evaluated at least annually. However, it must be dynamic. A significant market event, such as the acquisition of a key competitor, requires an immediate reassessment of the group's composition.
What's the Single Biggest Mistake Banks Make in Peer Analysis?
The most common and damaging error is using a poorly constructed peer group. Relying on default FFIEC classifications or simple asset-size sorts inevitably leads to flawed "apples-to-oranges" comparisons. This mistake can conceal significant underlying risks or create a false sense of security, leading to poor strategic decisions.
The foundation of any credible peer analysis is a custom-built, relevant group of peers that accurately reflects your bank’s specific business model, geography, and strategic focus. Defective inputs guarantee defective outputs and can result in costly strategic missteps.
Can Peer Analysis Even Work for a Niche Bank?
Yes. In fact, for a niche institution, a rigorous peer analysis is even more critical for validating its specialized strategy and identifying its true competitors. The objective is not to find an identical twin but to construct a "strategic cohort" of banks operating in the same specialized arena, facing similar opportunities and constraints.
For example, a community bank that is a top-tier national SBA lender should not benchmark itself against a local, mortgage-heavy institution. Its proper peer group consists of other leading SBA lenders, regardless of their headquarters' location. This is precisely where a data intelligence platform becomes indispensable, allowing you to filter by specific business activities to build a peer group that delivers truly meaningful benchmarks.
Ready to take command of your market position with data-driven clarity? Visbanking gives you the tools to build custom peer groups, benchmark with precision, and turn intelligence into action. See how our BIAS platform can empower your leadership team today.
Latest Articles

Brian's Banking Blog
Maximize Banking Growth with Lead Scoring Software

Brian's Banking Blog
What Is ALCO in Banking: Strategic Profit Driver

Brian's Banking Blog
What Is Loan Loss Reserve: Master CECL & Management

Brian's Banking Blog
Fintech Solutions for Banks A Guide to Strategic Adoption

Brian's Banking Blog
D&B Number Meaning for Banks: A Strategic Guide

Brian's Banking Blog