
Help to Identify Bank Prospects and Risk Signals
Brian's Banking Blog
Most bank teams still get the same advice: buy a bigger list, filter on assets, and start calling. That advice manufactures noise. A $900 million bank set beside a $9 billion name is not a peer. A regional operator with 14 branches, counted 14 times, is not 14 buyers. A one-quarter move in the efficiency ratio is not a board issue.
Help to identify the right institution, prospect, or risk is a decision workflow. You name the decision first, pass a data-quality gate, and only then hand a short list to a relationship manager or a director. The point is fewer names you can defend, not another feed nobody trusts.
Match Your Question to the Right Identification Workflow
Start with the decision, not the largest file on the shared drive. Five questions cover nearly every request that lands on a strategy desk. Each one has a primary dataset and a first check that has to clear before anyone calls a customer or books a board slot.
| Question | Primary data | First check |
|---|---|---|
| Which banks look like ours but outperform? | Call Report and UBPR peer data | Peer group has at least five valid observations |
| Which prospects deserve a call this quarter? | Call Report, filings and leadership news | Parent, subsidiary and branch are not counted twice |
| Which performance gaps need board attention? | ROA, net interest margin, efficiency ratio, capital, credit quality | Gap persists across two reporting periods |
| Which risk signals are early warnings? | Lending standards, delinquency, charge-offs, liquidity | Bank trend compared with the industry reading |
| Where is underserved small-business demand? | Local deposits, lending and cash-flow signals | Demand separated from credit quality |
The deliverable is a shortlist of banks that match your target profile, not every charter inside an asset band. Peer work fails when the group is too thin to publish a figure. Prospect work fails when you can't name the person who owns the relationship. A gap in return on assets, net interest margin, the efficiency ratio, capital, or credit quality is a talking point only after it repeats. A risk read without an industry comparison is just your own approval rate. Local deposit, lending, and cash-flow signals can show small-business demand, but demand is not a credit decision until credit quality is split out.
Three checks sit under every row, whatever the question.
- Minimum valid sample: Don't alert off a peer figure a thin group can't support.
- Entity resolution: Resolve the account at the EIN or parent before you count a row.
- Persistence: An alert reaches a relationship manager only after it holds across at least two reporting periods.
A clean account still has to reach a person. Before a shortlist becomes a sequence, use a cold email deliverability playbook so the quarter's calls aren't spent on addresses that never arrive.
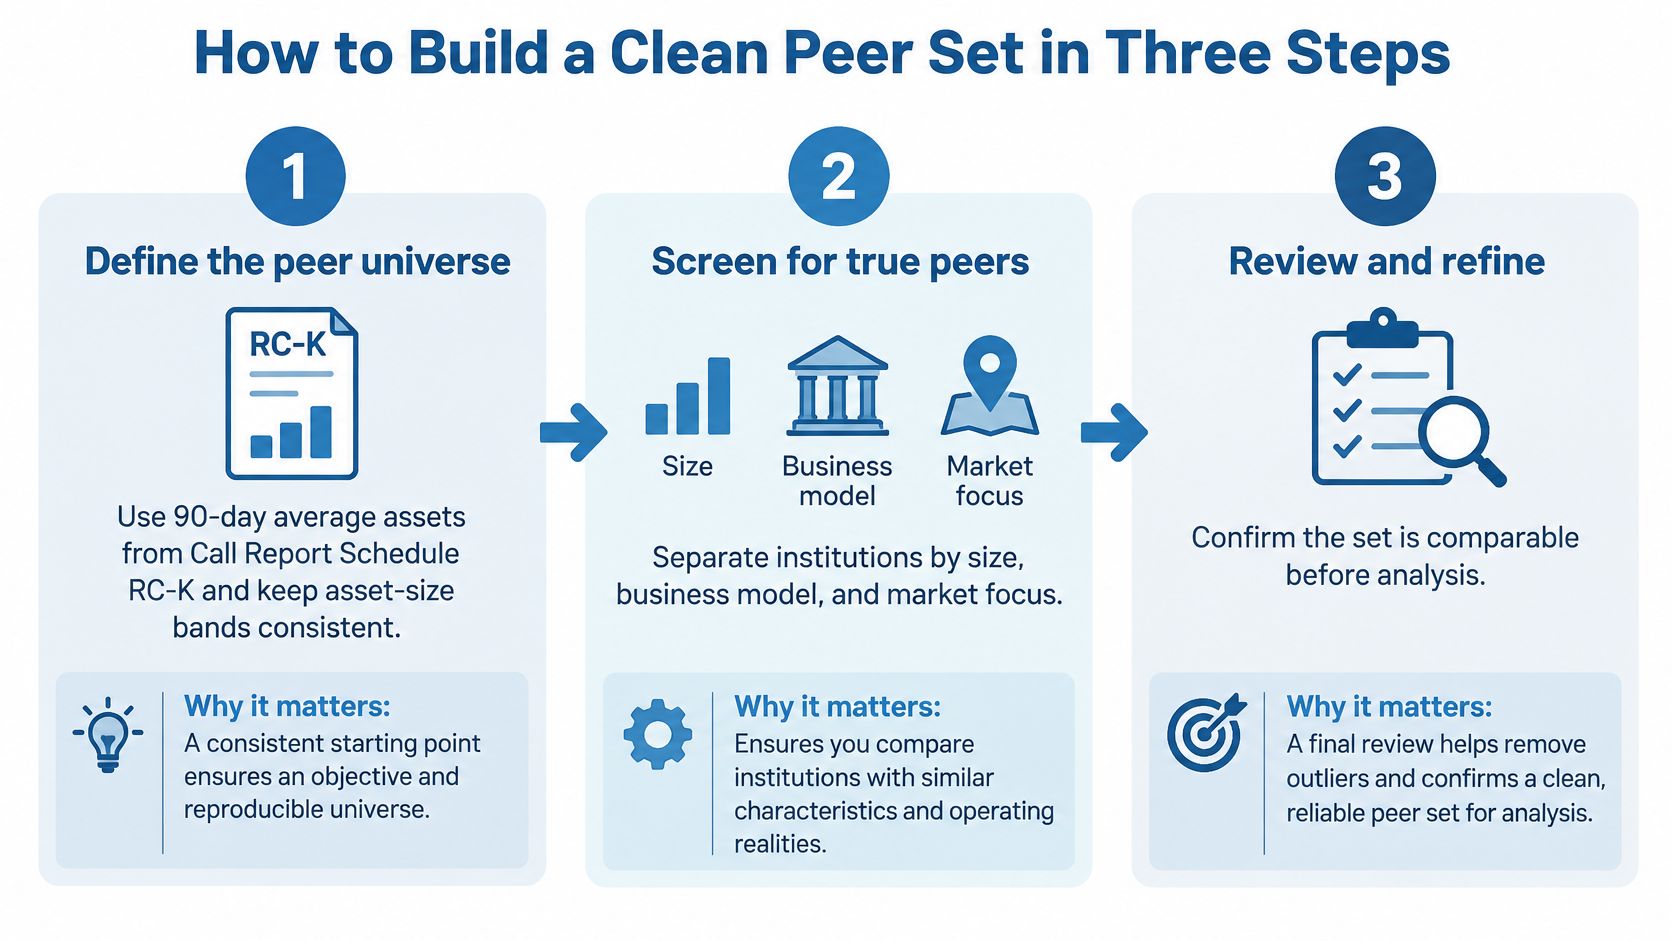
How to Build a Clean Peer Set in Three Steps
Comparable performance starts with a set you would defend in a credit committee, not a sort you ran because the export was handy.
The Uniform Bank Performance Report is built for this comparison, and its own suppression rules tell you when a figure is too thin to trust.
- Define the peer universe on 90-day average assets from Call Report Schedule RC-K. Asset size is the cleanest public cut, and the 90-day average dampens a single large inflow. Keep the bands consistent. A $900 million bank is never a peer of a $9 billion institution just because both file a Call Report. The usual slip is mixing size categories because a wider band "looks more diversified."
- Compare each ratio with the matching FFIEC/UBPR peer group, and read the trimmed average as a range. UBPR peer averages drop observations above the 95th percentile and below the 5th, so the figure is sturdier than a simple mean. Treat 58% to 66% as the band where peers sit, not as a target your bank must hit. The slip is managing to the average and calling every point of gap a failure.
- Confirm the gap across at least two reporting periods before you act. One quarter can be a securities gain, a branch sale, or a reporting quirk. Two periods in the same direction is a pattern. The slip is escalating the first print because a dashboard turned red.
Gates before any automated alert
The Uniform Bank Performance Report suppresses a peer-group figure when fewer than five valid observations exist. Treat that as the floor for any custom cut as well. Below it, a peer average is unpublished data wearing a published label: don't generate an alert and don't rank a sales priority off it.
Say a $1.8 billion bank posts an efficiency ratio of 74% against a trimmed peer range of 58% to 66% for two consecutive quarters. That is an outlier worth a conversation. The same 74% in a single quarter, or against a peer group of three banks, is noise.
Output rule: The team leaves with a ranked list of flagged banks, each row showing the gap's size and how many periods it has held. No magnitude, no persistence, no flag.
If the set still feels arbitrary, walk the same cuts in a peer analysis guide before you lock the universe. Rank on persistence first, then on how far the ratio sits outside the trimmed band.
Remove Duplicate Prospects Before You Score Them
A raw commercial extract will tell you a regional operator with 14 branches is 14 prospects. It isn't. It is one account, 14 locations, and one decision owner. Scoring the rows inflates the pipeline, splits credit for the same relationship, and sends two bankers to the same CFO.

The Bureau of Labor Statistics draws the line that sales teams blur. An establishment is an economic unit, usually one physical location. A firm can hold several establishments, and firm-level aggregation runs under common ownership using the employer tax-identification number. You want both layers, for different jobs.
What the pipeline does, in order
Deduplicate at the EIN or parent before you attach a contact or a financial signal. Keep establishment addresses for territory planning, because a lender still needs to know where the deposits and the collateral sit. On every record, store match confidence and where the identifier came from. Never treat a branch, a subsidiary, and the parent as separate buying entities.
Longitudinal matching shows how much of this is already solvable. Of establishments that continue from one quarter to the next, 95%–97% link on a stable state unemployment-insurance identifier. The rest need predecessor and successor checks, a probability match on name, address, and phone, and an analyst review. State agencies also recheck industry, location, and ownership on a three-year cycle, so a "confirmed" owner from four years ago is not current.
Three failures follow when teams skip that order.
- Double-counting multi-location firms turns one relationship into a fake book of business.
- Broken continuity after an ownership change or a new identifier drops the history you needed for the next call.
- Probabilistic matches treated as fact put the wrong parent on the account and the wrong person on the invite.
Score accounts, not rows. If two records share a parent, they share one score.
Before that score is calculated, tidy your outbound contact data so bounced emails and merged companies don't re-enter next Monday's list. The same discipline belongs in CRM data cleansing: one parent, many locations, a confidence flag on anything that wasn't an exact identifier match.
Identify Prospects That Are Actionable Now
List size is a weak proxy for pipeline quality. In recent research, 53% of surveyed banking managers and relationship managers named a shortage of high-quality leads as their biggest barrier, and the same respondents reported wasting time on outdated lists or on prospects already claimed by competitors, according to McKinsey. Data quality sits underneath both complaints, and adding volume fixes neither.
The useful cut is between a bank that matches your target-market screen and a bank you can explain this quarter. Four tests turn a profile into an action, and they work as gates: an account moves to outreach only when it clears three of the four. The threshold is deliberate. It demands a reason to call while tolerating one weak data point, and the failed test tells you exactly what to fix next.
Timing trigger. Something changed: a strategic initiative, a leadership change, geographic expansion, a product gap, or financial pressure that makes this quarter the reason to call. A stable, well-run bank with no trigger waits.
Named decision owner. You can point to the CFO, treasurer, or CEO who signs the relationship, and the name comes from a current filing or a public announcement, not a three-year-old contact record.
A business problem you solve. Deposit funding, treasury services, or a lending product you offer. "We should know them" is not a problem.
Whitespace. Public data and your CRM notes don't already show a competitor owning the relationship. If they do, the call is a displacement pitch, and you should label it that way.
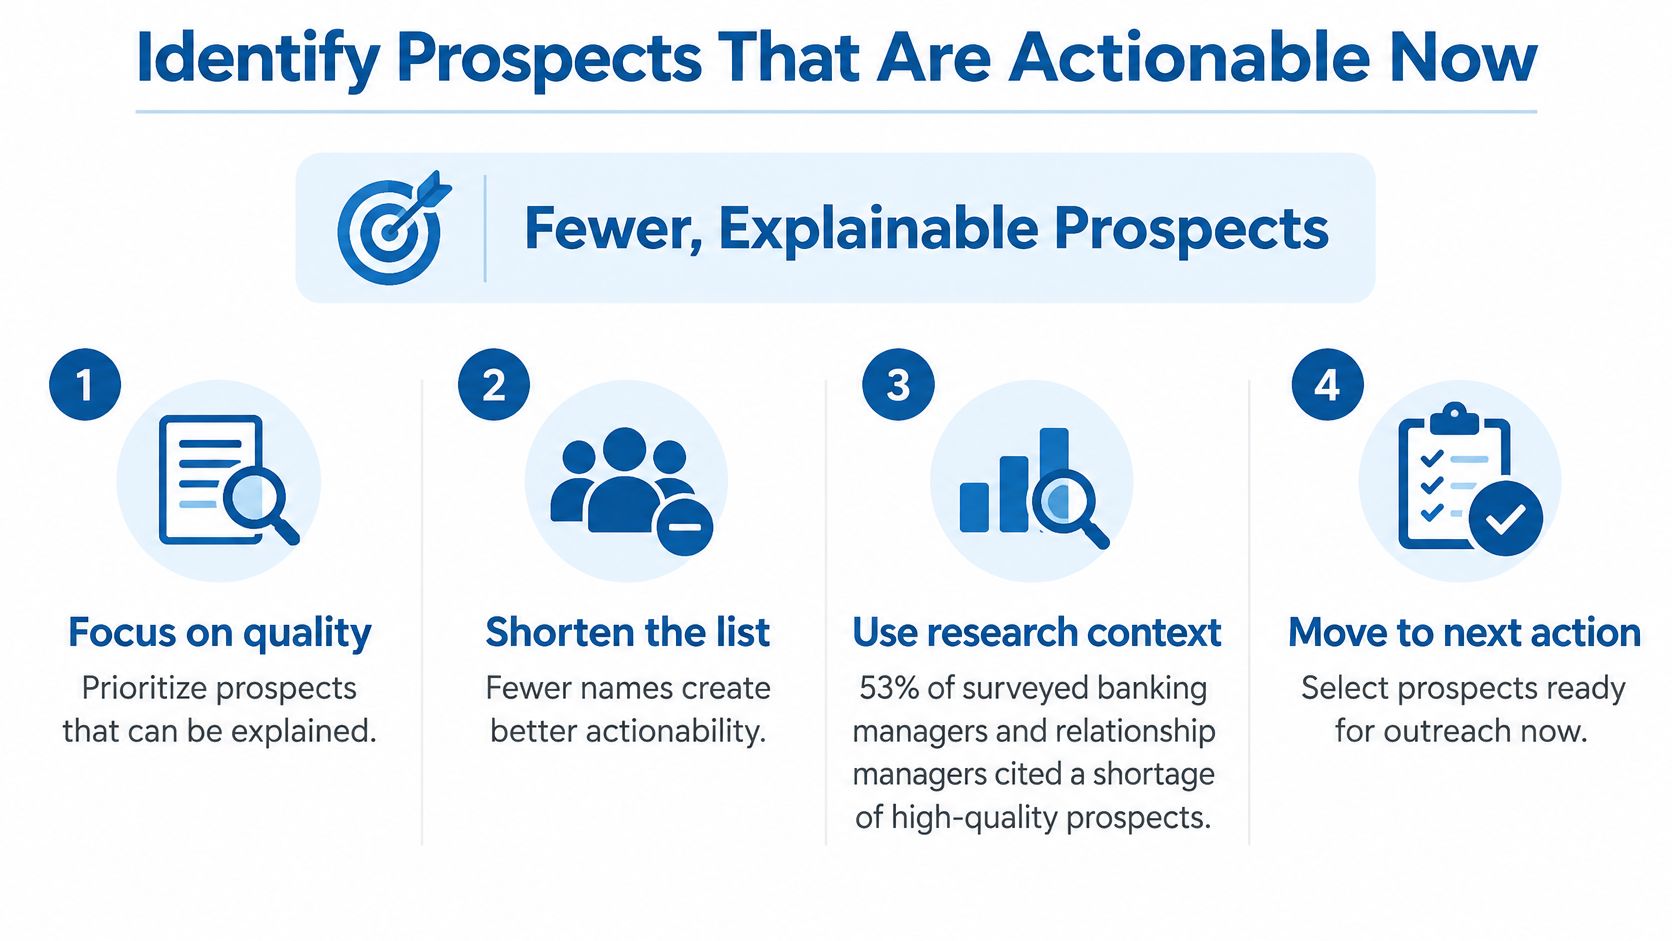
Say 40 banks match the asset, geography, and product screen. Six show a trigger, a named owner, and open whitespace. Those six are the quarter's call list. The other 34 stay in a watch file with the failed test written on the row, and that annotation doubles as the remediation queue: a stale owner name goes back to filing checks, a missing trigger waits for the next earnings cycle, and contested whitespace means the account was never open.
Fewer, evidenced accounts raise conversion because the banker opens with a reason, a person, and a problem. They also protect capacity. A relationship manager who spends the week on 34 lookalikes never reaches the six that could move.
Risk Signals and Performance Outliers Worth Escalating
Market conditions are measurable, so a board discussion shouldn't rest on an internal approval rate alone. The Federal Reserve estimated that U.S. commercial-bank lending standards were significantly tight at the end of the first quarter of 2025: the overall net lending standard was 30.0%, business-loan standards were 27.4%, and household-loan standards were 29.8%.
Read your own book against that anchor, not against last quarter's mood.
| Signal | Warning reading | Benchmark to check |
|---|---|---|
| Commercial lending standards | Tightened well beyond the industry reading | 27.4% business-loan standard, Q1 2025 |
| Approval volume | Down 15% while comparable banks are down 5% | Peer approval trend over the same period |
| Delinquency | Rising for two consecutive quarters while peers hold flat | Peer delinquency range from UBPR |
| Net charge-offs | Rising faster than the bank's own loan growth | Trimmed UBPR peer average |
| Net interest margin | Falling while funding costs rise | Trimmed UBPR peer range |
| Liquidity position | Declining while loan growth continues | Peer liquidity trend and funding mix |
Two ways a gap can be wrong
A commercial book that tightened well past the 27.4% business-loan reading may be protecting asset quality. It may also be handing qualified borrowers to competitors. The opposite miss is quieter. A bank that barely changed terms while peers tightened can be accumulating risk and calling it production discipline.
Take a $2 billion community bank that cuts approvals by 15% while comparable banks cut them by 5%. Executives should test three explanations before they praise or punish the policy. Weaker credit performance shows up in delinquency and charge-offs, not just in the approval count. Higher funding costs show up in the margin. If credit and funding don't explain the extra 10 percentage points of tightening, the policy itself is the variable, and the board should say so.
A signal goes to the board when it persists for two periods and moves against the benchmark in the same direction. One period is a note. Two periods, same way, is an agenda item.
Directors still need the pieces in one place: lending standards next to growth, delinquency, charge-offs, liquidity, and margin. Visbanking puts peer and historical signals into those comparisons so a deviation is something a banker can act on, not a chart someone exports and forgets. The same early-movement logic that sales teams use is laid out in H2's guide to buying signals, and the credit version of that discipline is predictive risk modeling: you escalate a pattern, not a single red cell.
Confirm Your First Pilot Before You Scale
Run one 30-day pilot on a single market or segment before you fund a wider rollout. Use the peer set from the three-step build and the four-part account test. Fix the success test before the first alert goes out, and don't renegotiate it in week three.
Pick one bar.
- At least three accounts move to outreach with a named decision owner.
- Or one peer-gap alert holds for two periods and the relationship manager confirms it is real.
Route alerts into email, Slack, or the CRM. If the banker has to open another dashboard, the pilot already failed.
In 2023, U.S. banks planned to spend more than $5 billion on data initiatives, according to Deloitte's 2024 Banking & Capital Markets Data and Analytics Survey. That spend is a reason to test identification on one segment, not a reason to skip the test. Waiting has its own cost: stale lists, and accounts a competitor has already claimed.
Benchmark your peer set against the trimmed UBPR ranges, or pull the prospect and risk rows for one market and see which accounts clear your three-of-four bar this quarter.
Visbanking's Bank Intelligence and Action System brings Call Report, UBPR, and related signals into peer comparisons, prospect lists, and risk alerts that a banker can explain. Use it to help to identify which institutions match your profile, which accounts are actionable now, and which gaps deserve a board conversation. Visit Visbanking to benchmark your peer set or explore the prospect and risk data for this quarter.
Latest Articles
Brian's Banking Blog
Bank Shares Performance: Metrics That Drive Returns
Brian's Banking Blog
API Security Testing Tools: 10 Options for Banks in 2026
Brian's Banking Blog
HMDA Data Reporting: How to File Without Costly Errors
Brian's Banking Blog
Talent Market Intelligence: A Guide for Bank Leaders
Brian's Banking Blog
Bank Loan Performance: Metrics, Formulas and Benchmarks
Brian's Banking Blog