The Texas Ratio: A Critical Stress Test for Bank Leadership
Brian's Banking Blog
The Texas Ratio is not just another financial metric; it is a critical early-warning system for a bank's credit health. It provides an unvarnished comparison of a bank's non-performing assets against the capital available to absorb potential losses. For bank executives and directors, understanding and monitoring this ratio is not an academic exercise—it is a fundamental component of strategic oversight and risk management.
Why the Texas Ratio Belongs in Your Boardroom

In the boardroom, your primary responsibility is to ensure the bank's long-term stability and guide its strategic direction. The Texas Ratio is one of the most effective tools for this purpose. It serves as a forward-looking indicator, flagging potential credit deterioration long before it impacts earnings. Historically, it has proven to be a reliable predictor of bank vulnerability in past financial crises.
Vigilant monitoring of this ratio separates proactive market leaders from reactive institutions. It empowers you to make more intelligent capital allocation decisions, navigate economic turbulence with confidence, and take decisive action on your loan portfolio. To ignore this ratio is a strategic oversight; to master it is to secure a competitive advantage.
From Historical Metric to Strategic Asset
Developed in the 1980s by Gerard Cassidy at RBC Capital Markets, the Texas Ratio was engineered to assess bank health during a severe economic downturn. By dividing non-performing assets by tangible common equity plus loan loss reserves, it created a direct measure of a bank's capacity to cover its troubled loans.
The ratio earned its name during the Texas banking crisis of that era, where it became clear that banks with a ratio exceeding 100% were on an accelerated path to failure.
Today, this metric is far from a historical artifact. Modern data intelligence has transformed it into a dynamic, real-time strategic asset. For any institution in general financial services, metrics like the Texas Ratio are foundational to a robust risk management framework.
A rising Texas Ratio is a direct signal of deteriorating credit quality that demands immediate board-level attention. This is the point where data intelligence drives strategic action.
Effective oversight requires the right tools. Platforms like Visbanking deliver the real-time, benchmarked data that leadership teams need for this critical analysis. It allows you to benchmark your institution’s performance against peers, turning this vital metric into an actionable component of your strategic planning.
Calculating the Banks Texas Ratio
For bank executives, the value in the Texas Ratio calculation is not in performing the arithmetic but in deeply understanding its components. This understanding is what allows you to interpret the resulting figure and lead substantive discussions about risk exposure and capital adequacy.
The formula is elegantly simple, cutting through complexity to provide a clear view of potential stress.
Texas Ratio = Nonperforming Assets / (Tangible Common Equity + Loan Loss Reserves)
At its core, this formula measures your most troubled assets against your primary capital buffers. It is a direct, unfiltered assessment of your bank’s resilience.
Breaking Down the Numerator: Nonperforming Assets
The numerator quantifies the immediate credit risk on your balance sheet. These are the assets that have ceased generating income and now pose a direct threat to your institution's financial health. As a leader, you must have a precise understanding of what this category contains.
It primarily includes:
- Loans 90+ Days Past Due: While still technically accruing interest, these loans carry a high probability of default.
- Nonaccrual Loans: Collection of contractually due principal and interest is in serious doubt, and the bank has ceased accruing interest income.
- Other Real Estate Owned (OREO): Real estate properties acquired through foreclosure. These are illiquid assets that often carry significant holding costs until they can be disposed of.
Aggregating these components provides a clear measure of the most immediate credit risk facing the bank.
This infographic illustrates how ratio analysis is the essential first step in a comprehensive risk management process.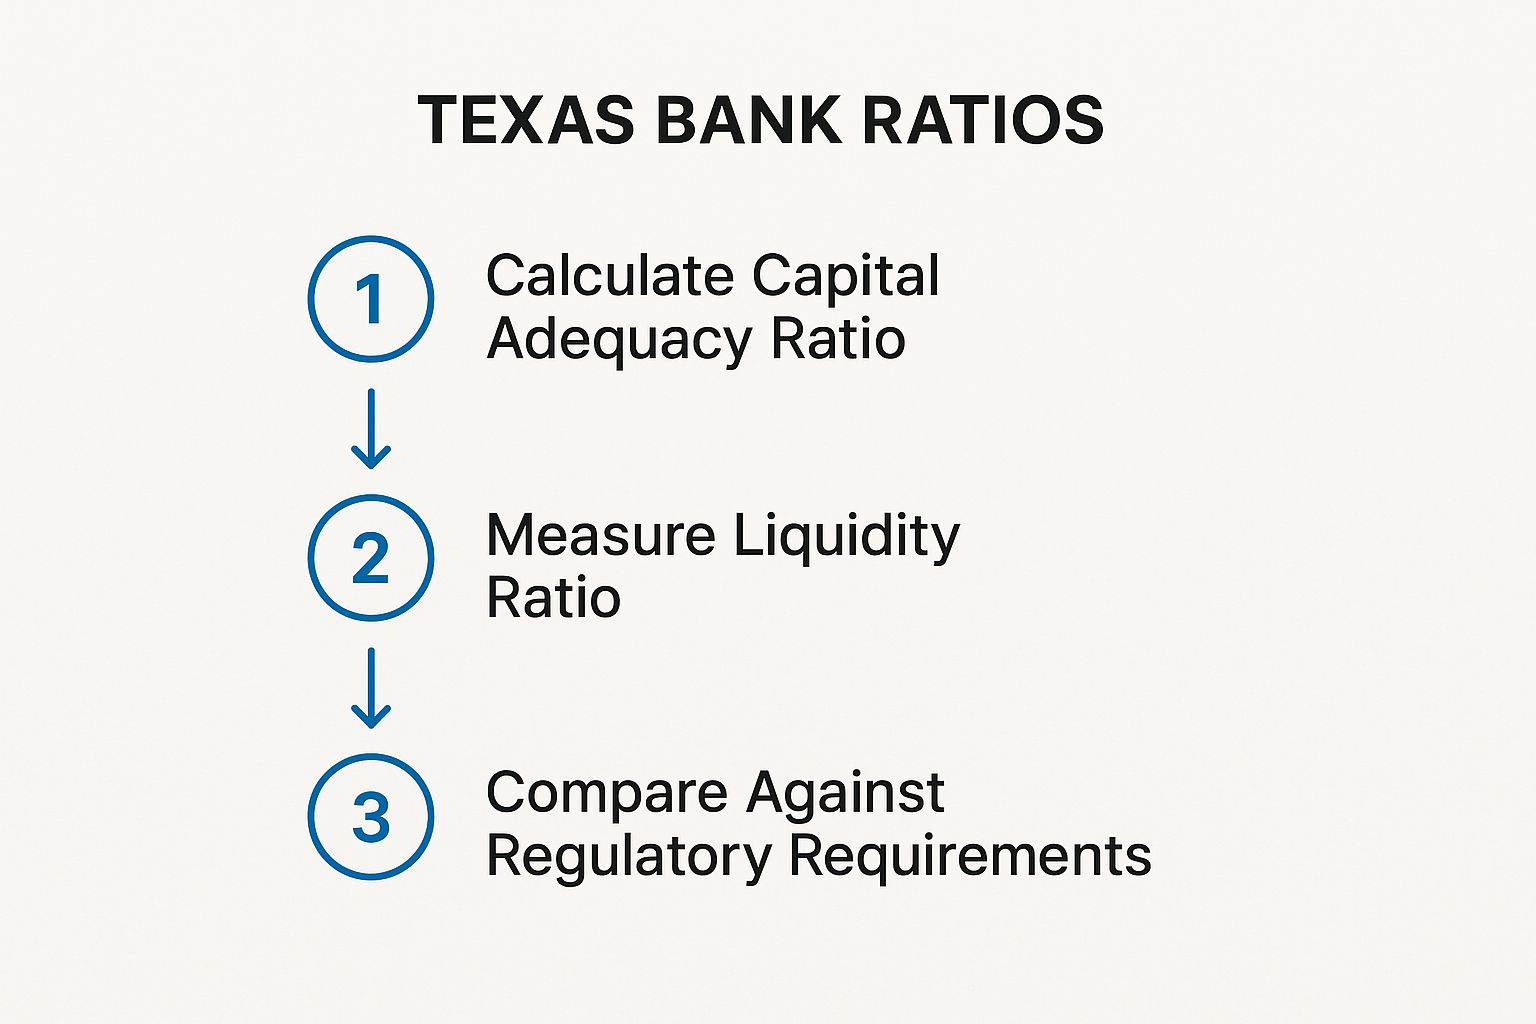
As shown, calculating core ratios is the foundational work. It is the necessary starting point for benchmarking against peers and preparing for regulatory review.
Examining the Denominator: Capital Buffers
The denominator represents your defense—the capital set aside to absorb losses from nonperforming assets. It is composed of two critical layers of protection.
- Tangible Common Equity (TCE): This is the purest form of a bank's capital, representing what remains after subtracting intangible assets like goodwill. TCE is the core capital available to cover losses without diluting shareholder value or triggering regulatory intervention.
- Loan Loss Reserves: This is a contra-asset account established to cover expected credit losses within the loan portfolio. It is a vital buffer, distinct from capital metrics designed to measure profitability. You can learn more about how to calculate Return on Assets to understand how different metrics fit into a holistic financial analysis.
Consider a practical example: A bank reports $25 million in nonperforming assets. Its balance sheet shows $45 million in Tangible Common Equity and $5 million in Loan Loss Reserves, for a total capital buffer of $50 million.
The calculation is straightforward: $25M / $50M = 50%. A Texas Ratio of 50% indicates that while risks are present, the bank maintains a solid capital base to manage them.
Data intelligence platforms like Visbanking automate this process by pulling data directly from call reports, freeing executive time to focus on strategic interpretation rather than manual calculation.
What Your Texas Ratio Is Actually Telling You
Calculating the Texas Ratio is simple. The work of leadership is interpreting what that number means for the bank. A single percentage is not just data; it is a direct signal of your institution's health and risk profile. It answers one critical question: How much of our core capital is exposed to troubled assets?
A low ratio indicates a strong position. A high or rising ratio is an alarm that demands immediate board-level attention. Understanding precisely where your bank stands is the first step toward preempting problems rather than merely reacting to them.
Decoding the Thresholds: A Strategic Framework
The Texas Ratio should be analyzed in tiers. Each level signals a different degree of risk and requires a distinct strategic response from leadership. A raw number is useless without understanding the narrative it represents.
This framework provides a practical guide for your next boardroom discussion:
- Below 50% (Healthy): The bank is in a strong position. The capital base is more than sufficient to cover nonperforming assets, indicating robust credit quality and a significant loss-absorption capacity. The strategic focus is on maintaining underwriting discipline and proactive portfolio monitoring.
- 50% to 75% (Elevated Concern): This is a cautionary signal. While not a crisis, it indicates that problem loans are beginning to erode the capital buffer. This warrants a rigorous review of loan concentrations, underwriting standards, and collection strategies.
- Above 75% (High Risk): The situation is now serious. A substantial portion of the bank's capital is exposed to potential losses from bad debt. This requires immediate and decisive action, such as exploring capital injections, aggressive disposition of troubled assets, and a comprehensive review of the risk management framework.
When tracked over time with a data intelligence platform like Visbanking, the Texas Ratio's trajectory provides an early warning of where your credit risk is headed long before it becomes a crisis.
Texas Ratio Interpretation Thresholds
For bank leaders, translating the Texas Ratio into a clear strategic directive is essential. This table provides a straightforward guide for understanding the implications at each risk level and formulating an appropriate response.
| Texas Ratio (%) | Risk Level | Strategic Implication for Leadership |
|---|---|---|
| Below 50% | Healthy | Focus on maintaining disciplined underwriting and proactive portfolio monitoring. |
| 50% to 75% | Elevated | Initiate a deeper review of loan concentrations, underwriting, and collection processes. |
| 75% to 100% | High Risk | Plan for decisive action, including aggressive asset disposition and potential capital raises. |
| Above 100% | Critical | Immediate regulatory engagement and crisis management are required; the bank's viability is at stake. |
Using these thresholds shifts the conversation from "what is the number?" to "what is our strategic response?" This proactive stance is the hallmark of effective bank management.
The Critical 100 Percent Mark
Crossing the 100% threshold is a definitive red line.
At this point, your nonperforming assets are equal to or greater than your entire capital buffer of tangible common equity and loan loss reserves. This implies that even if you liquidated this entire capital base, you might still be unable to cover the losses from your troubled loan portfolio.
Analysts generally view a ratio below 50% as healthy. Concern grows as it approaches 80%, but exceeding 100% signals imminent danger. You can discover more insights about these critical thresholds and their institutional implications.
A Texas Ratio over 100% suggests that, by this measure, the bank is insolvent. It is a critical alert for regulators and stakeholders, signaling that the institution's viability is in question.
This is precisely why continuous monitoring is non-negotiable. Observing an increase in your ratio is one thing. Observing that increase while your peers remain stable is a strategic threat that demands immediate investigation.
A Battle-Tested Predictor of Bank Failure
The Texas Ratio is not an obscure academic metric. It is a real-world tool forged during a banking crisis, with a formidable track record of identifying institutional distress long before regulatory intervention.
Its name derives from the widespread bank failures in Texas during the 1980s, which were driven by a collapse in the oil and real estate markets. The ratio proved to be a brutally simple yet effective early warning sign.
The pattern was unmistakable: banks with a Texas Ratio climbing past 100% were, with alarming accuracy, the institutions most likely to fail.
From Regional Crisis to Global Benchmark
The ratio's predictive power was validated again during the 2008 global financial crisis.
Across the globe, financial institutions on the brink of collapse exhibited Texas Ratios soaring past the 100% mark. It became a clear signal of the wave of failures and bailouts that followed, cementing its reputation as a primary indicator of systemic risk. You can find more insights on its global application that demonstrate its universal relevance.
In today's economic climate, the lessons from past crises are more critical than ever. The ratio is an indispensable part of a bank's financial risk management framework. For a broader perspective, consult this complete guide to risk management.
History has demonstrated that when a bank's bad loans begin to overwhelm its capacity to absorb losses, it is on a direct path to failure. The Texas Ratio captures this dynamic with stark clarity.
This is why a single data point is insufficient. A proper bank risk assessment must include trend analysis and peer benchmarking. Modern tools like Visbanking automate this data collection and analysis, enabling leadership to focus on strategic response rather than data compilation. Understanding your Texas Ratio in its full context is the first step toward building an institution that can withstand any economic storm.
Putting the Texas Ratio into Action
Knowing your bank's Texas Ratio is foundational. Acting upon that knowledge is what defines effective strategy.
For astute executives, this metric is an active management tool, not a passive reporting figure. Its power is fully realized when used for peer benchmarking, trend analysis, and preemptive adjustments to credit policy.
An isolated Texas Ratio is merely a snapshot. A ratio tracked over several quarters tells a story. When that story is benchmarked against a relevant peer group, your competitive position—and potential vulnerabilities—become immediately clear.
From Data Point to Strategic Directive
The objective is to move beyond "what's our ratio?" to "why is our ratio what it is, and how does that compare to our competitors?" This requires two critical exercises for any leadership team:
- Peer Benchmarking: How does your Texas Ratio compare to institutions of a similar size, business model, and geographic market? If your ratio is increasing while theirs remains stable, it signals a potential weakness in your underwriting or a dangerous portfolio concentration.
- Trend Analysis: Tracking your own ratio quarter-over-quarter reveals the trajectory of your credit quality. A steadily rising ratio is an unambiguous early warning of deteriorating asset health that demands investigation.
Through these practices, the Texas Ratio evolves from a lagging indicator of past performance into a proactive tool for shaping future stability.
Case Study: A Bank at a Crossroads
Consider a community bank with $1.5 billion in assets. At the start of the year, its Texas Ratio is a healthy 30%. Using a data intelligence platform like Visbanking, the leadership team monitors this metric quarterly. By the end of Q3, the ratio has climbed to 45%. While still in the "healthy" range, this increase warrants closer inspection.
The critical insight comes from peer analysis. The platform reveals that their custom peer group of regional competitors has maintained an average Texas Ratio of 28% over the same period. The discrepancy is the real story: their ratio jumped 15 points while their peers held steady. This is a strategic trigger.
The raw number (45%) suggests manageable risk. The contextual data (a 15-point increase while peers remain stable) signals a systemic issue unique to their institution that requires immediate board-level attention.
This insight prompts a deep dive into the loan portfolio. The leadership team quickly identifies the source: the rise in nonperforming assets is almost entirely concentrated in their commercial real estate (CRE) portfolio, specifically in loans for office properties.
Armed with this data, the board acts decisively. They immediately tighten underwriting standards for new CRE loans, increase monitoring of the existing office portfolio, and adjust their loan loss reserves to reflect the heightened risk. This is data-driven decision-making in practice. The Texas Ratio, when properly benchmarked and tracked, becomes a catalyst for action, allowing leadership to neutralize threats before they escalate.
Curious how your institution stacks up? See how your institution’s Texas Ratio compares by exploring our platform.
Transforming Data into a Competitive Advantage
The Texas Ratio is a powerful diagnostic tool, but its value is magnified when integrated into a broader analytical framework.
Modern bank leaders cannot afford to rely on single metrics. They must understand the drivers behind the numbers, how they compare against true peers, and their likely trajectory. A static number shows where you have been; a dynamic, benchmarked ratio informs where you need to go.
This is where advanced data platforms provide a decisive edge. By automating data collection and analysis from call reports, these tools eliminate manual work and deliver real-time insights. This allows leadership to shift focus from data compilation to high-level strategy, turning raw data into clear directives for the board.
From Insight to Action
Consider the advantage of instantly seeing your bank's Texas Ratio plotted against a custom peer group. If your ratio is stable at a healthy 40%, while a key competitor’s has risen to 65%, this is more than a data point. It is actionable intelligence about market vulnerabilities and potential opportunities for your institution.
The objective is not merely to track numbers, but to cultivate a decision-making culture grounded in data. A clear understanding of the story behind the metrics enables precise and confident action.
This is the competitive advantage of turning deep data into decisive strategy. Platforms like Visbanking automate the complex analysis and provide the peer benchmarks necessary for superior oversight. Stop reacting to past performance. It’s time to benchmark your bank’s Texas Ratio against your real peers and transform your data into your most powerful strategic asset.
Answering Your Key Questions
What's a Good Texas Ratio for a Bank?
A Texas Ratio below 50% is considered healthy, indicating that a bank has a strong capital cushion to absorb potential losses from nonperforming assets. As the ratio approaches 75%, it signals a need for heightened board scrutiny of credit policies. A ratio nearing or exceeding 100% is a critical warning that demands immediate and strategic action to shore up capital or reduce troubled assets.
Does a High Texas Ratio Guarantee a Bank Will Fail?
Not necessarily, but it is one of the most reliable predictors of severe financial distress. A Texas Ratio over 100% signifies that a bank's core capital is fully encumbered by its problem assets, leaving it extremely vulnerable. However, decisive leadership can avert failure through measures like raising new capital, aggressively disposing of bad assets, or executing a strategic merger. The ratio should be viewed as a critical diagnostic tool that compels immediate action.
How Often Should Our Board Be Looking at the Bank's Texas Ratio?
At a minimum, the board should review the Texas Ratio quarterly, in conjunction with call report filings. In a volatile economic environment or if the bank has significant exposure to higher-risk sectors, a monthly review provides a more granular, real-time view of credit quality trends. The key is not just frequency, but depth: the review must include trend analysis over time and benchmarking against a relevant peer group to provide meaningful strategic context.
Does the Texas Ratio Work for All Types of Banks?
Yes. The Texas Ratio is a universally applicable metric because its core principle—comparing troubled assets to loss-absorbing capital—is fundamental to the business of any depository institution, from small community banks to large national players. However, context is critical. A bank with heavy concentration in a high-risk sector may warrant closer examination even with a moderate ratio. This is where customized peer analysis becomes essential for drawing accurate conclusions relevant to your specific business model.
At Visbanking, we transform this critical metric from a static number into a dynamic, strategic tool. Our platform automates the calculations and provides the instant peer benchmarking you need to see not just where your institution stands, but where it is headed.
Discover how our Bank Intelligence and Action System can sharpen your board’s oversight and deliver a tangible competitive advantage. See Visbanking in action today.
Latest Articles

Brian's Banking Blog
Social Network Analysis for Banking: A Practical Guide

Brian's Banking Blog
How to Increase ROE: A Data-Driven Playbook for Bank Leaders

Brian's Banking Blog
What Is SEC EDGAR and How Banks Use the Data

Brian's Banking Blog
What Is Value at Risk and Why Bank Leaders Rely on It

Brian's Banking Blog
How to Build a Leadership Pipeline for Banks

Brian's Banking Blog