
What Is Performance Reporting in Banking
Brian's Banking Blog
Performance reporting is the structured process of collecting, analyzing, and presenting bank results against goals, with the variance between actual and target serving as the most diagnostic field for corrective action. In a bank, that means connecting profitability, risk, capital, growth, and relationship data to decisions rather than merely displaying them.
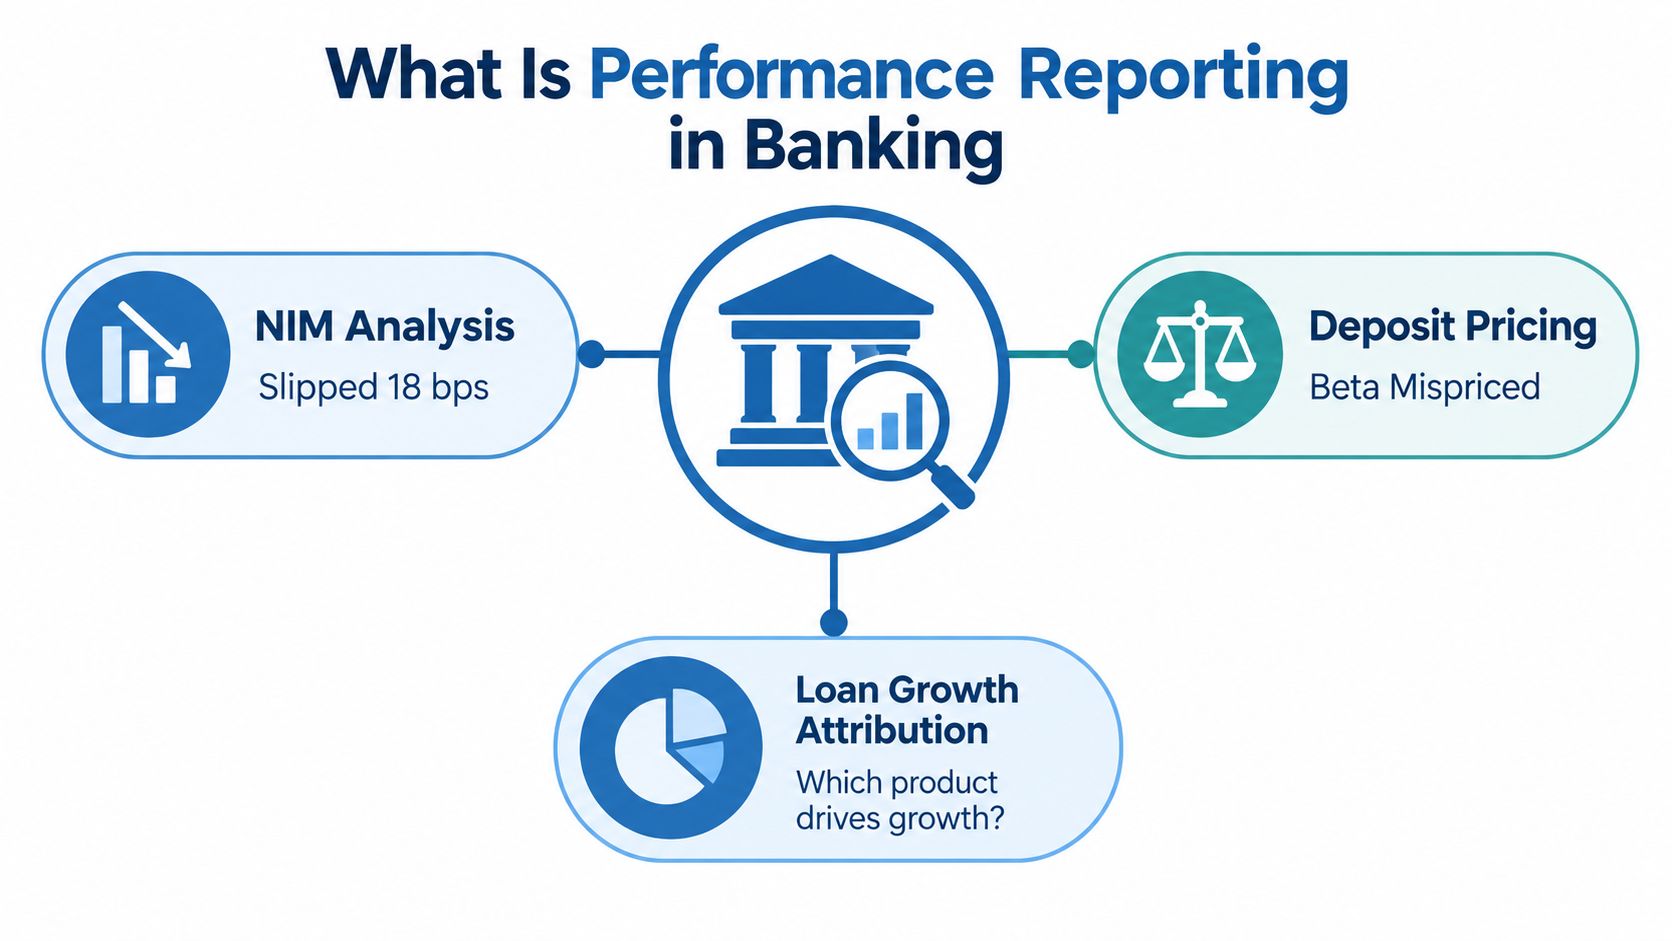
A quarterly review can expose the problem quickly. Net interest margin has slipped 18 basis points, deposit pricing appears misaligned, and the commercial team still can't explain which loan growth is profitable. Finance has one version of the numbers, risk has another, and relationship managers are working from pipeline data that doesn't connect cleanly to either.
That is the practical test for performance reporting. It must show what happened, why the result differs from plan or peer performance, who owns the response, and what action should follow.
What Is Performance Reporting in Banking
A performance report compares budgeted or targeted amounts with actual results for a defined period and responsibility center. The resulting variance flags favorable or unfavorable deviations that require investigation or corrective action. This foundation comes from managerial accounting and cost-control practices, where the report was designed to help managers respond to operating differences rather than archive them. The cost-accounting explanation of performance reports describes this relationship between budget, actual performance, responsibility, and variance.
For a bank executive, the distinction between a metric and a KPI matters. Interest-earning assets, branch counts, account openings, and pipeline volume are measured values. Net interest margin, cost-to-income, return on average assets, and deposit growth per relationship manager are decision-grade KPIs because they connect more directly to strategic objectives.
The variance is the operating signal
A dashboard that shows NIM without target, peer context, or trend leaves the CFO with a description, not a decision. A useful report shows actual NIM, target NIM, the variance, the direction of movement, and the portfolios or pricing decisions contributing to the gap.
The same logic applies to growth. Loan balances may be rising, but that growth can consume capital, carry weak pricing, or fail to deepen deposits. A relationship manager's loan production should therefore be viewed alongside deposit attachment, pricing exceptions, expected return, covenant quality, and relationship coverage.
Banking makes reporting harder than it looks. The institution must reconcile regulatory filings, core systems, finance data, credit records, sales activity, market information, and external benchmarks. It also serves two stakeholder groups with different requirements: directors need strategic clarity, while examiners need traceable definitions and reliable source data.
Practical rule: A report is finished only when a named owner can see the variance, understand its cause, and take an approved next step.
Long feedback loops add another complication. Origination, repricing, deposit capture, credit deterioration, and payoff may occur on different timelines. Performance reporting has to preserve that history, otherwise leaders confuse a delayed outcome with a current operating failure.
How Performance Reporting Evolved Into a Decision Discipline
A bank can report rising loan balances while missing the warning signs underneath: weaker pricing, higher capital usage, or limited deposit attachment. That problem explains why performance reporting evolved from historical variance review into a decision discipline. Managers needed reports that connected results with causes, owners, and next actions.
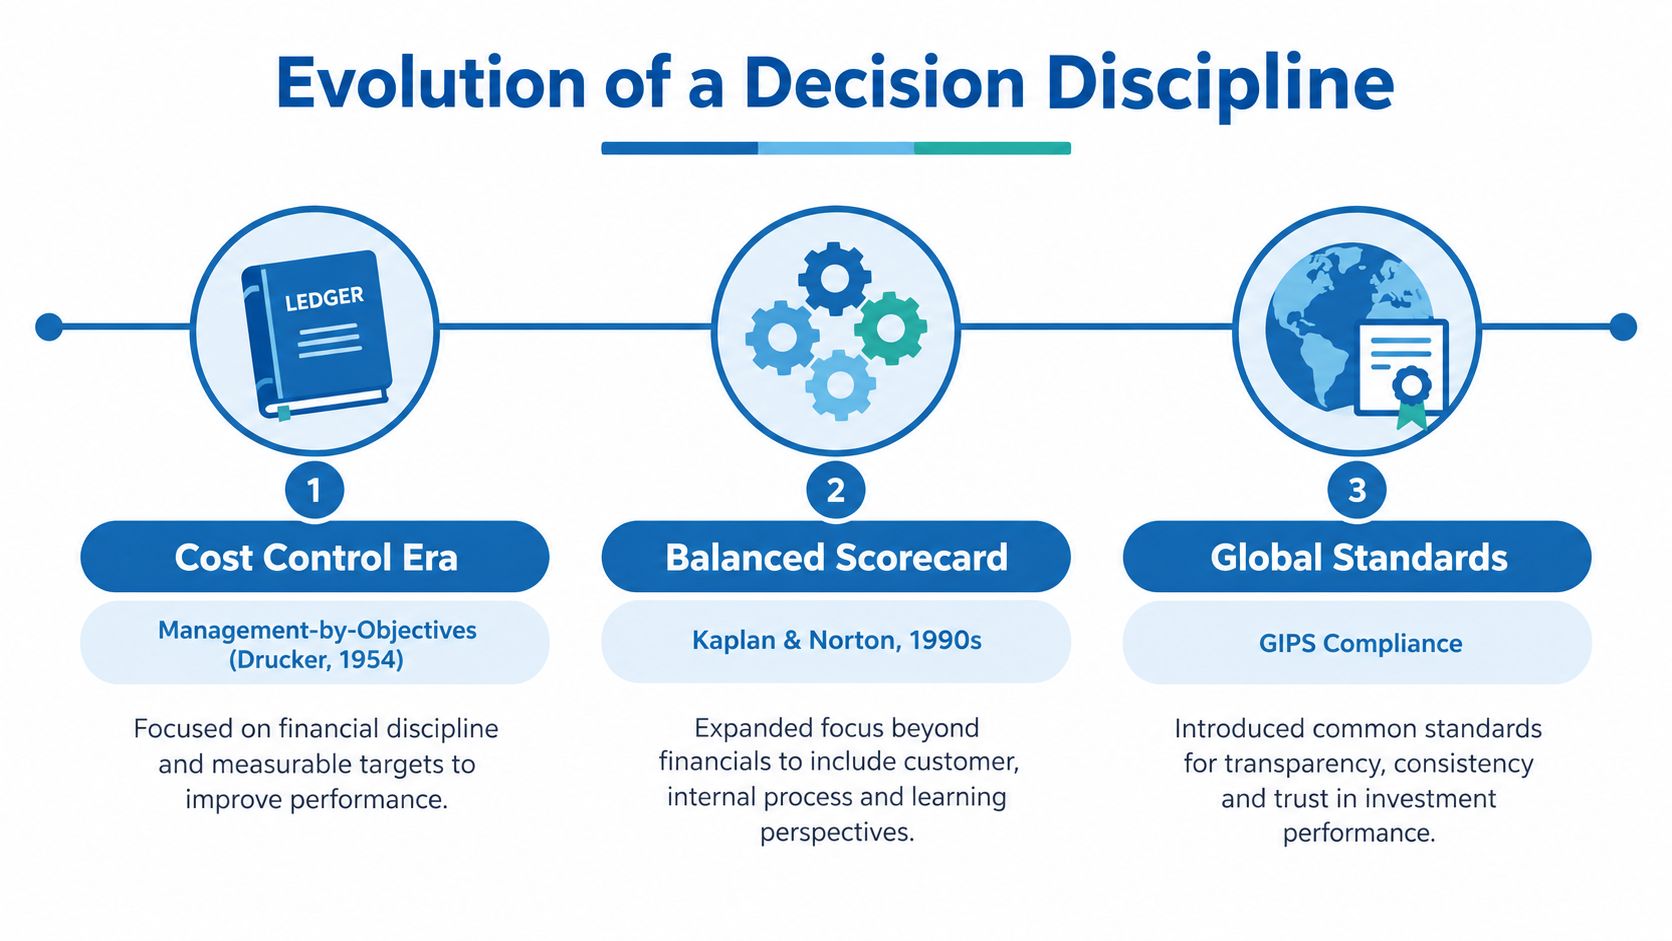
Early cost-control practices focused on comparing planned and actual results, identifying deviations, and assigning responsibility. Management frameworks later extended that logic beyond expenses. Peter Drucker's 1954 management-by-objectives framework linked performance discussions to measurable targets. Kaplan and Norton's Balanced Scorecard, introduced in 1992, organized performance across financial, customer, internal-process, and learning-and-growth perspectives. Reporting could therefore combine leading indicators with lagging financial outcomes. The documented evolution from variance reporting to management frameworks provides context for that shift.
Standardization improved comparability
Investment management added formal rules for comparable results. The CFA Institute's earlier AIMR Performance Presentation Standards began in 1987, and the first Global Investment Performance Standards were published in April 1999. GIPS defined common methods for calculating and presenting investment returns, allowing clients and institutions to compare managers across firms and markets. The history of performance reporting and GIPS describes that move from firm-specific summaries toward global standards.
Banks developed a different discipline through regulatory reporting. Call Reports and related examination materials impose structure on measures of financial condition, capital, and asset quality. That control supports regulatory review, but reports built mainly for compliance can arrive too late to guide pricing, liquidity, or relationship decisions.
A modern reporting system must connect both purposes. A board may need peer profitability and capital context. ALCO may need pricing and liquidity signals. A relationship manager may need a ranked account or prospect list. The decision discipline appears when UBPR, Call Report, HMDA, UCC, core-system data, and external market signals use consistent definitions and feed the same workflow. Reporting then becomes a trigger for coordinated growth or risk action, rather than a record of what already happened.
Core KPIs and the Data Sources That Power Them
A bank's KPI architecture should begin with the decision it must support. Profitability, asset quality, and capital decisions usually depend on regulatory reporting and peer comparisons. Growth and relationship decisions require core-system records, CRM activity, market data, and specialized external feeds. The practical test is simple: can a metric trigger a pricing change, a credit review, a prospecting action, or a resource decision?
The FFIEC Uniform Bank Performance Report is produced for each FDIC-insured commercial and savings bank, updated quarterly, and built from quarterly Call Report data. It presents ratios, percentages, dollar amounts, peer-group averages, and percentile rankings for most ratios. The FFIEC technical information for UBPR explains how the report is constructed and how its comparative format should be read.
| KPI Category | Key Metrics | Primary Data Source | Cadence |
|---|---|---|---|
| Profitability | Return on average assets, return on average equity, net interest margin, efficiency ratio | Call Report and UBPR | Monthly management view, quarterly peer view |
| Asset quality | Noncurrent loans to loans, net charge-offs to loans, allowance coverage | Call Report and UBPR | Monthly risk view, quarterly peer view |
| Capital | Tier 1 Leverage Ratio, Tier 1 risk-based capital ratio, total risk-based capital ratio | Call Report and regulatory capital reports | Monthly or quarterly |
| Growth | Loan growth, deposit growth, balances by segment | Core systems and deposit data | Daily or weekly operating view |
| Relationship value | Deposit attachment, products per relationship, revenue per RM | CRM, core, treasury, and finance systems | Weekly or monthly |
| Market opportunity | Mortgage share by census tract, collateral lien position, local market activity | HMDA, UCC, and external market sources | Periodic refresh with event-driven review |
The UBPR provides named dimensions that executives can connect to action. Profitability includes return on average assets, return on average equity, net interest margin, and efficiency ratio. Asset quality includes noncurrent loans to loans, net charge-offs to loans, and allowance coverage. Capital includes the Tier 1 Leverage Ratio, Tier 1 risk-based capital ratio, and total risk-based capital ratio. The UBPR metric reference maps these measures to practical bank analysis.
Source lineage matters more than visual polish
A metric can change when its definition, measurement date, or source system changes. Deposit growth in the core may differ from a regulatory presentation after classification or consolidation adjustments. Loan-growth reports may also handle acquired balances differently from peer comparisons.
Each KPI therefore needs an owner, definition, source, refresh rule, and reconciliation path. Regulatory KPIs protect capital and examination readiness, while growth KPIs help relationship managers identify where action can produce revenue. A unified bank intelligence layer connects those views to account, prospect, and market workflows.
Executives responsible for revenue accountability can use strategies for aligning sales metrics with business goals to connect activity measures with outcomes. For banks designing the operating model, bank performance measurement system guidance provides a reference for linking KPI definitions, reporting workflows, and operational measurement.
Reporting Formats, Cadences and Stakeholder Views
The same underlying data shouldn't be presented identically to a regulator, director, CFO, ALCO committee, or relationship manager. Each audience needs a different level of compression and a different decision window.
Regulatory views prioritize completeness, consistency, and examination support. The FDIC notes that public regulatory report information helps investors, depositors, and creditors assess a bank's financial condition. Its examination guidance also identifies the UBPR, Call Report, financial statements, subsidiary ledgers, and analytical reports as inputs to earnings assessment. The FDIC examination policy on earnings assessment shows why regulatory lineage cannot be treated as a separate back-office concern.
| Format | Cadence | Primary Audience | Decision Window |
|---|---|---|---|
| Regulator view | Quarterly and filing-driven | Regulators, finance, risk | Examination and formal reporting cycle |
| Board pack | Monthly or quarterly | Directors and executive leadership | Strategic allocation and oversight |
| ALCO memo | Monthly, with faster exception updates | Treasury, CFO, risk committee | Pricing, liquidity, and balance-sheet decisions |
| Executive dashboard | Monthly with on-demand drill-down | CFO, CEO, business-line leaders | Operating correction and resource allocation |
| RM dashboard | Weekly, with daily refresh for exceptions | Relationship managers and sales leaders | Pipeline, retention, pricing, and coverage |
| Credit and treasury feed | Intraday or event-driven | Credit, treasury, operations | Immediate exposure and liquidity response |
Cadence should match the cost of delay
Quarterly UBPR data is appropriate for peer positioning and historical comparison. It isn't sufficient for a relationship manager deciding whether to reprice a live deal or investigate a deposit attrition signal.
A board pack should compress the story into a few material variances, trend direction, peer position, and management response. An RM dashboard should expose account-level exceptions, upcoming renewals, missing deposits, and profitable expansion opportunities. A treasury view may require more frequent updates because liquidity and funding conditions can change before the monthly close.
A single source of truth doesn't mean a single screen. It means every screen can explain where its numbers came from.
The hand-off between functions is usually where reporting fails. Finance owns the close, risk owns asset-quality interpretation, treasury owns funding, and sales owns relationship activity. If each team calculates the same measure independently, the bank spends meeting time debating definitions instead of deciding what to do. A shared feed with role-specific views preserves control without forcing every audience into the same format.
For the executive layer, Visbanking's executive dashboards provide a relevant model for presenting bank performance through annotated charts, benchmark comparisons, and export-ready reporting.
Performance Reporting in Practice for Banks and Relationship Managers
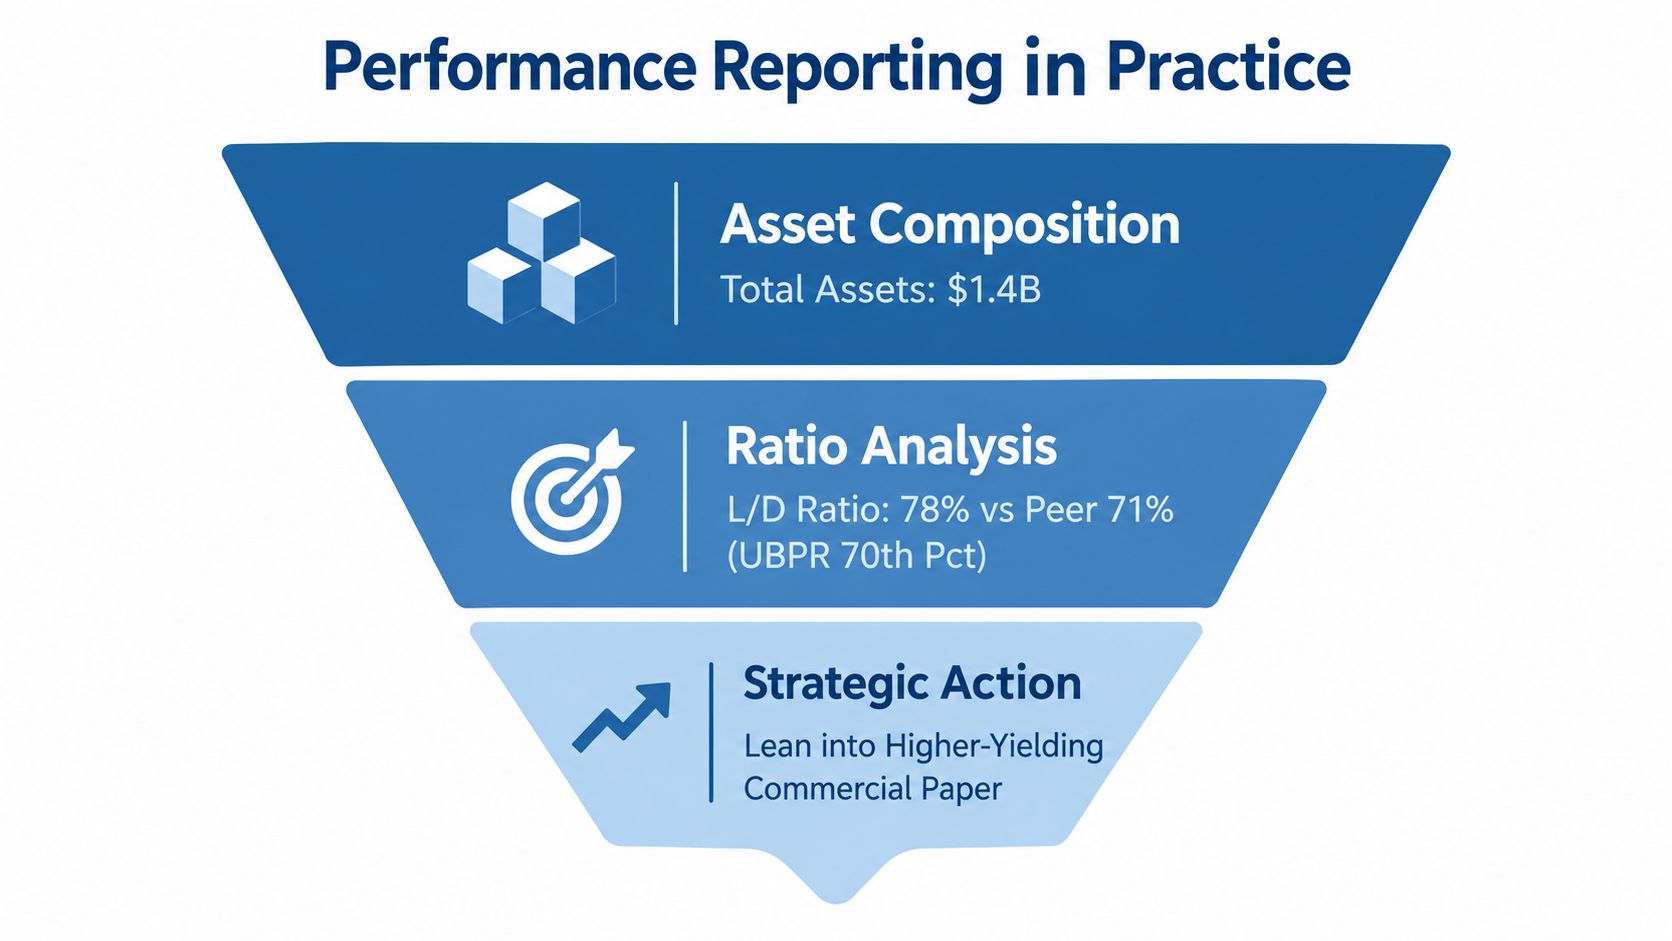
Consider a hypothetical $1.4B community bank with a loan-to-deposit ratio of 78%, compared with a peer UBPR 70th percentile of 71%. The variance isn't automatically a problem. It tells management that the bank is carrying more loans relative to deposits than the selected peer position, which may increase pressure on funding costs and NIM.
The executive conversation should connect three KPIs: LTD ratio, peer percentile rank, and NIM. If NIM is under pressure, management may choose to emphasize higher-yielding commercial paper or rebalance asset composition instead of chasing wholesale funding that the peer set avoids. The report doesn't make that decision by itself. It makes the trade-off visible and gives ALCO a defensible basis for a portfolio reweight.
The RM view turns variance into coaching
Now take a commercial pipeline review. Deposit-attached loans are running at 42% against a 55% target. Three active deals are short on covenant pricing. The appropriate response isn't to celebrate loan volume and ask the RM to produce more of it. The manager should require a pricing review, attach treasury or operating-account requirements where appropriate, and walk away from deals that don't meet the bank's return and risk standards.
The KPI triplet here is deposit-attachment rate, ROAA, and loan pricing quality. A coaching note might say that the RM's pipeline is productive but isn't converting enough operating deposits. A pricing exception might require senior approval. A portfolio action might shift capacity toward relationships with stronger deposit potential.
A one-page RM scorecard should pair each account with its current balances, deposit attachment, pricing exceptions, renewal date, peer or segment benchmark, and next action. This makes performance reporting usable in a call-planning meeting, not just in a quarterly review.
Banks also need to preserve documentation and consistency when reporting spans commercial, consumer, and sustainability-related workflows. Teams navigating meeting UK SRS requirements can apply the same principle: define the data, retain the evidence, and connect the reported result to an accountable action.
Best Practices, Common Pitfalls and the Implementation Checklist
The most reliable implementation plans start with failure modes. A bank doesn't need another dashboard if its source definitions remain disputed, its regulatory feed arrives late, or its CRM and core data don't reconcile.
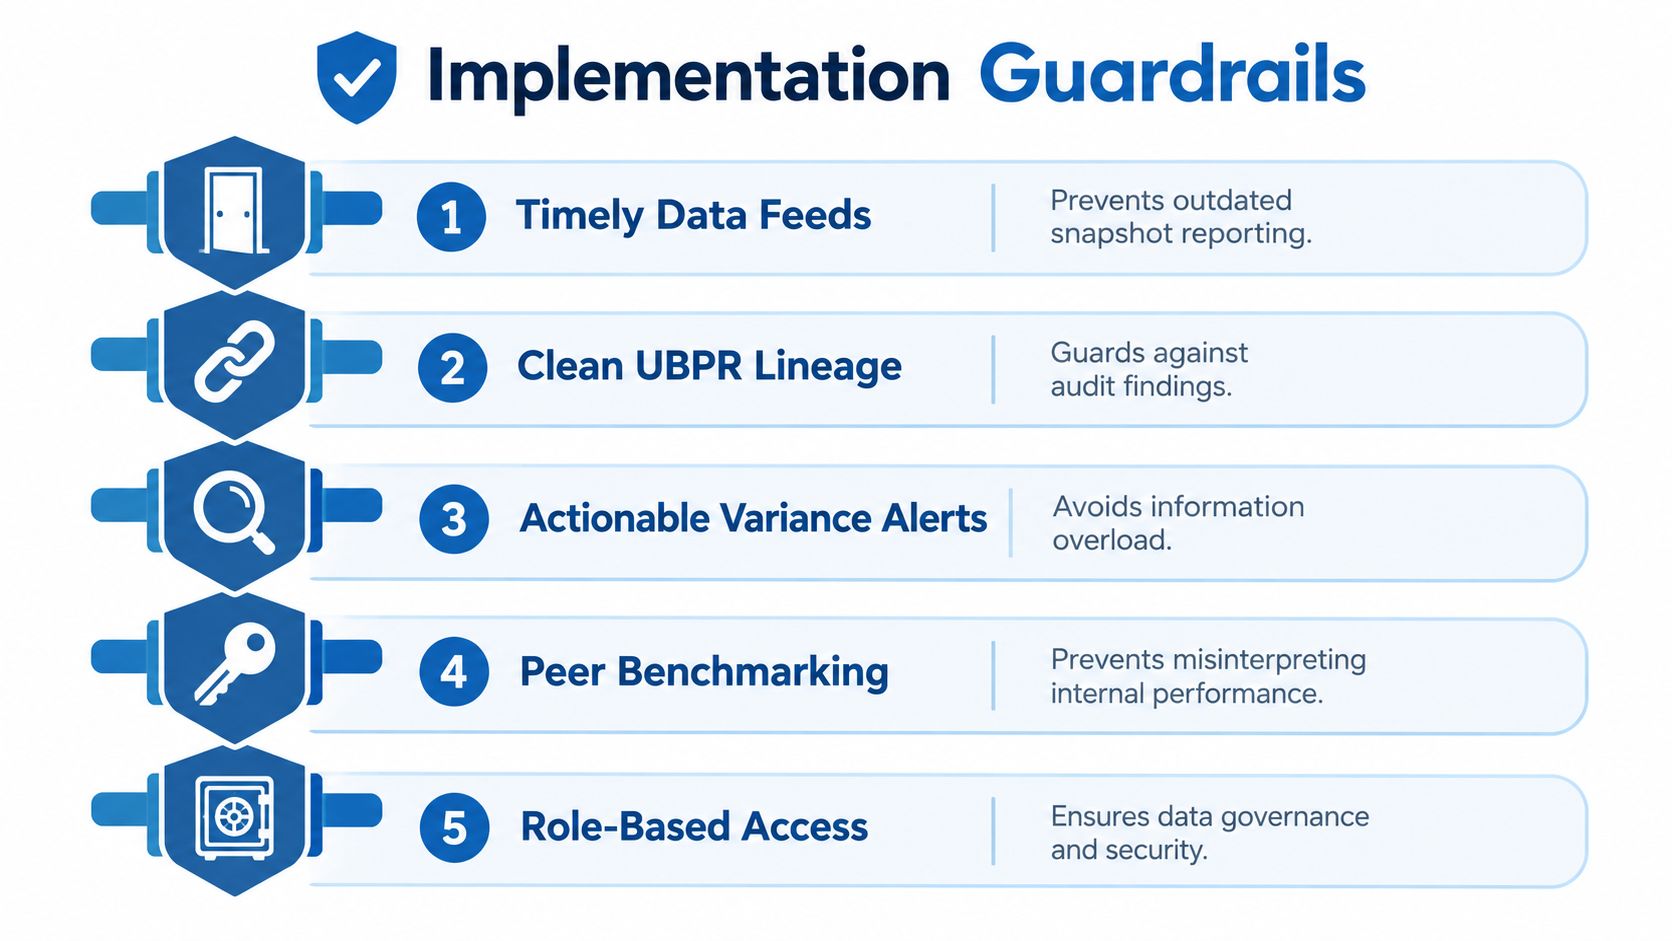
Guardrails that protect decision quality
Freeze the source-of-truth map: Document which system owns each field before building visuals. This protects UBPR lineage and prevents executives from comparing numbers that use different definitions.
Separate calculation pipelines: Keep regulatory KPIs and internal growth measures in distinct calculation paths, then reconcile them deliberately. This protects reproducibility when management metrics use different timing or classification rules.
Automate the CRM-to-core handoff: Manual spreadsheet joins commonly lose deposit-attachment, relationship-coverage, or opportunity-stage data. A scheduled synchronization protects the measures used to coach RMs and evaluate growth quality.
Assign regulatory data stewards: HMDA fields, UCC records, and other regulatory or market feeds need named owners, refresh rules, and exception handling. This protects fair-lending and collateral analysis from stale or incomplete inputs.
Use thresholded alerts: A report should distinguish normal movement from a material exception. Thresholds protect executive attention by directing review toward the variances most likely to change a decision.
Governance must survive the dashboard launch
Automated refresh doesn't remove accountability. Finance should own monthly variance review, risk should validate asset-quality and capital definitions, treasury should review balance-sheet signals, and sales leadership should own relationship-level action.
A practical governance cycle includes a monthly variance review, a quarterly peer benchmark refresh, and an annual policy re-sign-off. Each review should record changed definitions, threshold adjustments, unresolved data exceptions, and assigned actions.
Control principle: Every important KPI needs a definition, a source, a refresh schedule, a threshold, and an owner.
The common mistake is to measure adoption by the number of reports published. A bank has improved performance reporting only when managers spend less time reconciling data and more time correcting pricing, funding, credit, or coverage decisions.
From Dashboards to Action With a Bank Intelligence Layer
A unified bank intelligence layer connects regulatory, financial, market, and relationship data so leaders can move from observation to intervention. The relevant inputs may include UBPR, Call Report, HMDA, UCC, branch, and external market signals. The value comes from the connection, not from adding another display surface.
Three compression points matter.
First, automated pipelines can ingest regulatory filings and reconcile them against internal core systems. That reduces dependence on manual roll-ups and gives finance and sales a shared operating picture. Second, governance and lineage can log metric definitions, source refreshes, reconciliation results, and threshold changes so the report remains explainable to management and examiners. Third, action triggers can route exceptions to the people who can respond.
A trigger might flag NIM compression beyond 25 basis points versus a peer UBPR percentile, or identify deposit attrition risk where relationship coverage is weak. The point isn't the alert itself. The point is that the alert should open a pricing review, retention call, portfolio analysis, or management escalation.
Visbanking provides one worked example of this model. Its bank intelligence and action platform brings together bank performance and external intelligence for peer benchmarking, trend analysis, prospect and relationship workflows, and alert-driven action. That approach differs from a do-it-yourself BI stack when the bank needs prebuilt banking definitions, peer context, lineage, and CRM-connected workflows rather than a blank reporting canvas.
For executives evaluating the broader discipline, business intelligence and analytics is useful only when it connects measurement to accountable decisions. A dashboard can show a variance. A decision system assigns the owner, threshold, explanation, and next best action.
The strategic payoff is a shift from backward-looking compliance artifact to forward-looking operating system. Reporting becomes useful when a CFO can defend balance-sheet choices, a director can test management's response, and an RM can see which relationship action has the strongest economic rationale.
Visbanking helps banks and credit unions unify regulatory, financial, market, and relationship data into benchmarked, explainable performance views with workflow-ready alerts. Visit Visbanking to benchmark your institution, connect performance reporting to RM action, and explore a bank intelligence layer built for faster decisions.
Latest Articles

Brian's Banking Blog
ISO 20022 Migration Strategy for Bank Leaders

Brian's Banking Blog
Lead Tracking Software for Banks: An Executive Guide

Brian's Banking Blog
What Are Key Metrics for Banks? a Decision Guide

Brian's Banking Blog
Customer Feedback Surveys: A Playbook for Banks

Brian's Banking Blog
How to Create a Dashboard That Banks Actually Use

Brian's Banking Blog