
What Is Peer Analysis in Banking? a Strategic Guide
Brian's Banking Blog
Peer analysis is a controlled benchmarking method that compares a bank's performance with a carefully selected group of similar peers, often using metrics such as ROA, efficiency ratio, net interest margin, and asset quality. Banks commonly build peer groups of about 8 to 15 institutions, although the value comes from the quality of the comparison, not the size of the list.
The counterintuitive point is that a bank can rank well against a broad industry average and still be losing ground against the institutions that compete for the same borrowers, deposits, talent, and markets. Executives who treat peer analysis as a static ranking exercise often receive an accurate description of the past but little guidance about the next decision.
Why Most Banks Benchmark Incorrectly
Most banks benchmark incorrectly because they compare themselves with an industry average instead of a true strategic peer group. That shortcut looks efficient, but it can distort the question executives are trying to answer. A community bank with a commercial real estate focus, for example, shouldn't interpret its margin or credit performance against every bank in the market. Its relevant comparison is a group with a similar balance-sheet structure, customer base, geography, and operating model.
Peer analysis isn't a simple average-versus-average exercise. It compares a financial institution's performance with a carefully selected set of institutions that resemble it in asset size, business model, and geographic footprint. The BAI framework for measuring bank performance explains why the peer filter changes the interpretation of profitability, efficiency, credit quality, and other performance measures.
Consider a hypothetical bank that appears to have above-average efficiency when compared with a broad market grouping. Its directors might conclude that operating costs are under control. A more relevant peer set could reveal that similarly structured banks produce stronger earnings with comparable staffing and branch footprints. The first comparison creates comfort. The second creates a management question.
The average can hide the competitive problem
An undifferentiated average blends institutions with different funding models, regulatory profiles, market conditions, and strategic priorities. The result may be mathematically correct but operationally weak. It tells management where the bank sits against a mixed population, not whether its strategy is working better than the strategies available to comparable competitors.
A useful guide to performance benchmarking starts with a more demanding question: Which institutions should influence this decision? That question should be answered before selecting the ratio, dashboard, or percentile ranking.
Practical rule: If management can't explain why every institution belongs in the comparison group, the group isn't ready to guide strategy.
Peer analysis becomes valuable when it isolates the reason behind a gap. A lower ROA might reflect weaker pricing, higher operating costs, a different loan mix, high credit provisions, or a deliberate investment cycle. The benchmark doesn't make that diagnosis by itself. It gives executives a disciplined starting point for asking the right follow-up questions.
How to Build a Meaningful Peer Group
A meaningful peer group is built deliberately, not inherited from a generic industry filter. In practice, banks commonly use about 8 to 15 institutions and evaluate candidates by total asset size, geography, business mix, and charter type, as described in S&P Global Market Intelligence's banking ratings resources. Some guidance also recommends keeping comparable institutions within roughly a 2 to 3 times asset-size range so that scale doesn't overwhelm the comparison.
Start with scale, then test strategic fit
Asset size is a useful first screen because scale affects technology spending, staffing, funding access, and regulatory expectations. It shouldn't be the final filter. Two banks with similar assets can face very different economics if one concentrates on commercial borrowers while the other relies on residential lending or wealth management.
Geography matters for deposit competition, loan demand, employment conditions, property values, and local credit risk. Charter type can affect reporting context and supervisory comparisons. Business mix helps explain why one bank carries a different margin, efficiency ratio, or concentration profile from another.
A practical selection process asks:
- Does the institution operate in a comparable market? A bank competing for the same deposits and commercial relationships is usually more informative than a distant bank of identical size.
- Does its balance sheet have a similar shape? Compare funding sources, loan categories, securities exposure, and concentration patterns before treating ratios as equivalent.
- Does its charter and reporting context support a fair comparison? Standardized reporting improves consistency, but executives still need to understand what each measure captures.
- Does the group include both stronger and weaker performers? A useful cohort exposes attainable practices as well as vulnerabilities.
The FFIEC's technical information for the Uniform Bank Performance Report describes peer-group data as a way to benchmark an individual bank's asset and liability structure and earnings. For commercial banks, the FFIEC classifies peer groups using 90-day average assets from Call Report Schedule RC-K. That standardized foundation makes repeatable comparisons possible, but it doesn't remove the executive's responsibility to validate strategic comparability.
Key Metrics That Reveal True Performance
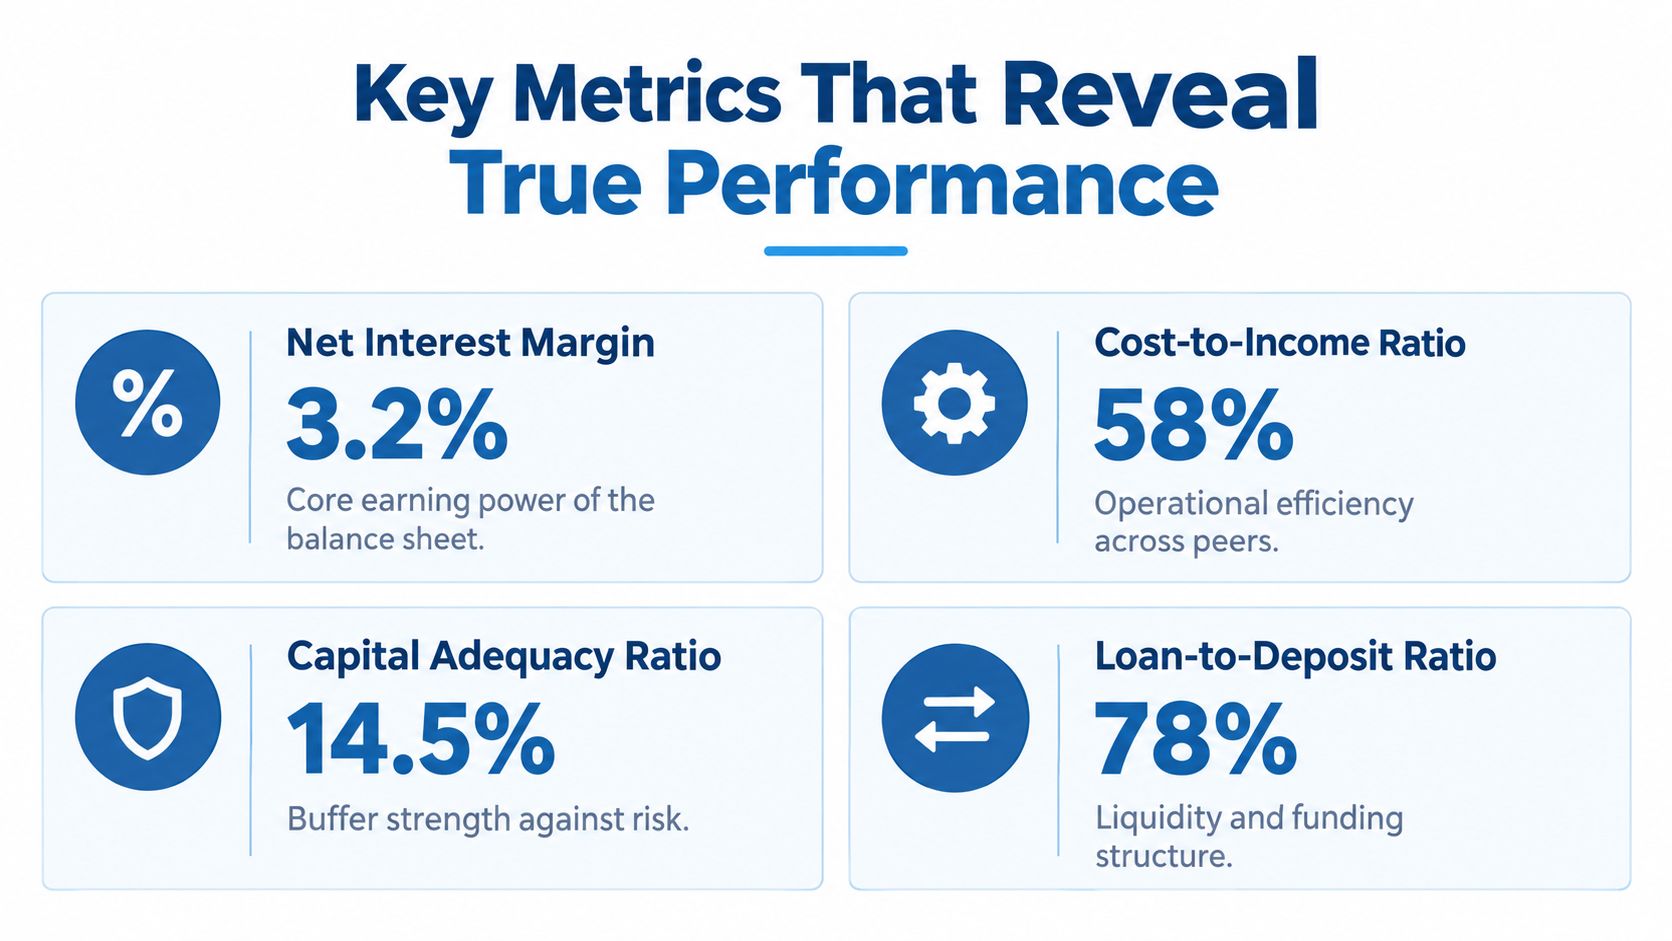
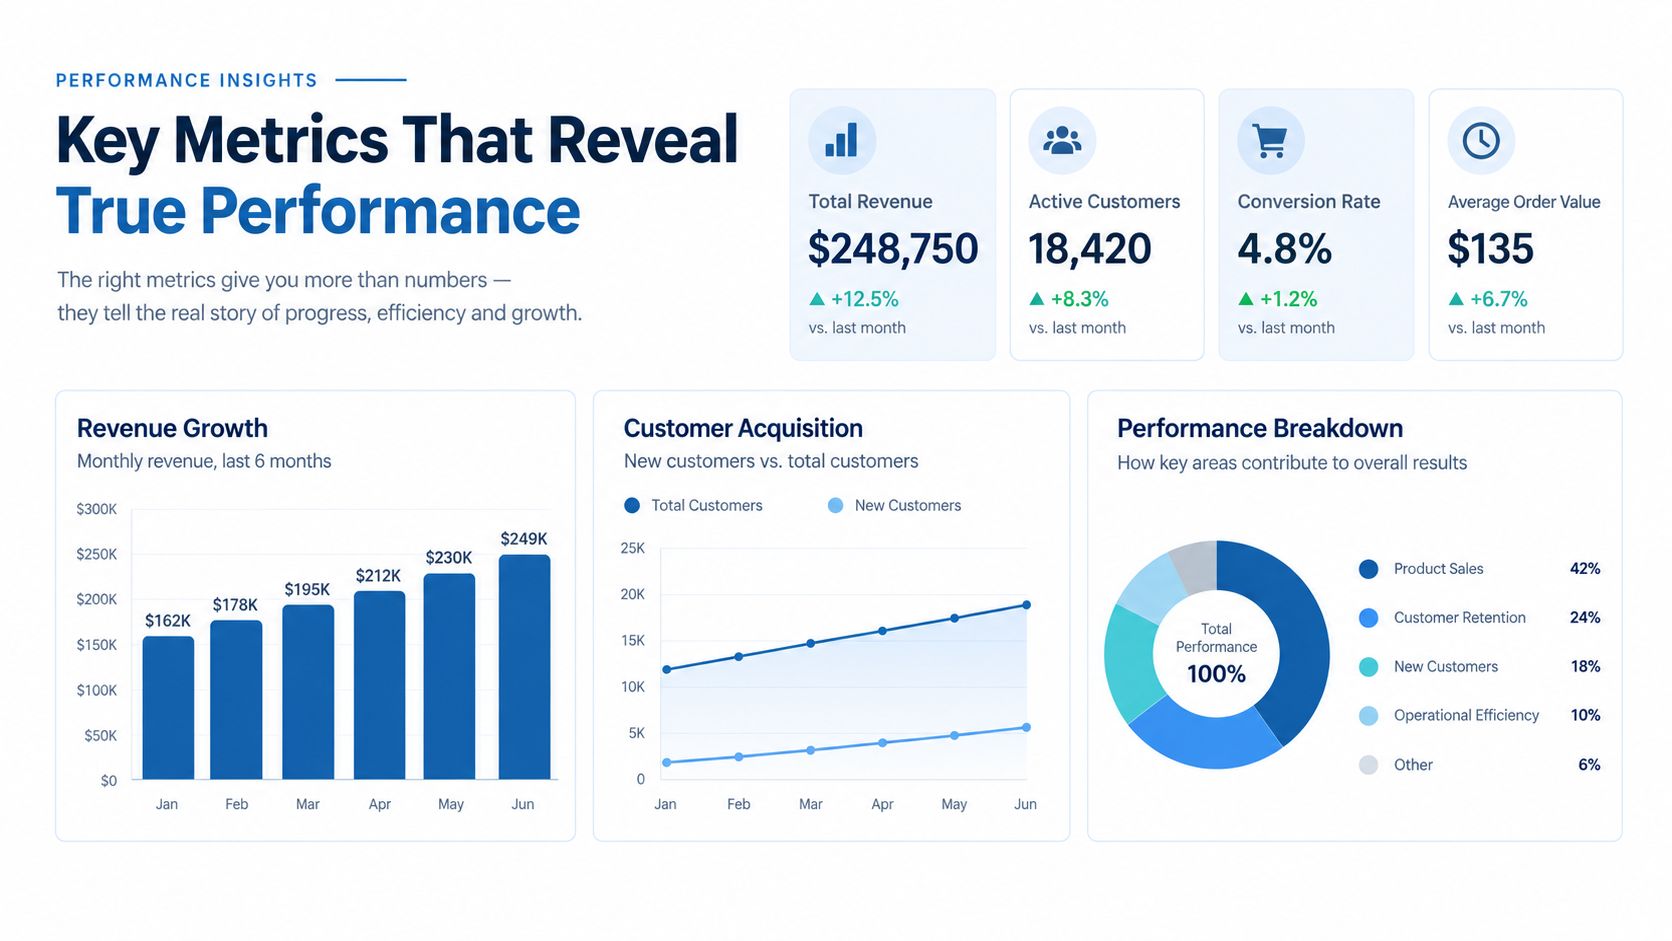
The most useful peer analysis connects returns to the balance-sheet and operating decisions that produce them. ROA and ROE show outcomes. Net interest margin points toward earning power. The efficiency ratio helps frame the cost of producing revenue. Asset quality, funding, and concentration metrics show whether those results are durable.
The bank peer data guidance from Abrigo emphasizes ROA, ROE, net interest margin, loan-to-deposit ratio, CRE concentration, delinquency, and net charge-offs because these measures connect balance-sheet structure, credit risk, and earnings volatility.
Read the ratios as a system
ROA is useful when management asks whether the bank is converting its assets into earnings efficiently. ROE adds the effect of capital structure and can reward borrowing that increases risk. Neither ratio explains the result alone. A bank may post stronger returns because of superior pricing, lower expenses, a different asset mix, or greater exposure to a favorable but riskier category.
Net interest margin deserves the same discipline. A higher margin may reflect effective pricing and funding management, but it can also accompany a loan mix with greater sensitivity to credit or liquidity conditions. The loan-to-deposit ratio helps clarify that trade-off. A higher ratio can support margin expansion while increasing liquidity sensitivity.
Pair growth with risk
A bank that grows commercial real estate lending faster than its peers may be gaining share, strengthening relationships, or accepting concentration risk. CRE concentration should therefore sit beside delinquency, net charge-offs, capital, and funding measures. Looking only at growth can make an aggressive strategy appear successful until credit costs change the earnings profile.
The same logic applies to efficiency. A lower efficiency ratio may indicate disciplined expenses, but it may also reflect underinvestment in technology, compliance, talent, or customer service. Directors should ask what operating choices sit beneath the ratio and whether the peer's advantage can be reproduced without importing its risks.
A practical dashboard should therefore answer three questions:
- What happened? Review profitability, growth, funding, and asset quality outcomes.
- Why did it happen? Connect the outcomes to business mix, operating costs, pricing, and concentrations.
- What could happen next? Test whether the advantage depends on conditions that may change.
The banking performance metrics framework is useful for organizing these measures into a decision context rather than treating each ratio as an isolated score. The objective isn't to produce more rankings. It's to identify which management levers explain the distance between a bank and its relevant peers.
From Static Rankings to Predictive Intelligence
A ranking describes where a bank stood. A predictive workflow helps executives decide what to change before the next reporting period. Historical ratios still matter, but they rarely identify which product deserves priority, which market needs defense, or which risk signal requires intervention.
Recent banking benchmarking analysis describes traditional benchmarking as backward-looking. It focuses on prior ratios and may not show what leading institutions do differently or what operational changes would close a performance gap. A forward view combines financial results with operational, customer, product, digital, sales, and risk signals. That broader evidence connects peer position with the decisions management can actually control.
Ranking versus decision support
A static report may show that a bank's efficiency trails its peer median. Decision support examines whether the difference reflects branch density, technology spending, staffing mix, loan production, servicing costs, or revenue quality. The analysis then assigns an action, an owner, and a measure of progress.
That distinction matters to directors. A percentile ranking can identify an outlier, but it should not become a target without context. Management may accept higher costs during a core conversion, invest in a new market, or hold additional liquidity because the board approved a different risk posture. The right question is whether the choice is deliberate, understood, and monitored.

Build an explainable forward view
Predictive peer analysis is a disciplined method, not an unsupported forecast. It combines historical performance with current signals and makes the reasoning visible. A bank can examine whether peer changes in funding, loan categories, hiring, local conditions, or product activity tend to precede changes in profitability or credit quality. Recent benchmarking work points toward approaches such as predictive analytics for banks, where timely signals complement established financial measures.
A useful workflow should produce:
- A priority gap: the performance difference most relevant to the current strategy.
- A likely driver: the balance-sheet, operating, or market factor associated with that gap.
- A management response: a pricing review, prospecting effort, underwriting change, or funding action.
- A monitoring signal: the measure showing whether the response is working.
A benchmark becomes predictive when it changes what a manager does before the next reporting cycle.
Executives should require auditability. Each recommendation should trace to standardized data, a defined peer group, and an understandable calculation. Otherwise, a polished ranking can create false confidence. The practical progression is clear: identify the gap, explain its controllable cause, select the decision, and monitor the signal that follows.
Driving Sales and Risk Decisions with Data
Peer analysis earns its place in the executive toolkit when it changes commercial and risk decisions. Financial ratios describe market position, but relationship managers need to know which institutions to approach, what products may be relevant, and why a prospect is worth attention. Risk officers need to know whether a portfolio shift reflects a controlled strategy or a developing vulnerability.
A unified dataset can connect a bank's peer position with observable business signals. For example, a commercial lender may identify peer institutions that are expanding in a target market, changing their loan mix, or showing stronger deposit growth. That doesn't prove a prospect is dissatisfied or ready to switch providers. It gives the lender a reason to investigate, validate the account structure, and tailor the conversation.

Turn peer gaps into sales priorities
Suppose a bank's peer comparison shows that its commercial deposit base is less developed than that of strategically similar institutions. The sales response shouldn't be a generic campaign aimed at every business in the market. Leaders can ask which industries, relationship types, and geographic pockets support the stronger peer outcome, then assign relationship managers to prospects that fit the bank's capabilities.
The same analysis can support product conversations. A bank with strong lending production but weaker core deposits may need a treasury management or operating-account strategy, not another broad loan promotion. The benchmark helps executives identify the commercial problem before sales teams choose the solution.
Use peer signals to sharpen risk oversight
Risk management benefits from the same connected view. If peer institutions with similar business models show rising delinquencies or net charge-offs in a concentrated portfolio, the bank can review underwriting, collateral, covenant monitoring, and borrower exposure before its own results deteriorate. Peer movement isn't proof of future loss, but it can improve the timing of surveillance and scenario analysis.
A disciplined workflow separates signal from conclusion:
- Detect the difference. Identify a meaningful gap or directional change against the chosen cohort.
- Investigate the driver. Examine product mix, geography, underwriting, funding, and operating conditions.
- Assign the response. Give sales, finance, credit, or treasury a specific follow-up.
- Track the outcome. Revisit the metric and the underlying driver, not just the ranking.
The commercial value of peer analysis is not knowing who ranks first. It's knowing where a relationship, product, or risk decision deserves attention.
Common Pitfalls to Avoid in Benchmarking
The nearest size match isn't always the best peer. That assumption is attractive because asset size is easy to filter and explain, but size alone can place dissimilar institutions in the same group. A bank focused on specialized commercial lending may face different pricing, liquidity, and credit conditions from a similarly sized bank built around residential mortgages.
The BAI benchmarking infographic makes the broader strategic point: the strongest peer group is the closest strategic cohort, even when that cohort cuts across asset size. Market model and operating constraints can matter more than a narrow balance-sheet match.
Don't let a convenient group dictate the conclusion
A weak peer set can mislead management about capital strength, asset quality, funding, and efficiency. It can also reward a strategy only because the comparison group doesn't carry the same constraints. Executives should challenge any analysis that presents a single favorable benchmark without showing the institutions included, the measures used, and the reasons for inclusion.
Point comparisons create another problem. A single peer average can be pulled toward extreme performers or obscure the range of outcomes. Distributional analysis gives directors more context by showing medians, ranges, and relative position rather than treating one number as the definition of success.
The FFIEC's peer-group average report addresses outlier distortion by trimming peer averages and excluding banks above the 95th percentile and below the 5th percentile. That approach doesn't replace judgment, but it demonstrates why the construction of the benchmark affects the credibility of the result.
Treat methodology as a control
The FDIC's BankFind methodology guidance explains that condition and performance ratios are calculated as weighted averages, using summed numerators and denominators rather than simple arithmetic averages. That distinction matters when institutions in a group differ materially in scale.
Finally, don't turn the benchmark into a quota. A bank may sit below a peer median for a sound reason, or above it while accumulating unacceptable risk. The board's job is to determine whether the difference reflects a deliberate choice, an execution problem, or an emerging exposure.
Next Steps for Strategic Banking Intelligence
Peer analysis works when standardized data, careful peer selection, and management judgment operate together. Regulatory reporting provides a consistent foundation, but executives still need to define the strategic cohort, interpret the ratios in context, and connect findings to decisions.
The FFIEC's UBPR materials support both forms of comparison. The UBPR FAQ explains that a bank can be compared with itself over time and with peer banks, with percentile rankings from 0 to 99 for most ratios. That combination helps leaders separate a temporary change from a persistent competitive position.
The practical next step is to establish a repeatable workflow:
- Maintain a peer group that reflects strategy, market, and operating constraints.
- Review profitability, efficiency, funding, growth, capital, and asset quality together.
- Add operational and market signals where they explain the financial outcome.
- Convert each material gap into an accountable commercial, finance, treasury, or risk action.
- Reassess the peer set when the bank's strategy or market changes.
A platform such as Visbanking can unify financial, regulatory, market, and people data so bank teams can move from disconnected reports to explainable, decision-ready analysis. The important shift isn't from one dashboard to another. It's from collecting peer data to using it to choose where to compete, where to invest, and where to reduce exposure.
Visbanking helps bank executives benchmark performance against relevant peers, connect financial and market signals, and turn gaps in profitability, growth, and risk into practical next steps. Visit Visbanking to explore the data and tools for building a more decision-ready peer analysis workflow.
Latest Articles
Brian's Banking Blog
Business Registration Data Banks Can Actually Use

Brian's Banking Blog
How to Secure REST API with JWT for Banking

Brian's Banking Blog
Commercial Loan Analysis: A Bank Executive's Guide
Brian's Banking Blog
Understanding Statistical Significance in Banking
Brian's Banking Blog
Option Adjusted Spread: A Banker's Practical Framework
Brian's Banking Blog