
Operational Risk Indicators for Banks
Brian's Banking Blog
EU/EEA banks recorded about 3 million operational loss events in 2023, and total materialized losses reached EUR 17.5 billion (European Banking Authority). That combination matters more than the usual compliance rhetoric, because frequency and severity are no longer moving in lockstep. A bank can see more events without seeing the biggest euro loss, or see fewer events with worse outcomes, and a board committee that reads only the top-line loss number will miss the drift.
Operational risk indicators are the bridge between raw events and management action. They are observable, quantifiable signals, things like failed trades, staffing volatility, system outages, unresolved incidents, and vendor breaches, that tell executives when exposure is building before the loss hits the P&L. Dashboards without thresholds are decoration. Indicators with ownership, escalation, and capital relevance are management tools.
Why Operational Risk Indicators Matter Now
The newest supervisory data says banks can't afford to treat operational risk as a back-office hygiene issue. The EBA's 2025 and 2026 reporting shows operational losses remain high, while materialized losses can move differently from event counts, which is exactly why boards need trendable indicators, not just incident summaries. A relationship manager doesn't need a thousand-page risk pack. They need to know when a client, product line, or service provider is drifting into a zone that deserves immediate attention.
An operational risk indicator is a measured signal, reviewed against a threshold, that sits ahead of aggregate loss. It is not the loss itself, and it is not a post-mortem. It is the early-warning layer, the thing that tells the bank to act while there's still time to change the outcome.
What to track, and what to ignore
Ignore dashboards that only list incidents. Track measures that can be reviewed on a set cadence, escalated when they move, and tied to an owner. The Reserve Bank of India's guidance is practical here, citing indicators such as failed trades, staff turnover rates, and the frequency or severity of errors and omissions as examples that can be reviewed monthly or quarterly (RBI guidance).
Practical rule: if a metric doesn't trigger a conversation, an owner, or a decision, it isn't an operational risk indicator. It's just reporting.
That distinction matters in a market shaped by cyber events, fraud, third-party outages, and process failures. Teams should use indicators to catch drift early, not to decorate the monthly risk pack.
The Basel Lineage That Made ORIs a Capital Lever
Basel didn't always treat operational risk as a capital variable. The 1988 capital accord didn't separately recognize it, and the concept became formal only later, with Basel II introducing operational risk quantification in 2006. The shift came with the 2019 Basel standardized approach, effective in 2022, which replaced the older simpler approaches with the Business Indicator, Business Indicator Component, and Internal Loss Multiplier framework (BIS Basel framework).
That change turned internal loss data into capital input. Under the standardized approach, the Internal Loss Multiplier is driven by a bank's average annual operational losses over the prior 10 years, and banks with BI above €1 billion must use loss data directly in operational risk capital calculations (BIS Basel framework). The message to directors is blunt, better data discipline affects capital, not just controls.
Why frequency and severity must be tracked separately
The EBA's recent supervisory work reinforces the point. Loss frequency and loss severity can diverge, so a bank that watches only one of them can fool itself. A pile of smaller incidents may still matter because the Basel framework counts repeated losses over time, and the loss component is set as 15 times average annual operational losses over the prior 10 years (OSFI guidance). In plain English, repeated small failures can become expensive fast.
For banks comparing peers or adjusting appetite, operational risk indicators become a capital lever at this point. Visbanking's Basel III endgame analysis for community banks is useful context for directors who need to connect supervisory mechanics to planning decisions.
A Working Taxonomy of Operational Risk Indicators
Executives make bad decisions when they lump every signal into one pile. The useful split is simple, leading versus lagging, then KRI versus KPI. A leading indicator tells you exposure is building. A lagging indicator tells you the control already failed. A KRI monitors risk drivers, while a KPI shows process performance, which can still reveal weakness before a loss becomes material (BIS BCBS 195).
Use the right signal for the job
For a board committee, leading indicators belong on the front page. For an internal control review, lagging indicators matter because they show where the system failed. A business line should not default to loss counts when the key question is whether the process is drifting.
Board-level rule: if the indicator does not change behavior, it doesn't belong in the top tier.
Operational risk also clusters into familiar event types. Basel's event taxonomy still matters because it keeps people from mixing fraud, process failure, systems failure, and external disruption in one mushy reporting bucket. That taxonomy should map cleanly to indicator design.
| Indicator Type | Definition | Example Signal | Typical Use |
|---|---|---|---|
| Leading KRI | A signal that rises before a loss event | Unresolved control exceptions, failed trades, vendor SLA drift | Early warning and escalation |
| Lagging KRI | A signal that appears after an event | Confirmed loss events, audit findings, incident counts | Root-cause review and trend tracking |
| KPI | A measure of process execution | Processing timeliness, completion rate, uptime | Operational performance management |
| Threshold breach signal | A metric that crosses an approved limit | Turnover spike in a critical team | Triggering action, not reporting |
The point is discipline. Relationship managers should use leading indicators when they need early warning on client operations, and lagging measures only when they need to explain what already happened.
Concrete Metrics, Thresholds, and What a Breach Looks Like
Banks need thresholds that a CRO can defend in committee, not vague comfort language. The right way to think about this is by category, people, process, technology, and external dependency. The exact threshold will vary by institution, but the logic of the bands should be consistent, steady state, watch closely, then escalate hard.
People and process signals
Staff attrition in critical operations roles is a classic leading indicator. In a healthy state, turnover is stable and hiring backfills don't lag. An amber condition is a noticeable rise in exits or vacancy time, and a red breach is when the team starts missing settlements, reconciliations, or approvals because experienced staff have left. A weak bench in loan operations or payments creates customer impact fast.
Transaction processing error rate is another direct signal. If errors rise from routine rework into repeated exceptions, the process is no longer under control. At that point, the committee should ask whether the issue is training, workload, systems design, or maker-checker discipline.
Technology and external dependency signals
Core uptime belongs on every executive dashboard. When availability slips, customers feel it immediately, and service desks start the paper trail for disruption risk. Third-party SLA misses are just as important, because a vendor outage becomes your outage once clients can't transact or access data.
The table below gives a committee-ready structure. The numbers are intentionally illustrative, but they are framed to be realistic and actionable.
| Category | Indicator | Healthy Band | Amber Trigger | Red Threshold |
|---|---|---|---|---|
| People | Annualized attrition in critical ops roles | Stable and planned | Noticeable increase over prior period | Persistent loss of key staff affecting controls |
| Process | Transaction processing error rate | Low and contained | Errors rising and creating rework | Errors causing missed postings or customer impact |
| Technology | Core system uptime | Near-continuous availability | Repeated short outages | Uptime loss that disrupts service delivery |
| External | Third-party SLA misses | Rare and explained | Repeated delivery slippage | Misses that affect client service or internal control |
Committee test: if a threshold breach would not change staffing, funding, or vendor pressure, the threshold is too soft.
Use these as reference points, then calibrate them against your own loss history and peer benchmarks. Visbanking's data layer can help teams compare internal patterns with public banking data and speed the calibration work.
Data Sources and How to Measure Each Indicator
Most ORI programs fail at plumbing, not logic. The indicator can be right and the feed can still be wrong, stale, or incomparable. That is why every signal needs a source system, a owner, and a data-definition note that explains exactly how it's calculated.
Match each indicator to the right source
Regulatory call reports and UBPR data help with peer context and trend benchmarking. Internal loss databases should follow the Basel event-type taxonomy so the bank doesn't mix categories that don't belong together. Incident and problem ticket systems capture leading signals, while HRIS supports staff-turnover metrics, SIEM and ITSM feeds cover technology controls, and vendor-risk platforms track external dependencies.
Raw events should be normalized into rates and rolling averages. Near-miss reporting matters too, because near misses are often the early version of a later failure. If a bank ignores them, it loses the chance to recalibrate thresholds before the same issue becomes a capital problem.
Keep lineage tight enough for capital use
Data lineage matters because the same numbers can feed both committee reporting and the Business Indicator Component under the Basel framework. If the source is unreliable, the bank can't defend the output. That is especially true where operational losses feed capital, because poor input hygiene becomes expensive.
Visbanking's data pipeline guidance is a practical reference for teams trying to move from fragmented feeds to a governed data flow. The point isn't sophistication for its own sake, it's traceability.
Validate the source before you validate the threshold. A clean threshold on dirty data is still a bad control.
Before any indicator reaches capital planning or the board packet, test the feed, test the calculation, and test the exception logic. If the numbers can't be reproduced, they can't be trusted.
Building a Monitoring Framework That Drives Action
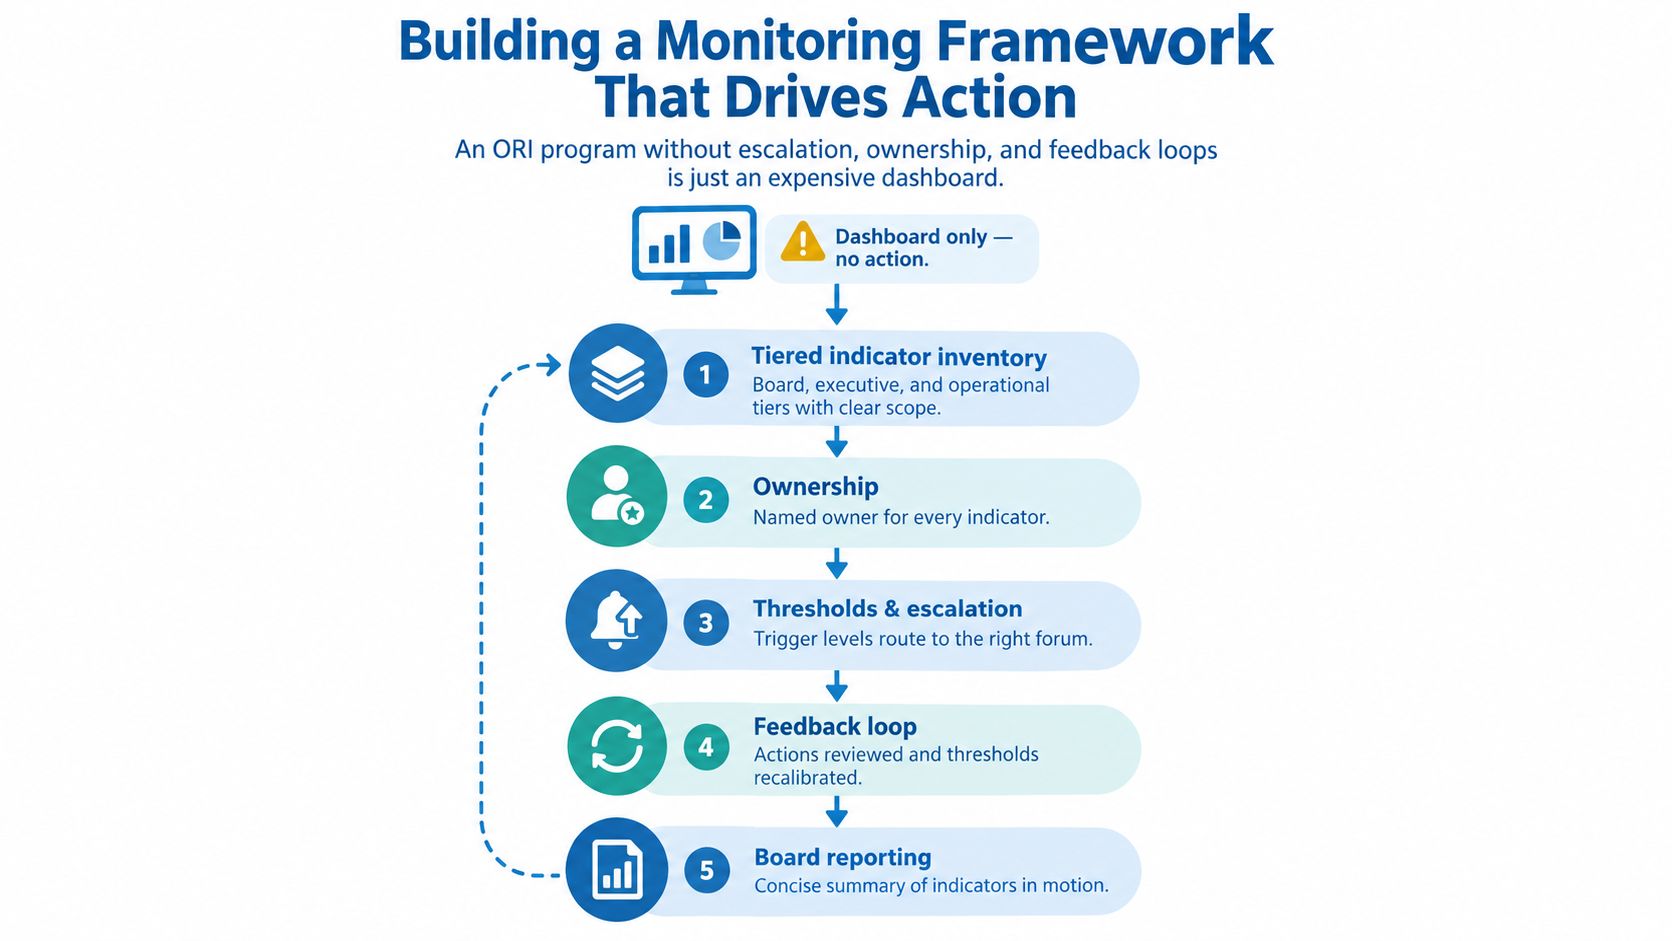
An ORI program without escalation, ownership, and feedback loops is just an expensive dashboard. Boards should reject any design that stops at reporting. The monitoring model has to look like a control loop, with clear tiers, named owners, and consequences when a measure moves.
Build it in three layers
Start with a tiered indicator inventory. Board indicators should be sparse and tied to appetite. Executive indicators should show directional movement by function. Operational indicators should be close to the work, so the business line sees the exact process that's drifting.
Next, assign a named owner to every indicator. If no one owns a measure, no one will fix the underlying problem. Then define escalation paths that route breaches into the right forum, incident review, issue management, or capital planning, depending on the nature of the signal.
Connect indicators to action, not just reports
The framework should feed RCSA refreshes, issue closure, and capital planning cycles. It should also help teams understand whether better loss data quality can reduce the Internal Loss Multiplier over time, since the Basel regime explicitly ties loss history to capital inputs (BIS Basel framework).
For a practical control reference, the control framework for mid-market from Lighthouse Consultants is a useful companion because it keeps ownership and escalation front and center. Visbanking's early warning system for banks fits naturally here as a way to turn alerts into workflow, not just noise.
Pitfalls That Quietly Undermine ORI Programs
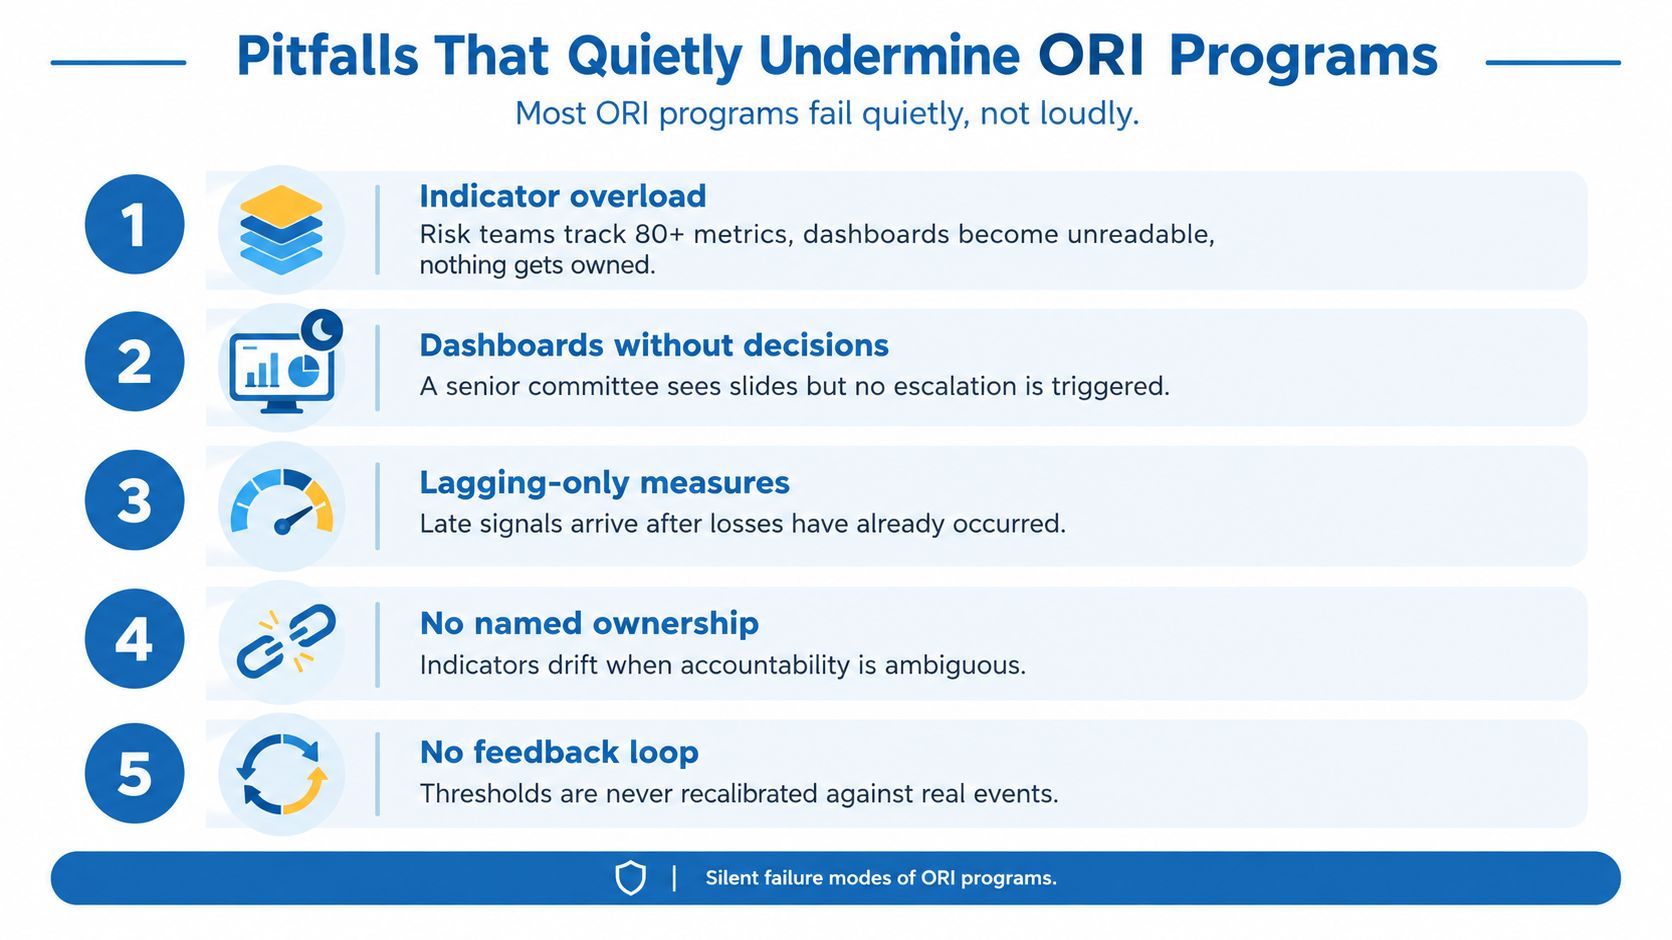
Most ORI programs fail without warning, not loudly. They start with good intent, then collapse under their own weight. The biggest mistake is indicator overload. A committee cannot govern 80 moving parts with any real discipline, and when everything is highlighted, nothing is urgent.
Stale thresholds and lagging-only thinking
Thresholds age badly. Bands set years ago against a pre-digital loss profile often either never trip or trip constantly. That is bad governance because it trains leaders to ignore the alert stream.
The second mistake is over-reliance on lagging measures. Gross loss amount and settled incidents are useful for review, but they're late. The better early signals are the messy ones, failed change tickets, control attestations slipping, repeated SLA misses, and rising exception queues.
Cyber and third-party signals need the same discipline
Cyber and third-party indicators should not sit in a side drawer. They belong in the same taxonomy as fraud and process failure, because the bank experiences the loss the same way, through service disruption, remediation cost, and supervisory scrutiny. The EBA's recent reporting makes the frequency-severity split plain, and banks that treat one as a proxy for the other are building false comfort into the dashboard.
Hard rule: each indicator must be either leading or lagging by design. If it tries to be both, it usually becomes neither.
The fix is ruthless prioritization. Cap the active set, review thresholds at least annually, name an owner for every metric, and retire anything that doesn't change decisions. Discipline beats coverage every time.
A 90-Day Starter Plan for Risk Teams and Relationship Managers
The fastest way to get an ORI program working is to stop overbuilding it. Start with what already exists, narrow the list, then wire the metrics into a weekly operating rhythm. Relationship managers need the same discipline as risk teams, because they're often the first to hear when a client's controls, service providers, or internal processes are weakening.
Days 1 to 30
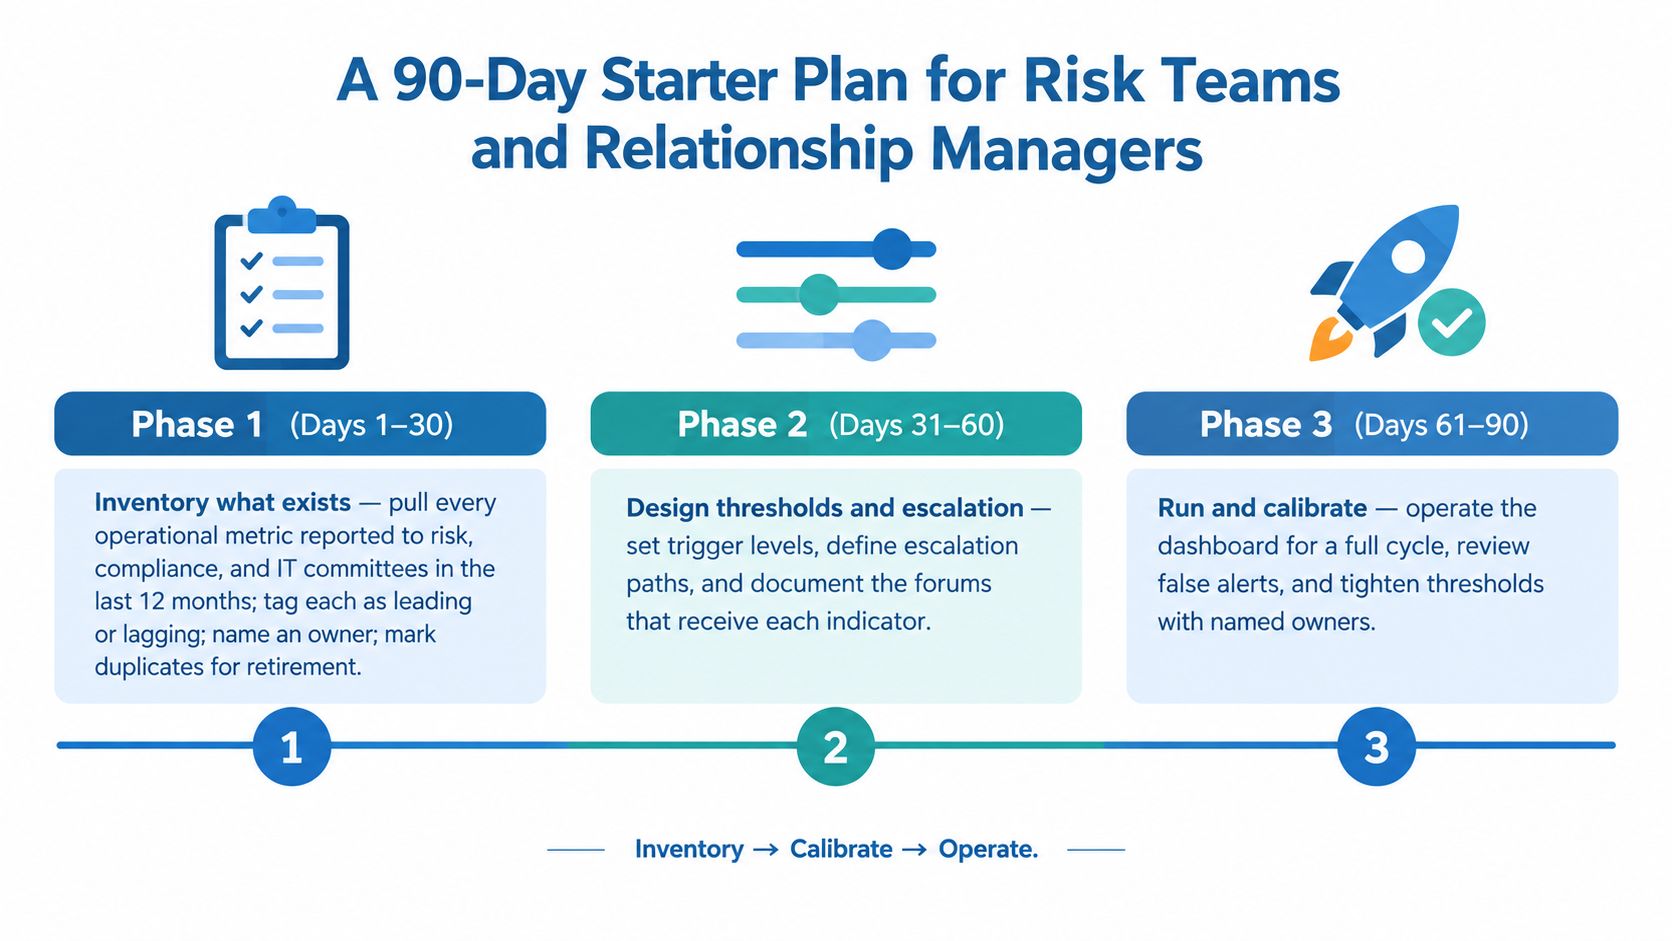
Inventory every operational metric already going to risk, compliance, and IT committees. Tag each one as leading or lagging, assign an owner, and retire duplicates. If a metric hasn't been reviewed in a year, it probably shouldn't survive the clean-up.
Days 31 to 60
Pick a starter set of 12 to 15 indicators across people, process, technology, and external dependency. Use your thresholds to set the first escalation path, then wire three live alerts first, core uptime, unauthorized access attempts, and high-severity incident ageing over SLA. That is enough to prove the workflow before you expand it.
Days 61 to 90
Publish a weekly one-page ORI digest for relationship managers and line risk officers, with traffic-light status and one action column. Hold a quarterly threshold review with finance, ops, and the CISO. By day 90, you should have something defensible, operational, and useful for capital planning.
Benchmarking against peer UBPR data shortens the calibration cycle, because it gives you a reference point instead of guesswork. Visbanking's bank intelligence stack can support that benchmarking, alerting, and peer comparison work in one place.
If you want a sharper view of how your bank's operational risk indicators compare with peers, and how to turn those signals into action instead of noise, explore Visbanking. Visbanking helps banks and credit unions benchmark performance, connect multiple data sources, and build alerting around the metrics that actually move decisions.
Latest Articles
Brian's Banking Blog
Automated Alerts and Notifications for Banks
Brian's Banking Blog
Customer Feedback Loop for Banks: A Practical Playbook

Brian's Banking Blog
Commercial Lending Trends: What Bank Executives Must Know
Brian's Banking Blog
Bank Marketing Dataset Analysis Strategy

Brian's Banking Blog
ESG Peer Benchmarking for Bank Leaders
Brian's Banking Blog