Mastering Banking Performance Metrics: A Guide for Executives
Brian's Banking Blog
Banking performance metrics are the vital signs of a financial institution. Quantitative indicators like Return on Assets (ROA) and the Efficiency Ratio provide a data-driven snapshot of a bank's health, operational effectiveness, and profitability relative to the competitive landscape.
Turning Data Into Decisive Action
In today's banking environment, relying on instinct alone is a critical failure of leadership. The gap between market leaders and the rest of the pack is defined by the ability to convert raw data into strategic intelligence.
This guide is for banking executives and directors who understand that mastering performance metrics is not an accounting exercise—it is the foundation of sound strategy, proactive risk management, and sustainable growth. We will move beyond simple definitions to focus on how to use these numbers to make decisive moves.

The objective is to provide a framework for asking more intelligent questions of your data—spotting emerging risks before they materialize and seizing opportunities competitors overlook. While high-level dashboards are a starting point, true insight comes from dissecting the numbers. Seeing how raw data becomes a strategic roadmap is powerful, and reviewing compelling financial dashboard examples can clarify this potential.
The Core Pillars of Your Bank's Health
Navigating the complexities of modern finance requires an integrated, holistic view. A bank's performance cannot be judged by a single number. Instead, it must be assessed across four interconnected pillars that collectively define institutional health:
- Profitability: The ultimate measure of a bank's ability to generate earnings relative to its assets, equity, and revenue. It answers the fundamental question: Is our business model creating sustainable value?
- Liquidity and Capital Adequacy: These metrics quantify resilience. They demonstrate the capacity to meet short-term obligations and absorb financial shocks, defining a bank's ability to play both defense and offense.
- Asset Quality: A deep analysis of the loan portfolio's health. It assesses credit risk and the potential for future losses, directly reflecting the discipline of the bank's underwriting.
- Efficiency: A measure of how effectively the bank manages noninterest expenses to generate revenue. A low ratio indicates strong operational control, but context is critical.
A metric in isolation provides a number; a metric in context provides a narrative. For example, a Return on Equity (ROE) of 15% appears strong on the surface. However, if it is driven by excessive leverage and a low Tier 1 Capital Ratio, it signals a high-risk strategy that could crumble under economic pressure.
This integrated approach, which is at the heart of data intelligence systems like Visbanking’s, helps executives avoid the strategic blind spots that arise from focusing on a single area of performance. By analyzing these pillars in concert and benchmarking them against relevant peer groups, isolated data points are transformed into a clear, actionable competitive strategy.
The Four Pillars of Institutional Health
A comprehensive assessment of your bank's performance requires looking beyond surface-level financial statements. Real command comes from understanding how four distinct, yet deeply interconnected, pillars of performance metrics function together as a framework for diagnosing institutional health, identifying hidden risks, and charting a clear path forward.
Analyzing these categories in isolation is a common and critical error. A single metric tells part of the story; a unified view reveals a bank's true competitive standing.
Let's dissect these pillars to demonstrate their role in the larger strategic picture.
The core metric categories, what they measure, and the strategic questions they help answer can be summarized as follows:
The Four Pillars of Banking Performance Metrics
| Metric Category | Key Indicators | Strategic Question for the Board |
|---|---|---|
| Profitability | ROA, ROE, Net Interest Margin (NIM) | "Is our business model generating sustainable value, and how does it compare?" |
| Liquidity & Capital | Loan-to-Deposit Ratio, Tier 1 Capital Ratio | "Can we withstand an economic downturn and retain the capacity to grow?" |
| Asset Quality | Non-Performing Loan (NPL) Ratio, ALLL Ratio | "How resilient is our loan book, and what does it reveal about our credit discipline?" |
| Efficiency | Efficiency Ratio, Assets per Employee | "Are our operations lean, or are we ceding a competitive advantage on cost?" |
Each pillar provides a different lens for viewing institutional health. Together, they offer the 360-degree perspective required for sound, defensible decision-making.
Pillar One: Profitability
Profitability metrics are the bottom line. They are the most direct measure of a bank’s ability to generate earnings and create shareholder value. They answer the essential question: Is our strategy working? The primary indicators are Return on Assets (ROA), Return on Equity (ROE), and Net Interest Margin (NIM).
ROA is the clearest signal of management’s effectiveness in using the bank’s assets to generate profit. It cuts through the noise of leverage to provide an unvarnished look at core operational performance.
The diagram below illustrates the direct relationship between net income, total assets, and the resulting ROA.
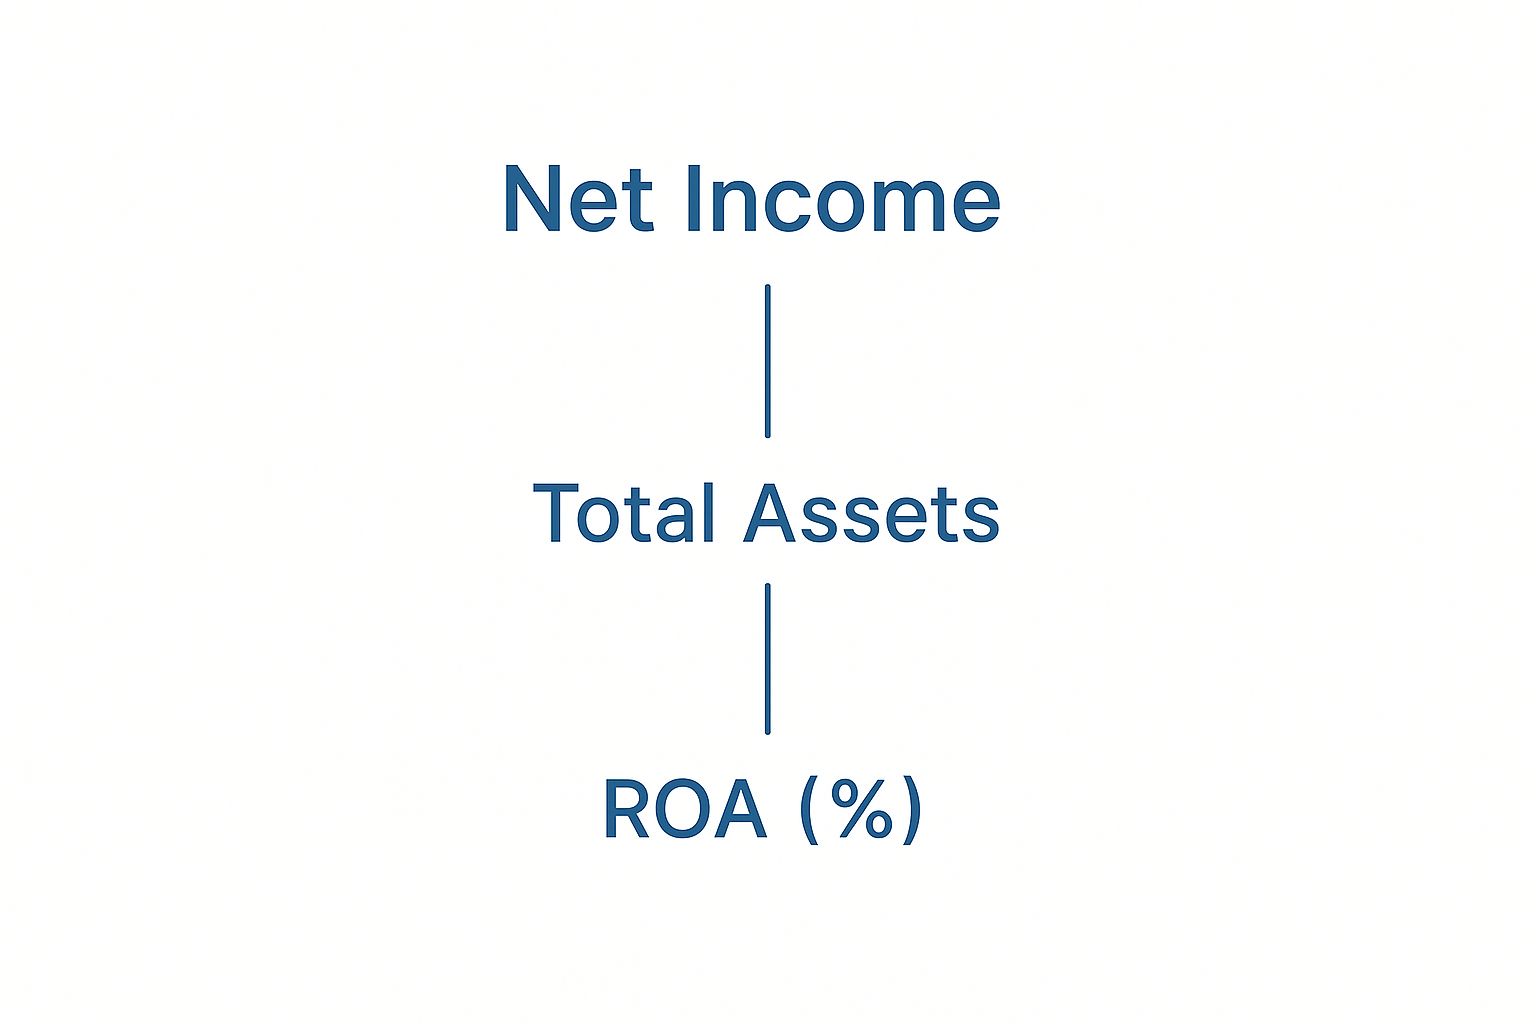
This visual simplifies the core concept: ROA is a direct result of how effectively the asset base is converted into net income.
ROE, by contrast, measures the return generated for equity shareholders. While a high ROE is desirable, it demands scrutiny. For instance, an ROE of 16% may seem exceptional, but if it is propped up by high leverage rather than strong earnings, it is a red flag for a high-risk strategy that could unravel quickly in a downturn.
A strong ROA indicates operational strength. A strong ROE without a corresponding strong ROA often indicates a reliance on financial leverage—a strategic choice that demands constant vigilance from the board.
Net Interest Margin (NIM) measures the spread between interest earned on assets and interest paid on liabilities. But the number itself is insufficient. Is NIM expanding due to shrewd asset/liability management, or is it simply riding a wave of favorable market rates? Modern data intelligence platforms allow executives to separate strategy from market luck, providing a clear picture of what truly drives performance.
Pillar Two: Liquidity and Capital Adequacy
These are metrics of survival and opportunity. They determine whether a bank can withstand economic shocks, meet its obligations, and fund new growth. The key indicators are the Loan-to-Deposit Ratio and the Tier 1 Capital Ratio.
The Loan-to-Deposit Ratio is a straightforward gauge of liquidity risk. A jump in this ratio from 85% to 95% over a year signals aggressive loan growth. While this can boost short-term profitability, it also shrinks the cash cushion available for unexpected withdrawals, increasing vulnerability during times of stress.
The Tier 1 Capital Ratio should not be viewed as a mere regulatory hurdle; it is a bank's strategic "dry powder." It provides the capacity to absorb unexpected losses without crippling operations. More importantly, a strong capital position enables offensive moves—such as acquiring a competitor or expanding into a new market—when others are forced to play defense.
Pillar Three: Asset Quality
This pillar provides an unsparing look at the health of the loan portfolio—the clearest reflection of a bank's credit discipline and underwriting standards. Key metrics include the Non-Performing Loan (NPL) Ratio and the Allowance for Loan and Lease Losses (ALLL) Ratio.
The NPL ratio, which tracks loans at or near default, is a critical but lagging indicator. By the time NPLs are spiking, the underlying problems are already entrenched.
Forward-thinking leaders use business intelligence tools to gain a predictive view of risk. They analyze early delinquency trends, portfolio concentrations by industry or geography, and credit migration patterns. For example, identifying a 30% increase in 60-day delinquencies within a specific commercial real estate segment enables management to act before those loans become non-performing.
Pillar Four: Efficiency
Operational efficiency measures how effectively a bank manages its noninterest expenses to generate revenue. The Efficiency Ratio and Assets per Employee are standard measures, but the story is always in the context.
A low efficiency ratio is desirable, but it can be deceptive. A ratio of 55% might indicate a disciplined operation. Alternatively, it could signal chronic underinvestment in technology and talent, creating a long-term competitive vulnerability.
This is where peer benchmarking is indispensable. Comparing efficiency metrics against a curated group of similar institutions reveals whether performance is genuinely best-in-class or a dangerous mirage of underinvestment. This insight transforms raw data into a competitive roadmap.
The overall banking climate remains positive, but this level of scrutiny is non-negotiable. According to the FDIC, the industry's net income recently grew by 5.6% to $268.2 billion, with the average ROA ticking up to 1.12%. You can dig into these trends in the FDIC's latest risk review.
By mastering these four pillars and demanding a data-driven, contextual view, bank executives can navigate any market with confidence. The first step is to see how your institution stacks up.
Connecting Macro Trends to Micro-Level Strategy
It is one thing to read about market forces; it is another to connect those high-level trends to your bank’s balance sheet. Metrics viewed in a vacuum are inert. The real value is unlocked when a bank's internal numbers are interpreted through the lens of the broader economic environment.
This section bridges that gap, examining how external factors like interest rate movements and economic uncertainty directly impact core banking performance metrics like Net Interest Margin and credit quality. Understanding these connections is what separates reactive managers from proactive leaders prepared for both risk and opportunity.

From Market Shifts to Balance Sheet Impact
Consider a practical example: the Federal Reserve raises interest rates by 50 basis points. For an executive, the first question should not be, "What does this mean for the industry?" It must be, "How will this impact our bank's NIM compared to peers with a different asset and liability mix?"
A bank with a portfolio dominated by floating-rate commercial loans might see its NIM expand almost immediately. Conversely, an institution holding long-term, fixed-rate securities funded by short-term deposits could see its margin severely compressed. The decisive factor, as always, lies in the details of the balance sheet.
This is where a sophisticated data intelligence platform becomes a crucial strategic tool. It allows you to model these scenarios before they occur, stress-testing your balance sheet under various rate environments to gain a predictive view. This is the essence of proactive risk management.
Distinguishing Strategy from Market Tailwinds
It is easy to appear successful in a booming economy. But are stellar results a product of superior strategy, or simply a rising tide lifting all boats? This is a dangerous illusion. Analyzing industry-wide Total Shareholder Return (TSR) provides necessary context.
For example, the global banking industry recently posted a strong TSR of approximately 30% over 12 months, handily outpacing the broader market. A closer look, however, revealed that much of this performance was driven by macro tailwinds, not fundamental strategic outperformance. You can explore more about these banking sector trends to see the external forces at play. This distinction is paramount for creating sustainable, long-term value.
When the entire industry is performing well, the most important question for a board to ask is: "Are we outperforming our specific peer group, and if so, is that outperformance sustainable?" True competitive advantage is measured relative to direct rivals, not by absolute numbers alone.
This is precisely why granular, apples-to-apples benchmarking is essential. By filtering down to a peer group with a similar asset size, geographic footprint, and business model, you can isolate whether your unique strategy is, in fact, delivering a competitive advantage.
An Example of Proactive Scenario Planning
Let’s illustrate how this plays out. A regional bank with $5 billion in assets anticipates economic headwinds and is concerned about its commercial real estate (CRE) portfolio.
Instead of waiting for Non-Performing Loans to rise, the leadership team uses its BI platform to get ahead of the problem:
- Identify Peer Vulnerabilities: They analyze the CRE loan concentrations and delinquency rates of a curated peer group. They discover that peers with over 25% of their loan book in office properties are already experiencing a 15% rise in 30-day delinquencies.
- Model Internal Impact: Next, they run a simulation to assess their own exposure. A projected 10% drop in local CRE property values translates to a potential $20 million increase in their provision for credit losses over the next 12 months.
- Take Preemptive Action: Armed with data, not just intuition, the board immediately directs management to tighten underwriting standards for new office loans, conduct a rigorous review of its existing CRE portfolio, and reallocate capital toward less cyclical industries.
This is the outcome of connecting macro trends to micro-level action. It transforms data from a rearview mirror into a forward-looking strategic compass. By understanding how market dynamics are likely to impact core banking performance metrics, you can make smarter, more defensible decisions that protect the institution and create real value.
The Digital Shift is Reshaping Bank Performance
Traditional metrics like the efficiency ratio and ROA, while still important, only tell part of the story. They are lagging indicators of past performance and fail to capture the drivers of future success. Today, a bank's long-term profitability and market position are being determined in its digital channels. Executives not monitoring these new digital banking metrics are operating with a critical blind spot.
Digital performance is no longer an IT concern; it is a board-level imperative directly tied to the future financial health of the institution. Metrics such as digital customer acquisition cost, channel adoption rates, and customer lifetime value are direct predictors of tomorrow’s balance sheet.
Beyond the Traditional Efficiency Ratio
Consider a classic scenario. Bank A reports an efficiency ratio of 58%, while Bank B is at 62%. On the surface, Bank A appears to be the superior operator.
However, an analysis of their digital metrics reveals a different reality:
- Bank B's digital channel adoption is 30% higher than Bank A's, indicating a larger, faster-growing base of customers who are less costly to serve.
- Bank B's digital customer acquisition cost (CAC) is half that of Bank A's, enabling more profitable and rapid customer base expansion.
While Bank A may look better on a traditional basis today, Bank B is building a more scalable, profitable, and future-proof business model. This is the strategic insight digital metrics provide—they measure momentum and potential, not just historical results.
The question for the board is no longer just, "How efficient are we?" It is, "Are we building an efficient operating model for the next decade?" Ignoring digital performance is a grave strategic error.
Significant variations in digital performance are emerging across U.S. financial institutions, highlighting the critical role of technology investment in maintaining competitiveness. Recent analysis from Alkami reveals a widening gap between smaller regional institutions and the megabanks or fintechs in adopting new digital capabilities. The strategic bets being placed on technology and customer experience today are creating a digital divide that will define future profitability. You can review a detailed breakdown of this trend and learn more about their findings on digital banking performance.
Key Digital Metrics for the Executive Dashboard
To gain a clear view of the institution's future trajectory, leadership must track a new set of vital signs that draw a direct line between digital activity and financial outcomes.
1. Digital Customer Acquisition Cost (CAC) This is the total sales and marketing cost required to acquire a new customer through digital channels. A low and stable digital CAC signifies a powerful, scalable growth engine. For example, if $100,000 in digital marketing last quarter generated 500 new online checking accounts, the digital CAC is $200. The critical question is: how does this compare to the branch acquisition cost?
2. Channel Adoption and Engagement Rates What percentage of customers actively use the mobile app or online portal? A bank with 70% mobile adoption operates a fundamentally more efficient model—with far greater opportunities for engagement—than a bank at 40%. High engagement is a strong leading indicator of customer loyalty and lower churn.
3. Customer Lifetime Value (CLV) by Channel This metric is crucial. By segmenting CLV based on acquisition channel, a bank might discover that digitally-acquired customers have a 15% higher lifetime value due to greater product usage and lower servicing costs. This data enables surgical allocation of marketing capital, concentrating resources on the most profitable channels. Understanding the nuances of digital transformation in finance is essential to maximizing this advantage.
By integrating these forward-looking digital indicators with traditional banking metrics, executives can construct a more complete and accurate picture of their institution's health and competitive position. This is where a platform like Visbanking becomes indispensable, allowing you to dynamically benchmark your bank against relevant peers across both traditional and emerging metrics, turning data into a decisive strategic advantage.
Using Peer Benchmarking for Competitive Advantage
Isolated banking performance metrics are little more than numbers on a spreadsheet. They provide a score but reveal nothing about the competitive environment.
When placed in the context of direct competitors, however, these same numbers transform into sharp, strategic intelligence. This is the power of sophisticated peer benchmarking—a practice that moves beyond vanity comparisons to uncover true competitive advantages and vulnerabilities.

Comparing a community bank’s Return on Assets to that of a global money-center bank is a meaningless exercise. Their business models, risk profiles, and regulatory landscapes are fundamentally different.
The key is to create curated, relevant peer groups that provide a true apples-to-apples comparison. This is how effective leaders validate strategy and set performance targets that are both ambitious and achievable.
Defining a Relevant Peer Group
Effective benchmarking begins with precision. The goal is to compare your institution against others navigating similar market conditions with similar resources. A valid peer group is defined by specific, shared characteristics.
Key filtering criteria include:
- Asset Size: Grouping banks within a tight asset range (e.g., $1B - $3B) ensures comparison against institutions with comparable scale and operational complexity.
- Geographic Footprint: A bank in a high-growth urban market faces different challenges than one in a stable rural community. Geography is a critical variable.
- Business Model: Comparing a commercial-focused bank to one specializing in consumer mortgages leads to flawed conclusions. Alignment by primary business lines is essential.
A well-constructed peer group acts as a control group for your strategic experiments. It filters out the noise of market-wide trends, allowing you to isolate whether your specific strategies are outperforming or underperforming those of direct competitors.
By using a data intelligence platform to build these custom groups, executives can move beyond generic industry averages to a specific, contextual understanding of their performance. This precise approach is fundamental to a robust bank peer group analysis, which turns broad data into a targeted strategic tool.
From Benchmarking Data to Strategic Action
Once a relevant peer group is established, the real work begins: spotting performance gaps and diagnosing the root causes. This is how a generic metric is transformed into a targeted operational or strategic initiative.
Imagine a bank with $2 billion in assets reviewing its latest performance. Internally, a 3% annual loan growth rate seems adequate. However, when benchmarked against its custom peer group, the executive team discovers the peer average is 5%. That 2% gap immediately flags an area of underperformance requiring investigation.
Drilling deeper with a platform like Visbanking, the team finds the shortfall is concentrated in commercial real estate (CRE) lending. While their bank’s CRE portfolio grew by only 1%, its peers are averaging 6% growth in the same category. This is a specific, benchmarked insight that demands action.
The leadership team can now ask pointed, data-driven questions:
- Are our underwriting criteria for CRE loans too restrictive compared to the market?
- Does our business development team lack the necessary expertise or incentives?
- Are competitors offering more attractive terms or a faster approval process?
An Example of Benchmarking in Practice
This hypothetical comparison illustrates how benchmarking transforms a high-level observation into a specific strategic inquiry.
Hypothetical Peer Benchmarking for CRE Loan Growth
| Metric | Your Bank's Performance | Peer Group Average | Strategic Implication |
|---|---|---|---|
| Overall Loan Growth | 3.0% | 5.0% | We are lagging the market in loan origination. |
| CRE Loan Growth | 1.0% | 6.0% | The primary source of underperformance is the CRE segment. |
| NIM on CRE Loans | 3.25% | 3.15% | Our pricing is strong; the issue is likely volume, not profitability. |
This analysis pinpoints the problem. The bank isn’t losing on price; it’s losing on volume in a key asset class where its competitors are succeeding.
The conversation immediately shifts from a vague concern about "slow growth" to a focused strategy session on improving the CRE lending process, market strategy, or personnel. This is how top-performing banks use benchmarking to sharpen their competitive edge.
To compete effectively, you must know where you stand. Visbanking empowers executives to build these precise peer groups on the fly, benchmark dozens of key banking performance metrics, and uncover the actionable insights needed to drive superior results.
A Little Q&A for Bank Executives
Effective leadership requires a firm command of the numbers that drive the business. Here are direct answers to the questions most frequently posed by bank executives.
What is the single most important metric?
There is no single "north star" metric. Attempting to manage a complex financial institution through one indicator creates massive strategic blind spots.
An exclusive focus on the Efficiency Ratio will inevitably stifle crucial investments in technology. Chasing a high Return on Equity (ROE) at all costs may lead to excessive and dangerous leverage.
Sound, defensible decisions require a balanced scorecard of core banking performance metrics across the four pillars: Profitability, Asset Quality, Liquidity, and Efficiency. A holistic view, particularly when benchmarked against relevant peer data, is the only responsible approach.
How do these metrics create shareholder value?
The connection between daily operational metrics and Total Shareholder Return (TSR) is direct. Consistent, superior operational performance builds investor confidence, which in turn drives valuation.
The relationship can be broken down as follows:
- Profitability (ROA, ROE): This is the engine of value creation. Strong profitability directly fuels earnings per share and the capacity for dividends.
- Asset Quality (NPL Ratio): A low Non-Performing Loan ratio signals disciplined risk management, reducing the market's perception of risk and lowering the cost of capital.
- Efficiency Ratio: This metric demonstrates operational discipline. It shows an ability to convert revenue into profit, a quality highly valued by the market.
Consider this: improving an efficiency ratio from 65% to 60% drops an additional $5 from every $100 in revenue directly to the bottom line. That is a direct boost to earnings and, ultimately, shareholder returns.
Effective governance is not merely ensuring that management hits its metric targets. It is ensuring those metrics translate into sustainable, long-term shareholder value. The board's role is to relentlessly challenge the story behind the numbers.
Can we identify risks before they impact the P&L?
Yes, but not by looking in the rearview mirror. Lagging indicators like the Non-Performing Loan (NPL) ratio confirm a problem that already exists. Proactive leaders use data to identify forward-looking signals before they impact earnings.
Trend analysis within the loan portfolio is one of the most powerful tools. For instance, a 15% quarter-over-quarter increase in 30-day delinquencies within a specific segment, such as auto loans, is a significant early warning. Those loans are not yet "non-performing," but the trend indicates that credit quality is deteriorating. Without intervention, it will impact earnings in subsequent quarters.
A platform that enables this level of granular analysis and peer benchmarking allows you to detect these subtle shifts before they become crises. It transforms data from a report card on the past into a guidance system for the future.
A true strategic edge comes from seeing how you stack up. The Visbanking platform gives you the power to build custom peer groups, benchmark dozens of key metrics, and turn a mountain of data into clear, decisive action. Find out what insights are hiding in your numbers by exploring our platform.
Related Articles

Visbanking Blog
Unveiling Insights: Exploring Performance Conditions of US Banks with Visbanking Banking Report Portal

Visbanking Blog
Bank Efficiency Ratio Explained: What 60% Really Means

Visbanking Blog
Outperform with Confidence: How Visbanking's Performance Tool Transforms Banking Strategy

Visbanking Blog
BIAS: Your Competitive Edge in Banking Data Driven Strategy

Visbanking Blog
Revolutionize Your Bank's Performance with BIAS: Unlocking the Future of Visual Banking Data

Visbanking Blog