Net Interest Margin in Banks: A Strategic Guide for Executives
Brian's Banking Blog
For a bank executive, one metric dictates performance above all others: net interest margin (NIM). It is the definitive measure of a bank's core profitability and operational discipline. Simply put, NIM is the spread between the income generated from assets like loans and the interest paid on liabilities like deposits.
A healthy NIM is the engine of shareholder value and strategic growth. A deteriorating one is a clear signal that the board must act.
Why Net Interest Margin Is Your Bank's North Star

Net interest margin is more than a line item; it is the ultimate scorecard of your institution's fundamental business model. It reflects the quality of your asset and liability management, the precision of your pricing strategy, and your board’s appetite for risk. In an industry where basis points translate directly to the bottom line, mastering NIM is not just important—it is imperative.
A consistently strong NIM signals to the market that leadership understands precisely which levers drive profitability. This confidence enhances stock valuation, provides capital for strategic initiatives, and builds resilience against economic downturns. Conversely, a compressing NIM is a leading indicator of strategic deficiencies that demand immediate board-level attention.
The Strategic Importance of NIM
This metric commands focus for several critical reasons:
- The Primary Profit Driver: For most community and regional banks, NIM constitutes the largest portion of revenue. It directly funds operations, technology investments, and talent acquisition.
- The Definitive Benchmark: NIM is the great equalizer, enabling direct performance comparison against peer institutions. It exposes where you lead and, more importantly, where you lag.
- An Inherent Risk Indicator: Abrupt shifts in NIM often serve as the first warning of unmanaged interest rate risk or deteriorating credit quality within the loan portfolio.
Consider the fundamentals. A community bank with a 3.45% NIM is fundamentally outperforming a competitor of the same size reporting 3.10%. That 35-basis-point advantage generates significant excess capital for reinvestment or distribution to shareholders.
For bank leadership, NIM isn't just data; it's a verdict on your strategy. It tells you whether your asset deployment and funding structure are creating value or eroding it.
Every major decision—from launching a new certificate of deposit special to reallocating the loan mix—must be evaluated through the lens of its impact on NIM. This is where data intelligence platforms like Visbanking provide a decisive edge. They enable you to model these strategic choices and benchmark their potential outcomes against the market in real time. Explore our data and see where you stand.
Breaking Down the Net Interest Margin Formula

To command your bank's profitability, you must look beyond the final NIM percentage and deconstruct its core components. The formula itself is straightforward, but the strategic levers it represents are profoundly powerful.
Net Interest Margin = (Interest Income - Interest Expense) / Average Earning Assets
This equation distills the entire business of banking into a single, measurable expression. It quantifies how efficiently a bank utilizes its earning assets to generate profit after accounting for the cost of funding those assets. Each variable is a dial that leadership can, and must, actively manage.
The Key Ingredients of NIM
To truly master net interest margin in banks, one must dissect its components. Each is a direct result of strategic decisions made by leadership.
- Interest Income: This is the revenue generated from the loan portfolio and investment securities. The composition of these assets is critical. High-yield commercial and industrial (C&I) loans, consumer credit, and residential mortgages possess distinctly different return profiles. Similarly, the securities portfolio—whether dominated by Treasury bills or municipal bonds—is a key contributor.
- Interest Expense: This is the cost of funds. It encompasses all interest paid on deposits, from non-interest-bearing checking accounts to high-yield CDs. It also includes the cost of borrowings from sources like the Federal Home Loan Bank (FHLB).
- Average Earning Assets: This is the denominator and represents the bank's core engine. It includes all assets that generate interest, primarily the loan and investment portfolios. Non-earning assets, such as cash reserves or physical bank properties, are excluded.
A Practical Application
Consider a hypothetical $2 billion commercial bank seeking to improve its NIM.
The executive team identifies an opportunity within its balance sheet. They authorize a strategic reallocation of $100 million from a low-yield municipal bond portfolio (earning 2.5%) into higher-yield C&I loans averaging a 6.0% return. This single action increases annual interest income by $3.5 million.
Simultaneously, a targeted CD campaign designed to secure stable funding increases annual interest expense by $1.5 million. The net result is a $2 million increase in net interest income (the numerator). Assuming average earning assets remain constant, this decisive strategic shift directly expands the bank's NIM.
This example illustrates the interconnectedness of balance sheet decisions. Every choice regarding assets and liabilities has a direct, quantifiable impact on margin. Tracking these components is not an accounting exercise; it is a strategic imperative.
Data intelligence platforms like Visbanking allow you to model such scenarios and benchmark your component-level performance against a curated peer group. This process turns raw data into actionable intelligence by pinpointing exactly where asset yields or funding costs deviate from the market. Explore our data to analyze your balance sheet's true performance.
The Core Forces That Shape Your Bank's NIM

Calculating NIM is foundational. True strategic mastery comes from understanding the forces that influence it. For any bank executive, three drivers demand constant vigilance: Monetary Policy, Asset & Liability Management (ALM), and Credit Risk.
These are not abstract concepts; they are the active currents shaping your institution's profitability.
The most significant external driver is monetary policy, specifically the actions of the Federal Reserve. A rising-rate environment can be either a powerful tailwind or a significant headwind, depending entirely on the structure of your balance sheet.
Asset and Liability Management in Action
Your ALM strategy is the playbook for navigating monetary policy shifts. The central question is whether your bank is asset-sensitive or liability-sensitive.
- An asset-sensitive bank holds more assets (e.g., variable-rate commercial loans) that reprice faster than its liabilities (e.g., fixed-rate CDs). In a rising-rate environment, interest income increases more rapidly than interest expense, causing NIM to expand.
- A liability-sensitive bank has the opposite structure. Its liabilities reprice faster than its assets, causing margin compression as rates rise.
Imagine a $3 billion asset-sensitive community bank. As the Fed initiates a rate-hiking cycle, the bank’s significant portfolio of commercial loans tied to the prime rate resets higher, immediately boosting interest income. Meanwhile, its substantial base of low-cost core deposits reprices much more slowly.
This widening spread between asset yields and funding costs directly translates to profit. Effective ALM is not a passive exercise; it is the active structuring of the balance sheet to optimize performance in any rate environment. For further analysis, see our guide on managing interest rate risk.
The Critical Role of Credit Risk
Credit risk is priced directly into your NIM. A loan portfolio dominated by high-quality, super-prime mortgages will inherently produce lower yields and a tighter margin. Conversely, a portfolio concentrated in small business or construction lending will carry higher yields to compensate for greater risk.
The objective is to strike an optimal balance.
Extending credit to higher-risk borrowers can significantly enhance NIM, but it must be done with a clear understanding of potential losses.
A 100-basis-point increase in credit risk spread has historically been linked to a 43-basis-point increase in NIM. It’s a perfect illustration of how banks price for higher default probabilities—the classic trade-off between taking on risk and expanding your margin.
This dynamic underscores why a deep, data-driven understanding of the risk embedded in your loan and deposit books is essential for sustaining a healthy NIM. The implementation of robust risk management frameworks is non-negotiable.
Historically, U.S. banks have maintained an average NIM around 3.5% by successfully navigating these forces, though significant compression occurred post-pandemic before a recent recovery.
These drivers are interconnected. Your credit risk appetite shapes your asset mix, which in turn determines your sensitivity to interest rate changes. Navigating this complexity requires more than a static report; it demands a comprehensive, forward-looking view of the entire balance sheet to proactively position your bank for future market shifts.
Benchmarking NIM To Reveal True Performance
An isolated net interest margin figure is meaningless. In fact, it can create a dangerously distorted view of performance.
A reported NIM of 3.50% may appear strong in a vacuum. But if your relevant peer group is averaging 3.85%, your institution is underperforming and leaving significant capital on the table. Performance is always relative. Therefore, rigorous benchmarking is not an option; it is a strategic necessity.
Effective benchmarking transcends simplistic comparisons by asset size. True strategic insight comes from measuring your bank against a curated peer group defined by shared characteristics: business model, geographic focus, and loan concentrations. The NIM of a money-center bank is structurally different from that of a regional institution or a community bank specializing in agricultural lending.
Beyond Static Peer Groups
Traditional, static quarterly peer reports are rearview mirrors. By the time they are analyzed, market conditions have already changed.
Modern data intelligence platforms like Visbanking fundamentally alter this dynamic. They empower leadership teams to construct dynamic, customized benchmarks on demand. This capability uncovers performance gaps and strategic opportunities that are invisible in broad industry aggregates.
To conduct any credible peer analysis, it's vital to have a solid grasp of the foundational financial statements. This knowledge also shines a light on how global economic forces can ripple down to local performance.
NIMs vary significantly across national economies, driven by factors such as economic structure, competitive intensity, and regulatory frameworks.
Global Net Interest Margin Comparison
This table illustrates the stark variation in NIM across different economic landscapes, underscoring the importance of local market context.
| Country | Average NIM (%) | Market Characteristics |
|---|---|---|
| Argentina | >10% | High-inflation environment |
| United States | ~2.77% | Competitive, developed economy |
| Australia | ~1.67% | Highly competitive, mature market |
Clearly, a "strong" NIM is entirely context-dependent.
The following chart illustrates how specific strategic decisions directly influence a bank's NIM.
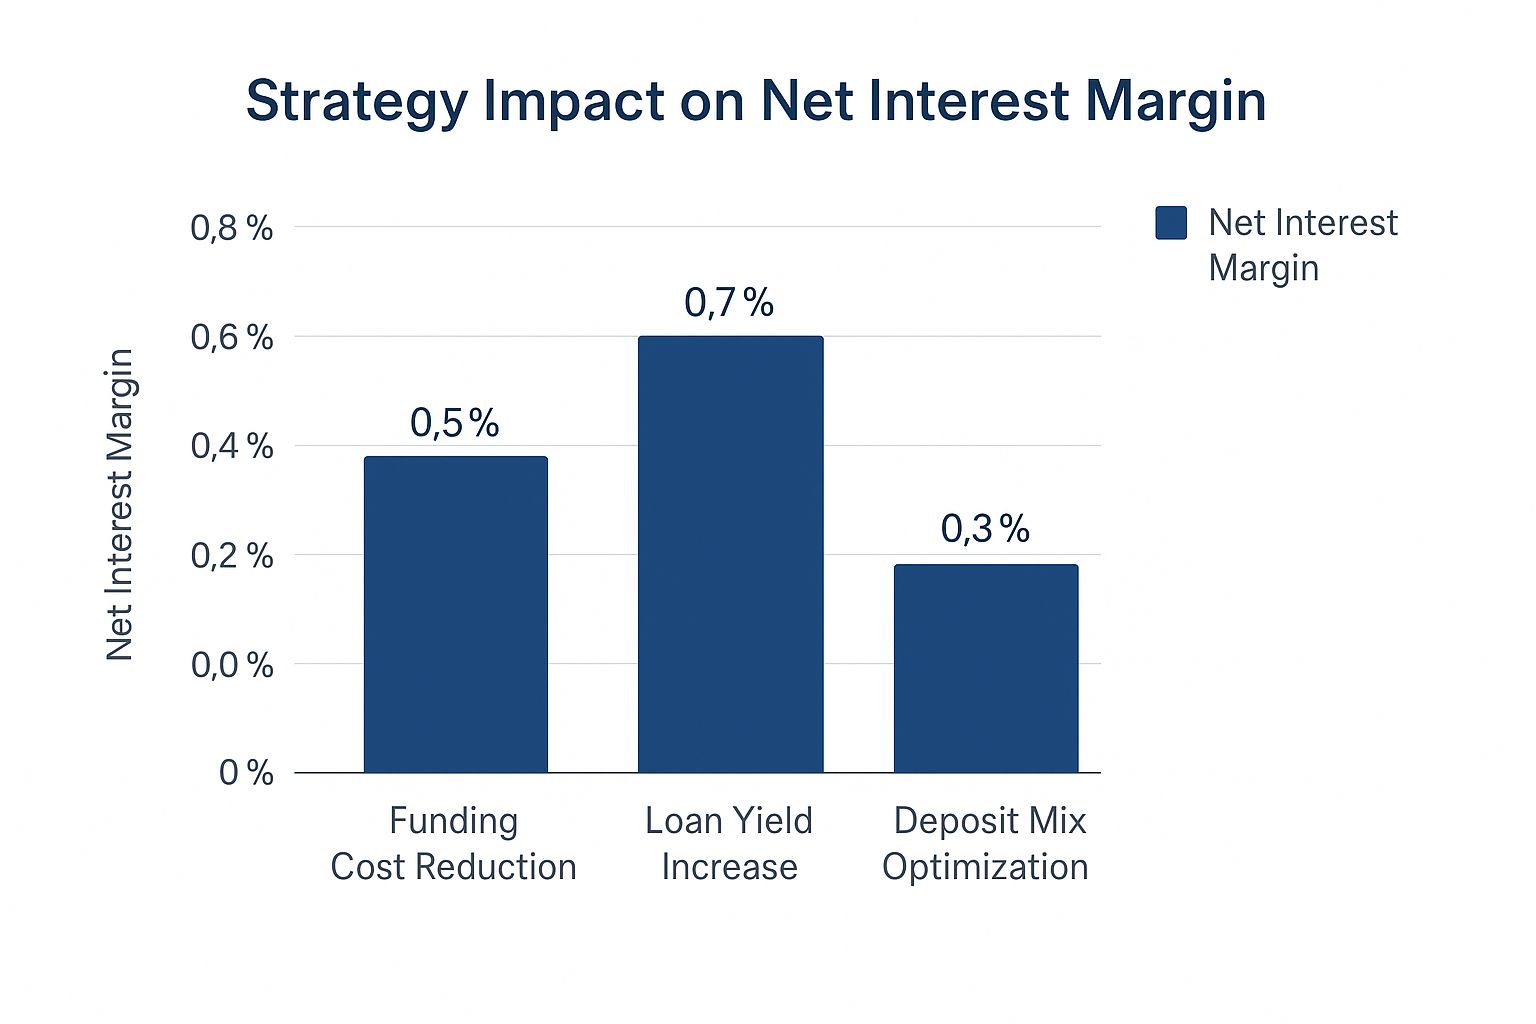
This visual demonstrates that while managing funding costs is crucial, the most powerful levers for margin expansion are often on the asset side of the balance sheet—specifically, strategic improvements in loan yields.
Benchmarking isn't about finding out who is "best." It's about understanding why other banks are performing differently and figuring out which of their strategies you can replicate and apply to your own institution.
This level of insight facilitates sharper, more strategic questions. Are our funding costs misaligned with our peers? Is our loan pricing sufficiently aggressive? How does our asset mix impact earning potential compared to top performers? You can track the latest net interest margin for all U.S. banks to begin building this critical context.
When you transition from reviewing vanity metrics to conducting meaningful, data-driven comparisons, you transform data from a passive report into an active tool for strategic execution.
Time to Put Your NIM Analysis to Work
Calculating your net interest margin is an exercise in accounting. Improving it is an exercise in leadership. Analysis without action is academic.
Optimizing NIM is not about a single solution but a disciplined, simultaneous focus on enhancing asset yields and controlling liability costs. This process must be guided by robust, forward-looking data that allows for scenario modeling, stress testing, and confident decision-making. The objective is to proactively shape market outcomes, not merely react to them.
Squeezing More Juice from Your Assets
Your asset portfolio is your bank's primary engine. Even marginal adjustments can have an outsized impact on NIM. The strategy is to shift into higher-yielding assets without assuming undue risk.
Two primary levers exist:
- Strategic Loan Portfolio Management: This is the most direct path to increasing interest income. It involves a methodical reallocation of capital from lower-earning assets (e.g., low-rate investment securities) into higher-return loans. For example, a deliberate strategy to expand the commercial and industrial (C&I) loan portfolio typically delivers superior yields and deeper client relationships compared to a portfolio over-weighted in municipal bonds.
- Intelligent Duration Management: Within the investment portfolio, you must anticipate interest rate movements. If rates are expected to rise, shortening duration allows for faster reinvestment of maturing assets into new, higher-yielding instruments. This is not based on intuition; it requires a clear, data-driven view of monetary policy trajectory.
History demonstrates that a rise in the federal funds rate does not guarantee a corresponding increase in bank NIMs. During the 2015-2018 tightening cycle, NIMs expanded by only 22% of the total rate increase. The reason: rising funding costs eroded gains on the asset side. This is a critical lesson in the importance of managing both sides of the balance sheet, as detailed in research from the Federal Reserve.
Driving Down the Cost of Your Liabilities
If asset strategy is offense, liability management is defense. It is about disciplined cost control. The most consistently profitable banks are masters of attracting and retaining low-cost, stable funding.
The foundation of a strong net interest margin is a fortress-like deposit base. A bank that relies excessively on volatile, high-cost wholesale funding will always be at a disadvantage.
Key strategies include:
- Prioritize Core Deposits: The acquisition of non-interest-bearing and low-interest checking and savings accounts must be a perpetual strategic priority. These funds provide a stable, low-cost anchor that defends margins during periods of rising rates.
- Price Deposits Surgically: Avoid across-the-board rate changes. Leading banks use data to make precise pricing decisions. This may involve offering a premium rate on a specific product or to a targeted client segment to attract new funds without repricing the entire deposit book.
- Maintain Discipline with Wholesale Funding: Instruments like brokered deposits or FHLB advances serve a tactical purpose for managing liquidity but should not be a core funding strategy. These sources are highly rate-sensitive and can rapidly erode margins.
For instance, a $5 billion bank observes that non-interest-bearing deposits constitute only 20% of its funding base, while its peer average is 23%. By launching a targeted campaign aimed at business banking clients, it successfully increases these zero-cost funds by 3%. This single strategic initiative could expand NIM by 10 to 15 basis points—a significant and sustainable competitive advantage.
Executing these strategies requires a precise understanding of your competitive position. A platform like Visbanking enables you to benchmark your deposit mix, loan yields, and funding costs against any peer group, transforming broad objectives into concrete, measurable actions. Explore our data and identify the most powerful levers for your bank’s NIM.
The Future of NIM: Staying Ahead in a Data-Driven World
Monitoring your bank's net interest margin is not a quarterly task; it is a continuous strategic discipline. The mandate is clear: sustained profitability requires a deep understanding of your margin, rigorous benchmarking against relevant peers, and decisive action on both sides of the balance sheet. In today's market, inaction guarantees underperformance.
Looking ahead, margin pressure will intensify. Fintech competitors, unencumbered by legacy systems, are systematically disaggregating the traditional banking model. Evolving customer behaviors are making low-cost funding more difficult to acquire and retain. To compete and win, banks must leverage data with far greater sophistication.
Turning Complexity Into Your Competitive Edge
Success is no longer defined by analyzing historical performance. It is about anticipating and shaping future outcomes. This requires a shift from static reports to dynamic intelligence platforms that can model the impact of a decision before it is made.
The next frontier of margin enhancement belongs to the banks that can convert vast amounts of market and internal data into sharp, actionable intelligence. Leaders who master this capability will build a formidable competitive advantage.
This is about asking more sophisticated questions. What is the projected six-month NIM impact of a 25-basis-point change in our deposit beta? Which specific loan categories offer the best risk-adjusted return relative to our peer group? These questions cannot be answered by intuition; they require a robust framework for banking data analytics.
The New Mandate for Bank Leadership
For today's bank executives, the mission is to build an organization that operates on data-driven insights. Every strategic decision—from pricing a commercial loan to approving a deposit campaign—must be informed by a clear-eyed analysis of its effect on net interest margin. This is the transition from a defensive, reactive posture to an offensive, market-shaping strategy.
The first step is always to know precisely where you stand. How does your institution truly compare to its peers? Where are the untapped opportunities for margin expansion on your balance sheet? Answering these questions with precision is the foundation of any winning strategy. The tools to find these answers are no longer a luxury; they are table stakes for modern bank leadership.
At Visbanking, we provide the Bank Intelligence and Action System that empowers executives to move from dashboards to decisive action. See how your institution stacks up and identify your most promising paths to margin enhancement. Explore our data and platform today.
Related Articles

Visbanking Blog
Net Interest Margin for all U.S. Banks 2025

Visbanking Blog
Top Banks by Net Interest Margin (NIM)

Visbanking Blog
Net Interest Margin Secrets: How Top Banks Maximize Profits

Visbanking Blog
Capital Banking in the USA: An Overview of Investment Services, Financial Instruments, and Regulations

Visbanking Blog
How Bank Efficiency Ratios Reveal Hidden Operational Costs

Visbanking Blog