
What Is Repricing Risk: A Bank Executive's Guide
Brian's Banking Blog
Repricing risk is the exposure that arises when a bank's assets and liabilities reset their interest rates at different times or by different amounts, potentially compressing net interest income even when the overall balance sheet appears stable. Historically, average bank assets repriced in approximately 4.5 years while liabilities repriced in less than 5 months, leaving many institutions economically liability-sensitive (Federal Reserve research).
That mismatch is usually invisible while rates are stable. It becomes visible when deposit pricing moves faster than loan yields, customers migrate into higher-rate products, or a fixed-rate lending book remains locked while funding costs reset. Bank executives shouldn't treat repricing risk as a quarterly ratio to review and archive. It is a forward-looking earnings signal, and its value depends on whether management can connect the signal to specific products, customers, and decisions.
When Funding Costs Rise Before Yields Catch Up
A mid-size bank enters a rapid tightening cycle with a substantial portfolio of fixed-rate mortgages. The mortgages continue earning their contractual yields, while certificates of deposit and money-market accounts begin repricing upward within months. The balance sheet hasn't changed in size, but the income statement starts to deteriorate because the cost of funding moves before asset income does.
That is the practical meaning of repricing risk. The exposure affects assets, liabilities, and off-balance-sheet positions whose rates reset at different times or by different amounts. If liabilities reprice upward before assets, funding costs rise faster than asset yields and compress net interest income. If assets reprice downward first, income can fall while liability costs remain high. The direction of the rate move matters, but the timing asymmetry often determines the immediate earnings result.

The balance sheet can look stable while margin weakens
Executives often see stable total assets, stable liabilities, and no obvious deterioration in credit quality. Those figures don't reveal how quickly each account reprices. A five-year fixed-rate loan funded by a one-year certificate of deposit carries a different earnings profile from a floating-rate loan funded by a stable, low-cost deposit.
The Federal Reserve study found that the average repricing or maturity gap generally fluctuated between 3 and 5 years, reinforcing that the mismatch was a recurring structural feature rather than a temporary anomaly (Federal Reserve study of U.S. banking institutions). The same research reported standard deviations of nearly 2 years for asset repricing and about 2.5 months for liability repricing. Those figures explain why funding competition can reach the income statement before a bank has time to reposition its loan book.
Practical rule: A stable balance-sheet total tells you almost nothing about near-term margin resilience. Review the reset path of the balances inside it.
The first management question is not just whether the bank is asset-sensitive or liability-sensitive. It is which products create that position, when their rates move, and whether customers behave according to the contractual assumptions. A disciplined review of cost of funds for banks should sit beside the repricing schedule, not in a separate reporting process.
Executives evaluating broader portfolio exposures can also use Finzer's guide to assessing portfolio risk factors as a complementary framework. The key is to keep the analysis tied to earnings. Repricing risk becomes consequential when a timing mismatch changes funding costs, loan yields, or both.
How Repricing Risk Works Under Basel and OCC Guidance
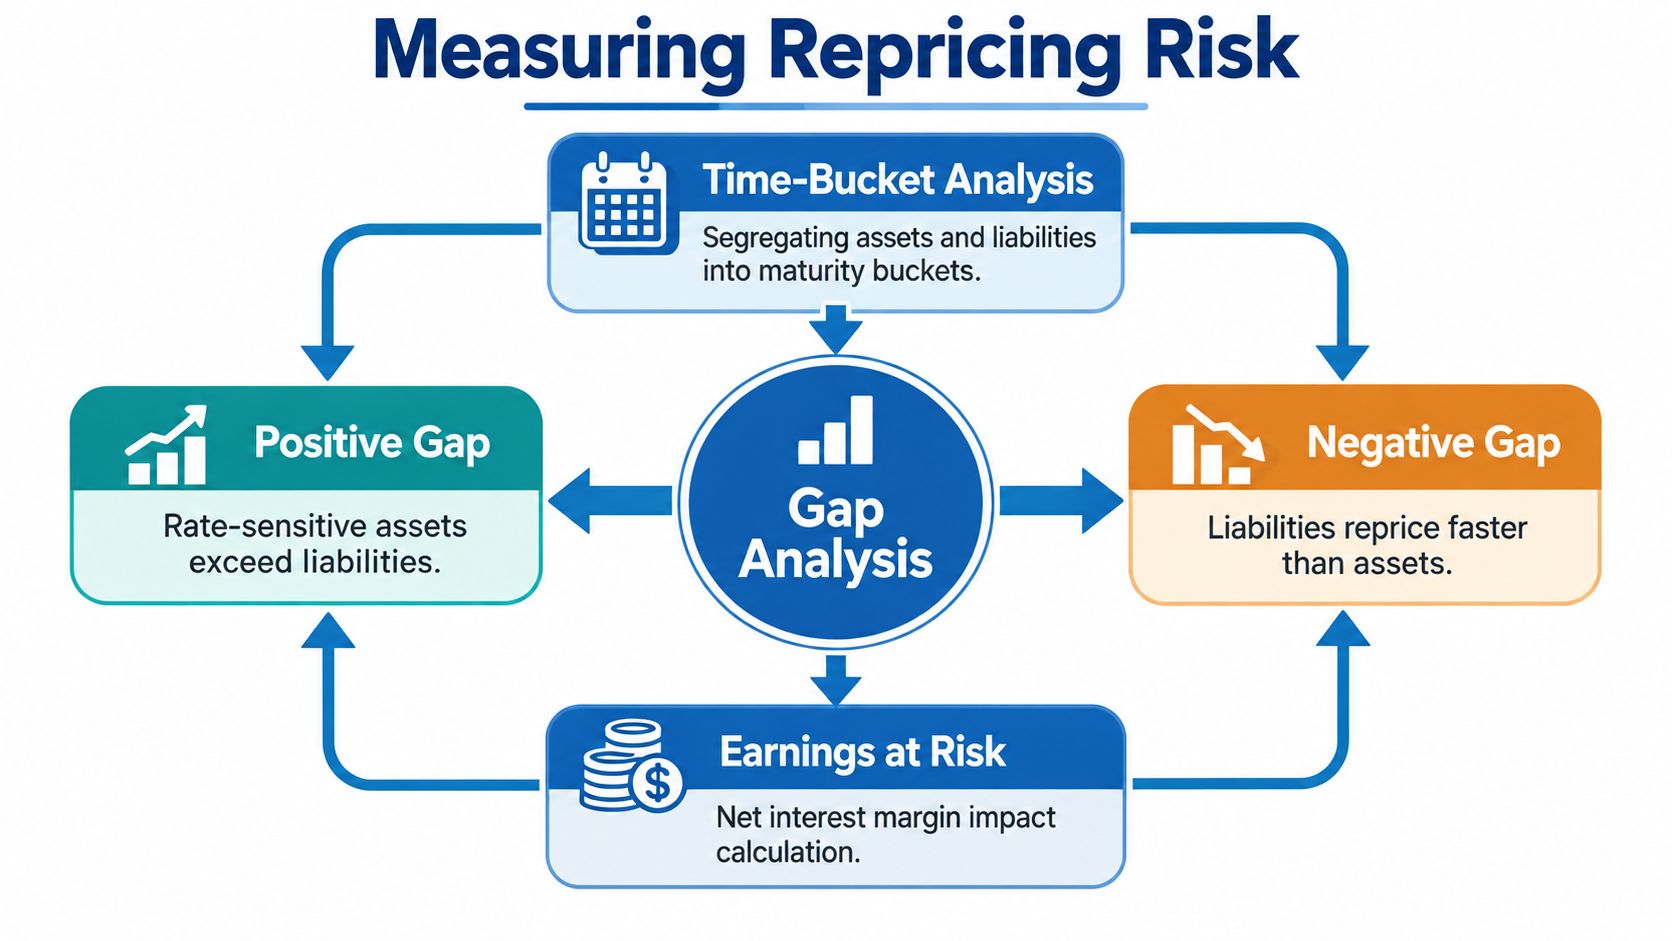
Basel's gap framework converts repricing risk into an earnings signal. The bank assigns interest-sensitive assets and liabilities to time buckets based on their next contractual reset date, then compares the two balances:
Repricing gap = rate-sensitive assets, RSA, minus rate-sensitive liabilities, RSL.
A positive gap means more assets than liabilities reprice within that horizon. The bank is asset-sensitive, so rising rates may increase earnings while falling rates may reduce them. A negative gap means more liabilities reprice, making the bank liability-sensitive for that horizon. Neither position is automatically favorable. The effect depends on the rate path, balance-sheet composition, and assumptions applied to the underlying products.
The math is useful, but only within its assumptions
Basel guidance permits an estimate of net interest income sensitivity by multiplying each bucket's gap by an assumed rate movement (Basel supervisory framework). Consider a bank with USD 100 million more liabilities than assets repricing within three months. A 100-basis-point increase would create approximately USD 250,000 of annualized margin pressure before behavioral effects, hedging, and balance-sheet changes.
The same mismatch could support earnings if rates declined. Management therefore needs scenarios covering rising, falling, parallel, and non-parallel yield-curve movements.
| Position in a time bucket | Rate-sensitive balance | Likely effect when rates rise |
|---|---|---|
| Positive gap | Assets exceed liabilities | Earnings may increase |
| Negative gap | Liabilities exceed assets | Earnings may decline |
| Balanced gap | Assets and liabilities are broadly aligned | Other risks may dominate |
Gap limits control the size of the mismatch, while other rate exposures can still affect results through basis risk, yield-curve shifts, and embedded options such as deposit withdrawals or loan prepayments (OCC interest-rate-risk guidance).
What directors should demand from ALCO reporting
A useful ALCO package should show cumulative gaps by horizon, projected net interest income sensitivity, economic-value sensitivity, and the rate assumptions behind each result. A single positive or negative figure without product detail creates false confidence.
A disciplined review of bank asset liability management should sit alongside the gap report. The analysis should identify the deposit category, loan repricing cohort, derivative position, or contractual feature driving the result. It should also show which behavioral assumption has the greatest earnings impact and whether observed customer behavior supports it.
That level of detail turns a headline gap into a forward-looking commercial signal. It can show where deposit migration, pricing pressure, or slower asset repricing will reach margin first, giving ALCO and business leaders a clear basis for prioritizing action.
Why Contractual Reset Dates Often Mislead Bank Leaders
Contractual repricing dates are clean. Customer behavior isn't. A nonmaturity deposit may have no contractual maturity, yet customers can move balances or demand higher rates when competitors become more aggressive. A mortgage may have a contractual yield, but refinancing and prepayments can shorten the asset's effective duration when rates fall.
Basel distinguishes gap risk, the timing difference in rate changes, from option risk, which arises when the bank or customer can alter the level or timing of cash flows (Basel framework on gap and option risk). That distinction matters because contractual schedules can understate the speed at which deposits reprice or assets run off.
Deposit betas are an earnings variable
A deposit beta measures the percentage of a market-rate change passed through to depositors. Suppose USD 50 million of floating-rate loans reset monthly with a 1.00% contractual floor, while USD 50 million of money-market deposits pass through 70% of a market-rate increase. If market rates rise 200 basis points from a level above the loan floor, loan income increases by approximately USD 1.00 million annually, while deposit expense rises by approximately USD 700,000. The resulting contribution is approximately USD 300,000 before other effects (FDIC repricing-risk guidance).
If pass-through accelerates to 100%, that benefit disappears. The contractual reset dates haven't changed. The earnings result has changed because the magnitude of repricing changed.
APRA requires assumptions when contractual repricing dates differ materially from actual repricing behavior, and its guidance recognizes basis risk when economically similar instruments adjust imperfectly. Banks should therefore back-test assumed and realized repricing, segment deposits by product and customer type, and stress-test deposit outflows alongside rate shocks.
Product mix can matter more than the headline gap
A modest aggregate gap can still conceal pressure from high-balance customers migrating out of noninterest-bearing accounts. Loan floors can prevent asset yields from falling as quickly as market rates, while new lending may be booked at thinner spreads. These effects can move earnings without producing an obvious change in the headline repricing ratio.
A contractual schedule is a map of obligations. Behavioral data is the terrain management actually has to navigate.
Bank leaders should monitor observed deposit pricing, product substitution, prepayment rates, and peer behavior. If the model assumes stable balances while customers are moving into higher-yield products, the model isn't conservative. It is wrong.
Turning Repricing Gaps Into Earnings Forecasts
A repricing report earns its place in ALCO when it forecasts earnings and assigns management an action. Start with the cumulative gap, then identify the accounts, customers, and balance-sheet decisions that could change net interest income before the next reporting period.
A commercial loan portfolio with a negative near-term gap may look manageable in aggregate, while renewal dates cluster within one market or relationship segment. A deposit portfolio may appear stable until high-balance commercial accounts shift from noninterest-bearing products into interest-bearing alternatives. The headline ratio is only the starting point.
Build the forecast around decisions
A decision-ready workflow should connect repricing buckets to five operating views:
- Product: Separate certificates of deposit, money-market accounts, nonmaturity deposits, fixed-rate loans, floating-rate loans, and securities.
- Customer segment: Test whether behavior differs across commercial, consumer, municipal, and institutional relationships.
- Geography: Locate concentrations where competitors may be changing prices or local funding conditions differ.
- Renewal calendar: Flag loans and deposits approaching repricing or renewal.
- Recent balance behavior: Detect migration, runoff, new money, and changes in account mix.
This structure converts a static ALCO metric into an early-warning process. Relationship managers can identify accounts most likely to raise funding costs. Treasury can assess pricing, hedging, and balance-sheet responses. Directors can distinguish observed customer behavior from an outdated model assumption.
Behavioral data is the terrain management has to work with, not the map of obligations provided by the contract schedule. Visbanking-style bank intelligence can connect those observations to commercial-prioritization workflows, so teams can focus on affected products, relationships, and renewal events.
Test the model instead of defending it
As noted earlier, Federal Reserve research shows why deposit behavior belongs in the forecast rather than in a footnote. Liabilities can adjust faster than fixed-rate assets, creating an asymmetric earnings exposure. Deposit betas, nonmaturity-deposit decay assumptions, and product substitution therefore require direct testing.
Project net-interest-income sensitivity under parallel and nonparallel rate shocks. Compare those projections with realized account-level pricing, balances, and product changes. When actual behavior diverges from the assumption, alert the owners of the affected products and relationships, then revise the forecast or the underlying commercial response.
Model testing should end with a documented decision: recalibrate the assumption, change pricing or product strategy, or apply greater stress to the affected balance. A gap that cannot survive account-level back-testing is not a reliable earnings forecast.
Practical Monitoring and Mitigation Strategies for Bank Executives
Executives need a repeatable control process, not another dashboard. Three practices deserve immediate attention.
1. Back-test behavioral assumptions
Compare assumed and realized deposit betas, balance retention, repricing speed, and loan prepayments. Segment the results by product and customer type rather than averaging the entire deposit base.
Trigger: Actual repricing consistently differs from the model assumption.
Decision: Recalibrate the assumption, change the product strategy, or increase the stress applied to the affected balance.
Outcome: Forecasts reflect observed behavior rather than historical convenience.
2. Maintain instrument-level visibility
Track contractual floors, loan spreads, repricing dates, renewal calendars, and deposit pricing. A gap ratio won't tell management whether a loan floor is preventing yields from falling or whether a deposit segment is passing through more of a market-rate move than expected.
The OCC expects banks to maintain systems that identify and quantify major sources of interest-rate risk and measure earnings-at-risk under changing rate environments (OCC risk-management guidance). That requirement supports a practical standard: every material scenario result should be traceable to instruments and assumptions.
3. Benchmark exposure against peers
Trend analysis helps directors distinguish an institution-specific problem from a broader market movement. Compare funding costs, deposit mix, asset yields, and repricing trends across relevant peer institutions, then investigate material divergence.
Visbanking's Bank Performance stream supports peer benchmarking and historical trend analysis across 4,600+ institutions, while its Bank Intelligence capabilities provide automated alerts when observed behavior diverges from model assumptions. Those functions can support a workflow in which treasury, finance, relationship management, and directors receive the same evidence and act on the same signal.
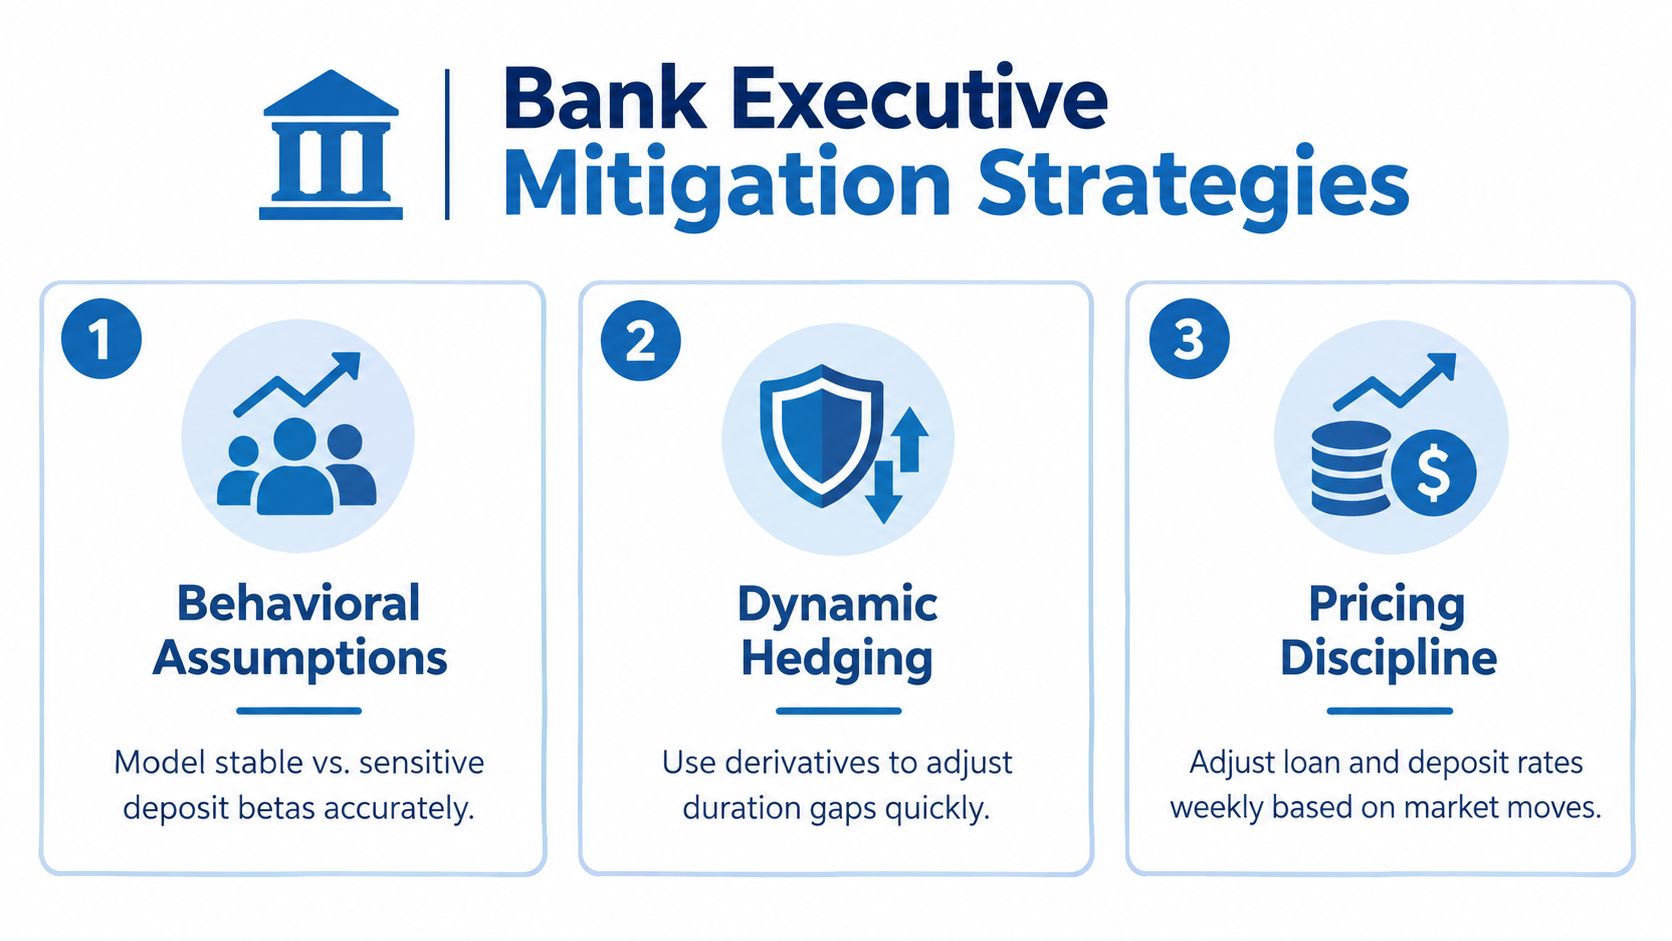
The decision rule should be simple. If peer data shows the bank's deposit pricing or funding mix moving unfavorably, management should review pricing discipline, hedge positioning, and relationship-level retention plans before the gap becomes an income-statement problem. Managing interest-rate risk requires that feedback loop.
Why Aggregate Gap Limits Are Not Enough
An aggregate gap limit controls exposure, but it does not show where earnings pressure will emerge. It combines products with different benchmarks, floors, customer behavior, renewal schedules, and prepayment patterns. Use the limit as a control threshold, not as the bank's earnings explanation.
Directors need a traceable earnings story. Require management to answer four questions:
- Which instruments reprice in each horizon?
- Which behavioral assumptions drive the result?
- Which customer or product segments create the exposure?
- What management action would change the forecast?
A report that cannot answer these questions measures imbalance without providing control. Require instrument-level repricing dates, contractual floors, deposit assumptions, scenario results, and variance reports that compare modeled behavior with realized outcomes.
The analysis should also connect directly to decisions. If customers are migrating from stable deposits into higher-beta products, relationship managers may need retention actions for valuable accounts. Treasury may need to change hedges or funding composition. Lending may need to reset renewal pricing. Finance may need to revise the earnings forecast. A single gap figure cannot assign those actions or show their expected effect.
The bank's test is simple: can management trace a projected margin change from an assumption, to an affected segment, to an earnings result, and then to an accountable decision? If not, the dashboard is reporting exposure without creating control.
Visbanking combines peer benchmarking, trend analysis, and bank intelligence to surface repricing signals beneath aggregate balance-sheet figures. Its workflow can help teams compare funding and asset trends, investigate changes in customer behavior, and prioritize actions before a gap becomes an income-statement problem. Visit Visbanking to examine those signals and connect repricing risk with management decisions.
Latest Articles

Brian's Banking Blog
How to Manage Vendor Relationships in Banking

Brian's Banking Blog
ISO 20022 Migration Strategy for Bank Leaders

Brian's Banking Blog
Lead Tracking Software for Banks: An Executive Guide

Brian's Banking Blog
What Are Key Metrics for Banks? a Decision Guide

Brian's Banking Blog
Customer Feedback Surveys: A Playbook for Banks

Brian's Banking Blog