
Commercial Lending Trends: What Bank Executives Must Know
Brian's Banking Blog
The latest U.S. commercial lending data point to a recovery that many bank dashboards may be misreading. C&I loan growth reached an annualized 7.7% in the third quarter of 2025, yet the reported loan stock in October 2025, approximately $2.693 trillion, remained below the $2.785 trillion reported a year earlier. (Federal Reserve C&I data) That apparent contradiction is the central management issue: inquiries, approved commitments, and funded balances measure different stages of borrower demand.
For bank executives, commercial lending trends matter less as a headline than as a decision system. A stronger pipeline can coexist with tighter underwriting, a stable funded book can conceal falling approval rates, and portfolio growth can mask erosion among smaller borrowers. The institutions that separate those signals will price risk more accurately, direct relationship coverage more effectively, and identify credit deterioration before it becomes visible in aggregate results.
The 2026 Commercial Lending Cycle in Numbers
U.S. commercial and industrial lending has moved from emergency liquidity demand to a measured recovery. After a 2020 draw, a 2021 unwind, and a 2022 surge, growth was nearly flat through 2024 before annualized growth reached 5.5% in the second quarter of 2025 and 7.7% in the third quarter. The reported stock was approximately $2.69 trillion in September 2025 and $2.693 trillion in October 2025, below the $2.785 trillion recorded in October 2024. The latest Federal Reserve release provides the series context. (Federal Reserve H.8 release)
The sequence marks a recovery in flow, not necessarily a full recovery in balances. Earlier movements reflected businesses drawing revolving facilities during the COVID-19 shock, repaying emergency borrowing, and later financing higher working-capital requirements amid inflation and tighter monetary conditions. That history matters because the same growth rate can arise from very different borrower behavior.
The headline recovery needs disaggregation
Executives should use the growth rate as a starting signal. Aggregate C&I balances can increase through deeper utilization by existing customers, new relationships, refinancing activity, extended maturities, or sector-specific working-capital demand. Those outcomes differ in credit quality, pricing power, capital consumption, and expected duration.
A management dashboard should separate four dimensions:
- Borrower industry: Show whether growth comes from resilient operating sectors or exposures with correlated risks.
- Loan purpose: Distinguish working capital, acquisition financing, refinancing, and fixed investment. Purpose indicates whether demand is defensive, opportunistic, or linked to expansion.
- Maturity profile: Separate durable relationship growth from short-dated facilities that can reprice or run off quickly.
- Institution and segment: Compare large, middle-market, small-business, and very small-business performance instead of relying on one portfolio total.
The key decision is whether funded growth reflects durable demand or temporary utilization. A bank gaining balances from stressed borrowers may need more capital and tighter pricing, while a bank winning investment financing may be building longer-term relationships.
Practical rule: A rising balance does not establish stronger commercial franchise health. Management should identify which borrowers are drawing, why they need funds, how long usage is likely to persist, and whether pricing compensates for the risk.
The late-2025 acceleration therefore creates both an opportunity and a control requirement. Demand may be returning before the portfolio has regained its earlier level, but catch-up activity can look broader than it is. Before changing growth targets, a credit committee should compare inquiry volume with approval conversion and funded balances, then review utilization by segment and the terms required to win each relationship. That reconciliation shows whether the bank is capturing quality demand or merely accepting more risk to produce headline growth.
Why Inquiries, Approvals, and Funded Balances Tell Different Stories
A borrower inquiry is an expression of need. An approved commitment is a credit decision. A funded balance is the amount drawn. Treating these as interchangeable turns a lending pipeline into a misleading single number.
The Federal Reserve's April 2026 Senior Loan Officer Opinion Survey reported tighter C&I standards, while realized demand was broadly unchanged. Banks also reported a modest increase in inquiries for new credit lines or increases to existing lines. (Federal Reserve April 2026 SLOOS) The combination matters because stronger prospective demand can exist alongside lower approval conversion and slower funding.
Three measures, three management questions
Inquiries indicate that a borrower is considering additional liquidity. They can lead to a new line, an increase to an existing facility, a refinancing discussion, or no transaction at all. A rise in inquiries should prompt relationship managers to investigate purpose, urgency, collateral, and competitive context.
Approved commitments show that the bank has accepted a defined level of risk under specified terms. The gap between inquiries and approvals reveals underwriting friction. Pricing, covenants, collateral requirements, and approval capacity can all reduce conversion even when borrower interest remains steady.
Funded balances show utilization, not merely appetite. A borrower may secure a larger line but draw only part of it, or receive approval and delay funding because a transaction has not closed. Conversely, an old facility may remain funded even as the relationship weakens.
A practical pipeline view should therefore display:
| Signal | What it measures | Executive diagnostic |
|---|---|---|
| Inquiries | Prospective credit need | Is demand emerging in target segments? |
| Approved commitments | Accepted risk and offered capacity | Where are underwriting or pricing barriers reducing conversion? |
| Funded balances | Actual utilization | Are commitments producing assets and revenue? |
A flat funded portfolio can conceal a healthy inquiry pipeline that approval teams can't convert. It can also conceal a deteriorating credit environment if legacy balances remain outstanding while new approvals fall. Executives should review conversion and utilization by borrower size, industry, purpose, and relationship manager before concluding that demand is weak.
Segment-Level Lending Signals That Change the Sales Playbook
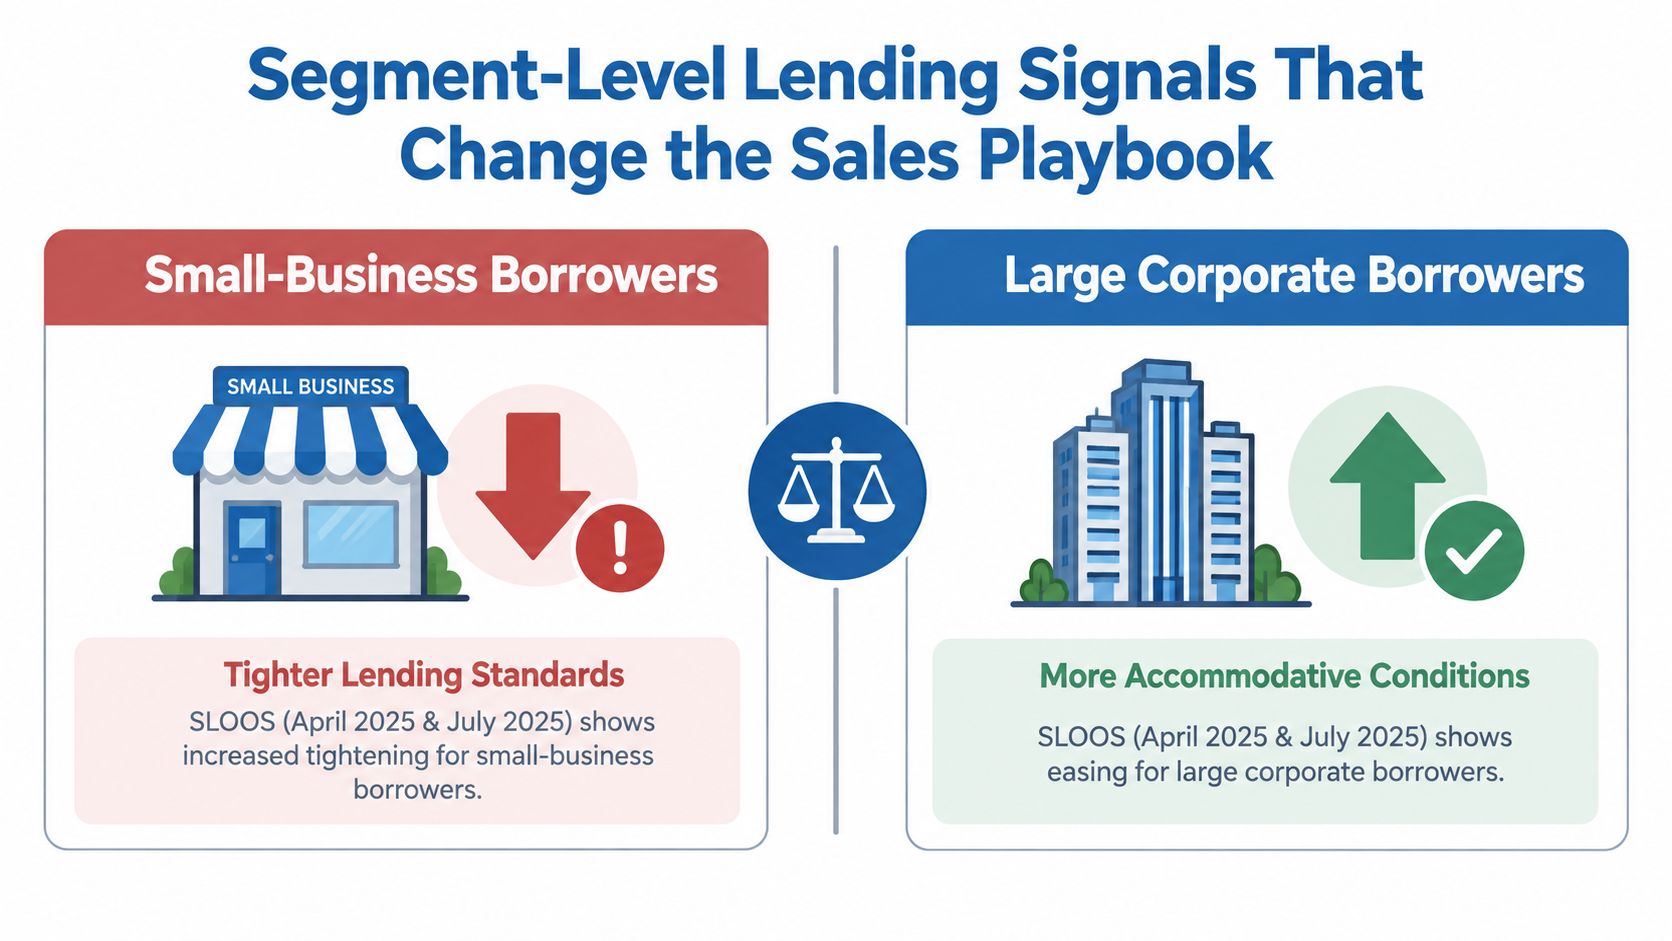
The U.S. market is tightening unevenly. The Federal Reserve's July 2025 SLOOS found tighter overall C&I standards, while most terms for large and middle-market companies remained unchanged. Small-business lending saw sharper restrictions, including smaller credit lines, shorter maximum maturities, and tighter covenants.
The Federal Reserve's April 2025 SLOOS also reported tighter standards across firm sizes. Banks reduced maximum credit-line sizes, raised premiums on riskier loans, tightened collateral requirements and covenants, and used interest-rate floors more often. These changes widen the approval-to-funding gap for smaller borrowers, whose financing needs are less standardized and whose collateral packages are often thinner and harder to standardize.
Size changes the competitive opportunity
Large and middle-market companies can offer a more open sales environment when most terms remain unchanged. Credit is still selective, but relationship teams can compete through structuring, treasury integration, sector expertise, and execution speed without facing the same degree of line-size and maturity compression.
Small-business teams face a different trade-off. A bank can report stable or improving aggregate C&I growth while losing share among smaller firms as borrowers encounter smaller commitments, additional collateral demands, or stricter covenants. That erosion may remain hidden until a local competitor wins the next refinancing or working-capital request.
The July survey found that standards remained tighter than historical midpoints for below-investment-grade syndicated or club loans, small-business loans, and very small-business loans. The sales response should reflect those differences:
- Large and middle-market: Prioritize firms with steady inquiry activity and unchanged demand, then compete on execution and relationship breadth.
- Small business: Use disciplined prequalification to identify borrowers whose cash flow, collateral, and purpose fit current risk appetite.
- Very small business and below-investment-grade borrowers: Set sharper risk-adjusted pricing, stronger monitoring, and clear escalation rules.
Prospecting should follow the segments where the bank can convert demand at an acceptable return, not the largest visible market.
A bank measuring only total originations can discover segment loss after the relationship has already moved.
Executives comparing performance also need consistent definitions. The distinction between commercial and industrial facilities, borrower purpose, and underwriting structure affects how inquiry, approval, and funded-balance trends should be interpreted. This C&I lending overview provides context for separating those categories before management compares results across institutions.
What European Lending Demand Reveals About U.S. Strategy
The Euro-area experience offers a useful warning against assuming that lower rates automatically produce a broad commercial credit expansion. In the ECB Bank Lending Survey, the net share of banks reporting increased firm loan demand was 3% in the fourth quarter of 2024, after a 7% decline in the second quarter. Banks expected total firm lending demand to be -1% in the first quarter of 2025, but actual demand moved to -3% before returning to 2% in the third quarter of 2025. (ECB Bank Lending Survey)
The readings were modest against the ECB's historical benchmarks. The long-run average net change in firm loan demand since 2003 was -1%, while the average since 2014 was a 5% increase. The late-2024 recovery therefore represented a weak improvement, not a broad-based credit surge.
Rates don't replace investment confidence
The ECB attributed weak demand partly to low fixed investment, even as lower interest rates supported some borrowing. That distinction has direct relevance for U.S. strategy. A borrower may welcome cheaper credit while still postponing a factory expansion, equipment purchase, acquisition, or property investment because management lacks confidence in future demand.
Bank executives should therefore monitor purpose alongside volume. If inquiries rise mainly for liquidity protection or refinancing, the sales opportunity may be real but the economic signal is defensive. If inquiries rise for productive investment and convert into funded commitments, the bank is seeing a stronger form of commercial demand.
The comparison also sharpens the interpretation of U.S. small-business signals. Tighter terms can reflect lender caution, but weak investment appetite can also limit borrowing even when approval conditions improve. A relationship manager who asks only whether a client wants a loan may miss the more important question: what decision will the loan finance, and has the client committed to that decision?
This is why bank dashboards should combine lending activity with borrower purpose, inquiry stage, and utilization. European data show that price-sensitive demand and confidence-sensitive investment aren't the same thing. U.S. executives can use that distinction to avoid expanding capacity where borrowers are merely preserving optionality, while directing coverage toward firms with concrete operating or investment needs.
Commercial Real Estate as a Concentration Risk Worth Watching
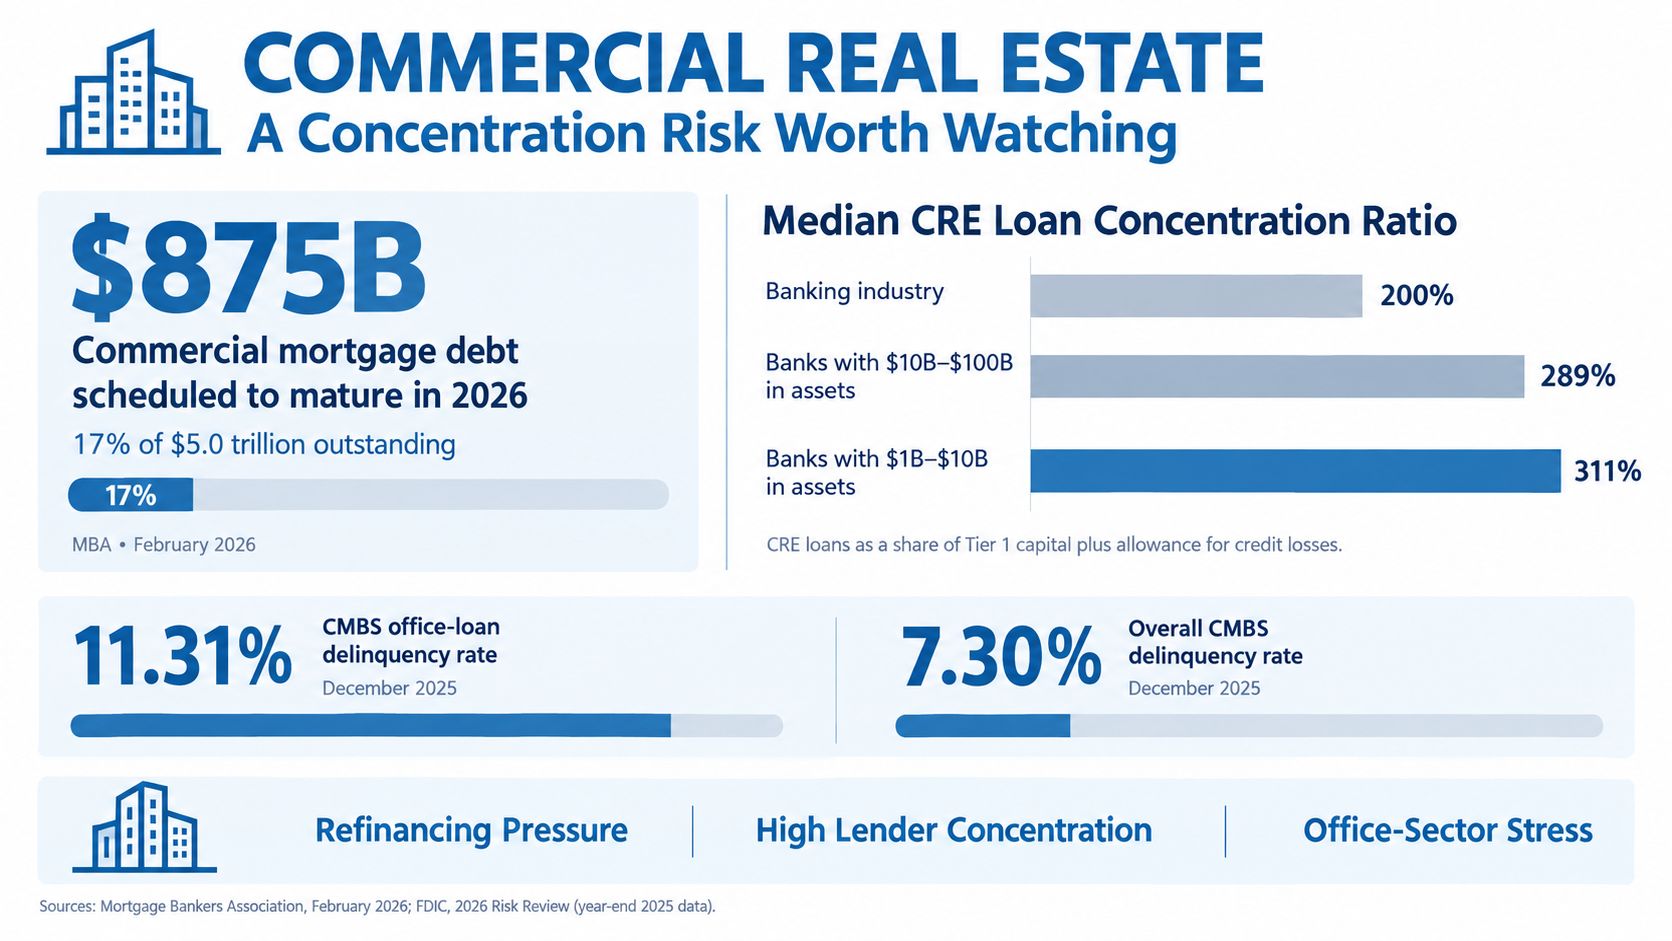
CRE credit quality turned upward after ten consecutive quarters of gradual increases in the banking industry's total past-due, nonaccrual, and delinquency ratio. The FDIC 2026 Risk Review reported easing in the second and third quarters of 2025, followed by a rise to 1.45% in the fourth quarter of 2025, slightly above the level a year earlier.
That sequence matters because a portfolio can appear stable while risk builds beneath the aggregate figure. Property type, geography, loan vintage, sponsor strength, repayment structure, and concentration determine whether a change is temporary pressure or evidence of a broader credit problem. Loans that remain current may still warrant review if maturity dates are near and refinancing capacity has weakened.
Executives should connect three dashboard signals: inquiries, approvals, and funded balances. Rising inquiries may show borrower concern about refinancing or liquidity, while approvals reveal the bank's risk appetite. Funded balances show which requests survived underwriting and became actual exposure. A widening gap between those measures can signal demand without deployable credit, or approvals without meaningful balance growth.
CRE monitoring should therefore answer three decision questions. First, which property types and markets show weaker past-due or nonaccrual behavior? Second, which maturities, extensions, and refinancing assumptions could create pressure? Third, where do borrower, sponsor, property, or market exposures exceed internal limits or peer levels?
The response can be targeted: review vulnerable borrowers, revise reserves, reprice risk, restrict new production, or adjust exposure limits. Development assumptions also deserve scrutiny. Teams assessing supply, tenant needs, and project feasibility can consult 2026 office construction planning alongside bank-specific exposure data.
For peer context, commercial real estate lending analysis can help directors distinguish market-wide movement from institution-specific concentration. The decision is not whether to expand or retreat from CRE. It is where funded exposure, repayment capacity, and concentration justify additional growth.
SBA 7(a) Economics and What Guarantee-Backed Growth Looks Like
The SBA 7(a) program changes how banks measure small-business credit risk. It permits a maximum loan amount of $5,000,000, guarantees 85% of loans of $150,000 or less, and guarantees 75% of loans above $150,000. In a $1,000,000 example, the guarantee generally covers $750,000 of principal exposure, leaving the lender with $250,000 before recoveries and other adjustments. (SBA 7(a) program)
That structure can alter the approval decision. A request with limited collateral, uneven cash flow, or a business-continuity purpose may produce an acceptable risk-adjusted return under 7(a) terms even when a conventional structure does not. The guarantee lowers retained principal exposure, but it does not eliminate underwriting work or repayment risk.
Credit teams still need to test four areas:
- Borrower repayment capacity: Confirm that operating cash flow supports the proposed structure.
- Collateral and documentation: Verify the collateral package and required records.
- Program compliance: Ensure the facility satisfies applicable 7(a) requirements.
- Relationship economics: Include deposits, treasury services, fees, and future borrowing needs in the return assessment.
The product also changes the sales signal. A borrower declined under conventional policy may remain suitable for guarantee-backed credit when the purpose, repayment profile, and documentation fit the program. Relationship teams should identify that possibility during discovery, rather than present 7(a) only after another request fails.
Portfolio reporting should separate inquiries, approvals, and funded balances. A rise in inquiries without funded growth may indicate that eligibility, documentation, or execution is limiting conversion. Peer comparisons should cover guarantee-backed production, borrower segments, approval conversion, utilization, and credit outcomes. The SBA loan data resource helps teams examine program activity alongside institution and market intelligence.
The strategic case is measured growth. Directors should approve expansion only after accounting for operational costs, compliance work, servicing requirements, and the lender's retained exposure. A larger funded balance matters when those costs are covered by the resulting risk-adjusted return.
From Trends to Bank-Specific Decisions
The evidence supports a short list of decisions rather than a broad call to “grow commercial lending.” Executives should first determine where inquiry volume is converting into approved commitments, where approvals are converting into funded balances, and where terms are changing enough to alter risk-adjusted returns.
The next 30 days
Create a common pipeline definition across business development, relationship management, underwriting, and finance. Report inquiries, approvals, commitments, and funded balances separately, then segment the results by borrower size, purpose, industry, and relationship manager. This will show whether a flat portfolio reflects weak demand or internal conversion friction.
The next 60 days
Review pricing and structure by segment. Smaller borrowers may require more collateral, tighter covenants, shorter maturities, or higher risk premiums, while large and middle-market relationships may compete on execution and breadth. The decision isn't whether to approve more loans. It's whether the bank is being compensated for the terms it is accepting.
The next 90 days
Build peer-based monitoring for CRE and commercial production. Compare concentration, delinquency movement, loan purpose, and growth by geography and institution. A bank should investigate divergence from peers before it becomes a board-level surprise, while sales leaders should identify firms showing rising inquiries but low utilization or stalled approvals.
One practical data architecture can connect these workflows. Visbanking's Bank Intelligence and Action System brings together FDIC, FFIEC, SBA, UCC, SEC/EDGAR, and macroeconomic data for peer benchmarking, prospecting, and risk analysis. Used alongside internal pipeline data, that type of external context can help executives distinguish a bank-specific problem from a market-wide shift.
External financing needs also vary by specialized borrower and asset class. For example, teams examining cross-border or high-value property relationships may find finance luxury European property useful as market context, but it shouldn't replace institution-specific underwriting or exposure analysis.
The management discipline is simple: assign each signal to an owner, define the decision it informs, and set an escalation point. Data becomes valuable when a relationship manager changes coverage, a credit officer changes structure, or a director changes the plan.
Benchmark Before You Set Next Year's Commercial Plan
Commercial lending trends are useful only when executives can compare the market with their own book. A national recovery may coexist with a shrinking local franchise. Stable large-company production may conceal lost small-business relationships. A manageable CRE ratio may conceal concentration in a single property type or maturity cohort.
The planning question should therefore move beyond, “Is commercial lending growing?” It should ask:
- Where is demand appearing, and at what stage does it stop?
- Which segments generate acceptable returns after tighter terms and operating costs?
- Where does the bank outperform peers, and where is it losing share?
- Which exposures require action before delinquency becomes the visible signal?
The same logic applies to specialized commercial borrowers. A bank evaluating healthcare or professional-practice growth, for example, may review veterinary practice financing options to understand borrower needs and product structures, then compare those opportunities with its own approval, utilization, and relationship data.
Visbanking covers 4,600+ banks and credit unions, giving directors a reference set for institution, peer, segment, and geographic benchmarking. That comparison won't make the strategic decision, but it can show whether the decision is based on actual competitive position or an aggregate market assumption.
The next commercial plan should begin with a benchmark pack for the credit committee. Include portfolio growth, inquiry-to-approval conversion, approval-to-funding conversion, segment mix, pricing, utilization, CRE concentration, and guarantee-backed production. Then set targets based on the gap between the bank's current position and the institutions it intends to outperform.
Visbanking helps banks and credit unions connect market, regulatory, performance, SBA, prospect, and risk data in decision-ready workflows. Visit Visbanking to benchmark your institution against relevant peers and turn commercial lending signals into actions for your next credit committee and planning cycle.
Latest Articles
Brian's Banking Blog
Bank Marketing Dataset Analysis Strategy

Brian's Banking Blog
ESG Peer Benchmarking for Bank Leaders
Brian's Banking Blog
What Is Repricing Risk: A Bank Executive's Guide

Brian's Banking Blog
How to Manage Vendor Relationships in Banking

Brian's Banking Blog
ISO 20022 Migration Strategy for Bank Leaders

Brian's Banking Blog