
Bank Marketing Dataset Analysis Strategy
Brian's Banking Blog
The most popular advice in bank marketing dataset analysis is often the least useful: maximize accuracy, publish the AUC, and deploy the highest-scoring model. That approach can produce an impressive presentation and a weak sales pipeline. A bank doesn't earn revenue from a model that classifies historical records correctly. It earns revenue when the right prospect receives the right offer, through the right channel, at an economically justified cost.
That distinction matters because banking datasets change as institutions merge, fail, consolidate, alter products, and serve different markets. FDIC historical data shows that the number of commercial banks rose from 13,424 in 1901 to 30,456 in 1921, fell to 14,207 by the end of 1933, and declined by 71%, or 10,973 institutions, from 1934 through 2020, reaching 4,377 banks at the end of 2020. The historical record is a warning for executives: a benchmark without institutional context can confuse a change in the market with a change in customer demand. FDIC historical banking data supports the longitudinal discipline that marketing models also require.
Moving Beyond Generic Accuracy Metrics
A model can be accurate and commercially wrong. The frequently analyzed UCI Portuguese bank-marketing dataset contains 45,211 observations, 16 input variables, and an approximately 11.69% positive-response rate. A classifier that predicts “no” for every customer can look strong on aggregate accuracy while identifying no actionable leads, and a model trained on campaigns conducted in Portugal during 2008 to 2010 shouldn't be treated as a universal playbook for a modern U.S. community bank. Research on the dataset's external validity makes the issue clear: attractive aggregate metrics can conceal poor performance on the small group with the highest commercial value.
Ranking isn't the same as economic judgment
Executives should separate discrimination from calibration. Discrimination asks whether the model ranks likely responders above unlikely responders. Calibration asks whether a predicted probability corresponds reasonably to the response rate that materializes. A sales leader allocating relationship-manager capacity needs both, but the second determines whether a budget or staffing plan is credible.
Synthetic oversampling creates another risk. Techniques such as SMOTE can improve minority-class detection, yet they can also alter the training distribution and distort probability estimates if the process isn't controlled. A model may appear stronger in an offline test while producing scores that overstate the likelihood of conversion in production.
Executive test: Ask whether the model can estimate expected margin per contact for this institution, market, product, and campaign. If it can only report accuracy or ROC-AUC, it isn't ready to guide budget allocation.
The correct operating question is not, “Which algorithm wins on the public benchmark?” It is, “Will this model rank prospects profitably for our current product mix and outreach capacity?” That requires institution-specific holdouts, campaign-period validation, observed response prevalence, and a clear definition of value. A deposit campaign, commercial lending campaign, and mortgage campaign shouldn't share the same economic threshold because they use similar customer records.
A practical review should also require pre-contact features, explainable reason codes, and a clear treatment of consent and customer-experience constraints. Teams evaluating deployment controls can use Gritt.io outreach automation as a broader reference point for how automated outreach workflows fit into prospecting operations, but automation doesn't replace model governance.
For banks validating these decisions, machine learning model validation at Visbanking reflects the more useful standard: test whether the score remains reliable under the institution's actual conditions, not whether it performs elegantly on a disconnected historical sample.
Enriching Internal Records with Market Signals
A CRM record tells a bank what it knows about a customer. It rarely tells the bank enough about the opportunity around that customer. Age, occupation, marital status, education, housing-loan status, personal-loan status, contact history, previous responses, and the timing of the last interaction become more useful when combined with product holdings, account activity, profitability, transaction frequency, and market context. Research on bank customer segmentation supports this principle, showing that segmentation should connect behavior and product use to economic outcomes rather than create demographic categories alone. Banking segmentation research provides the analytical foundation for that approach.
Build segments around decisions
A segment matters only when it changes an action. A relationship manager might need to identify customers suitable for a treasury-services conversation, borrowers approaching a refinancing decision, or commercial clients whose account activity suggests a need for additional liquidity. The external signal could be mortgage production in a local market, SBA lending activity, peer product mix, labor conditions, or a change in the competitive environment.
The data architecture should preserve the link between a customer, an institution, a market, and a time period. That allows analysts to distinguish a genuine change in customer behavior from a shift in the local banking population or a competitor's expansion. The distinction is especially important in longitudinal work because mergers, ownership changes, entry, and exit events alter the institutions being compared.
Strong enrichment follows a commercial chain:
- Customer context: Establish the relationship, product holdings, channel engagement, and prior response history.
- Financial context: Add profitability, balances, transaction behavior, credit position, and product-use intensity.
- Market context: Add lending demand, peer activity, geography, competitive whitespace, and relevant economic indicators.
- Action context: Define the offer, channel, contact cost, expected value, and reason the customer should be contacted now.
This framework prevents data engineering from becoming an abstract exercise. It also helps marketing, sales, risk, and compliance agree on which fields are permissible, explainable, and useful. Teams building the people and analytical capabilities behind this work may find a practical reference in top marketing skills for 2026, particularly where campaign execution and data interpretation increasingly overlap.
The difference between a demographic segment and an operating segment is material. “Older homeowners” is descriptive. “Existing mortgage customers with strong deposit relationships, recent balance movement, and a local refinancing opportunity” points toward a specific conversation, subject to eligibility and consent controls. Visbanking data enrichment services can support this type of multi-source foundation by connecting internal relationship information with market and regulatory signals.
Structuring Data to Prevent Analytical Leakage
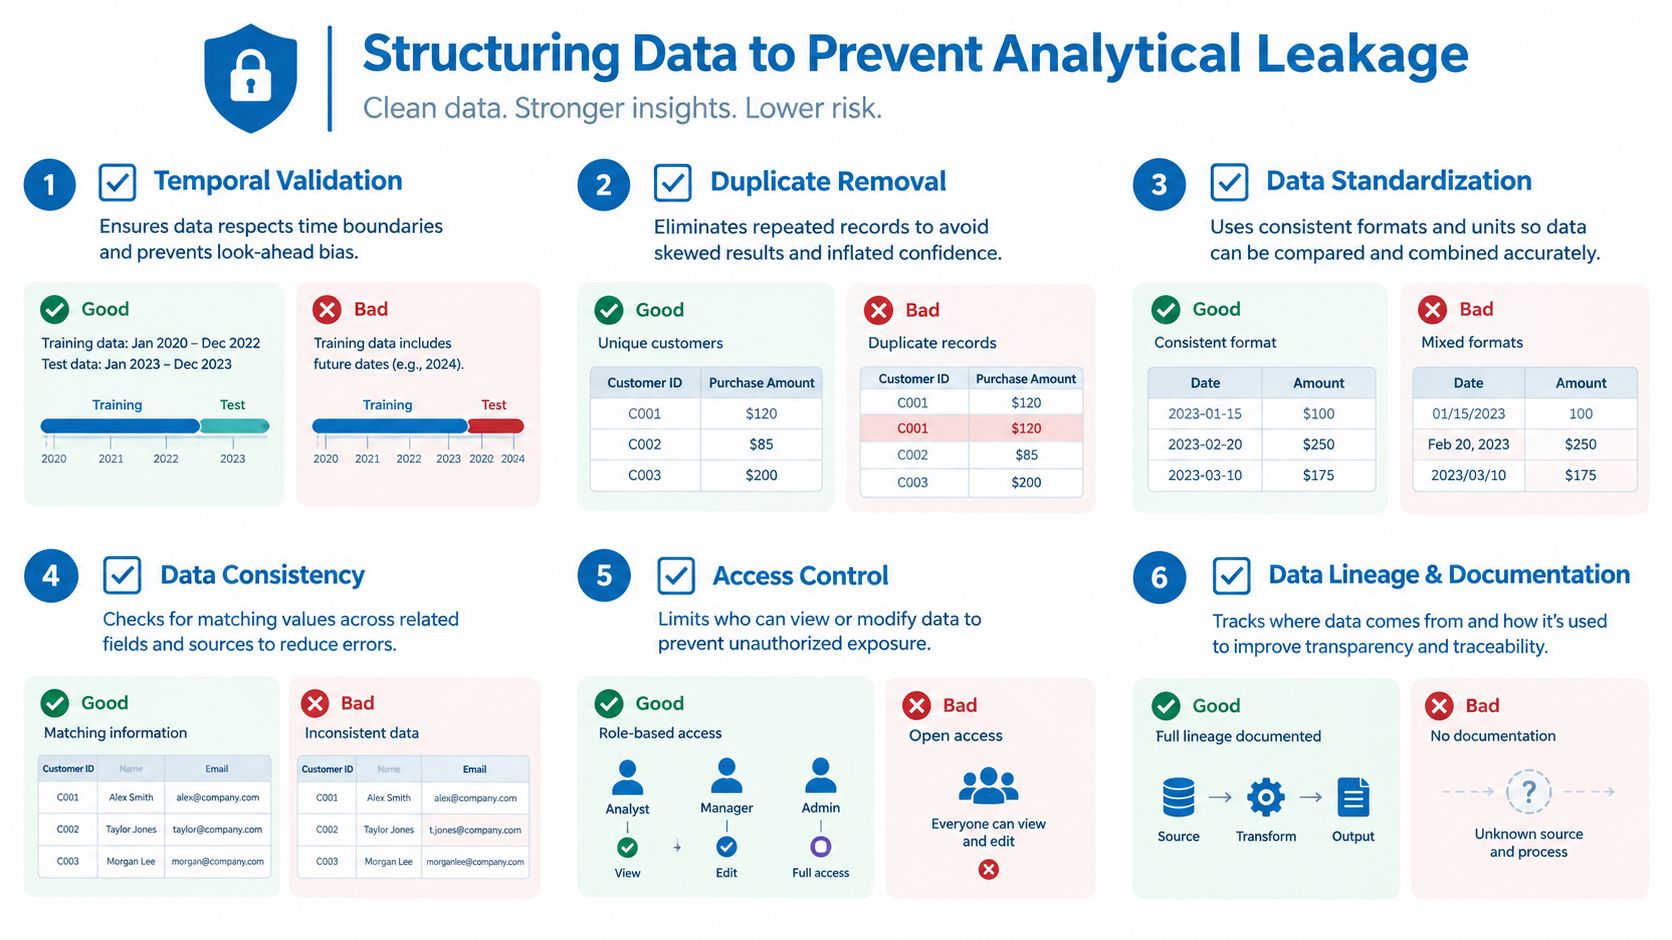
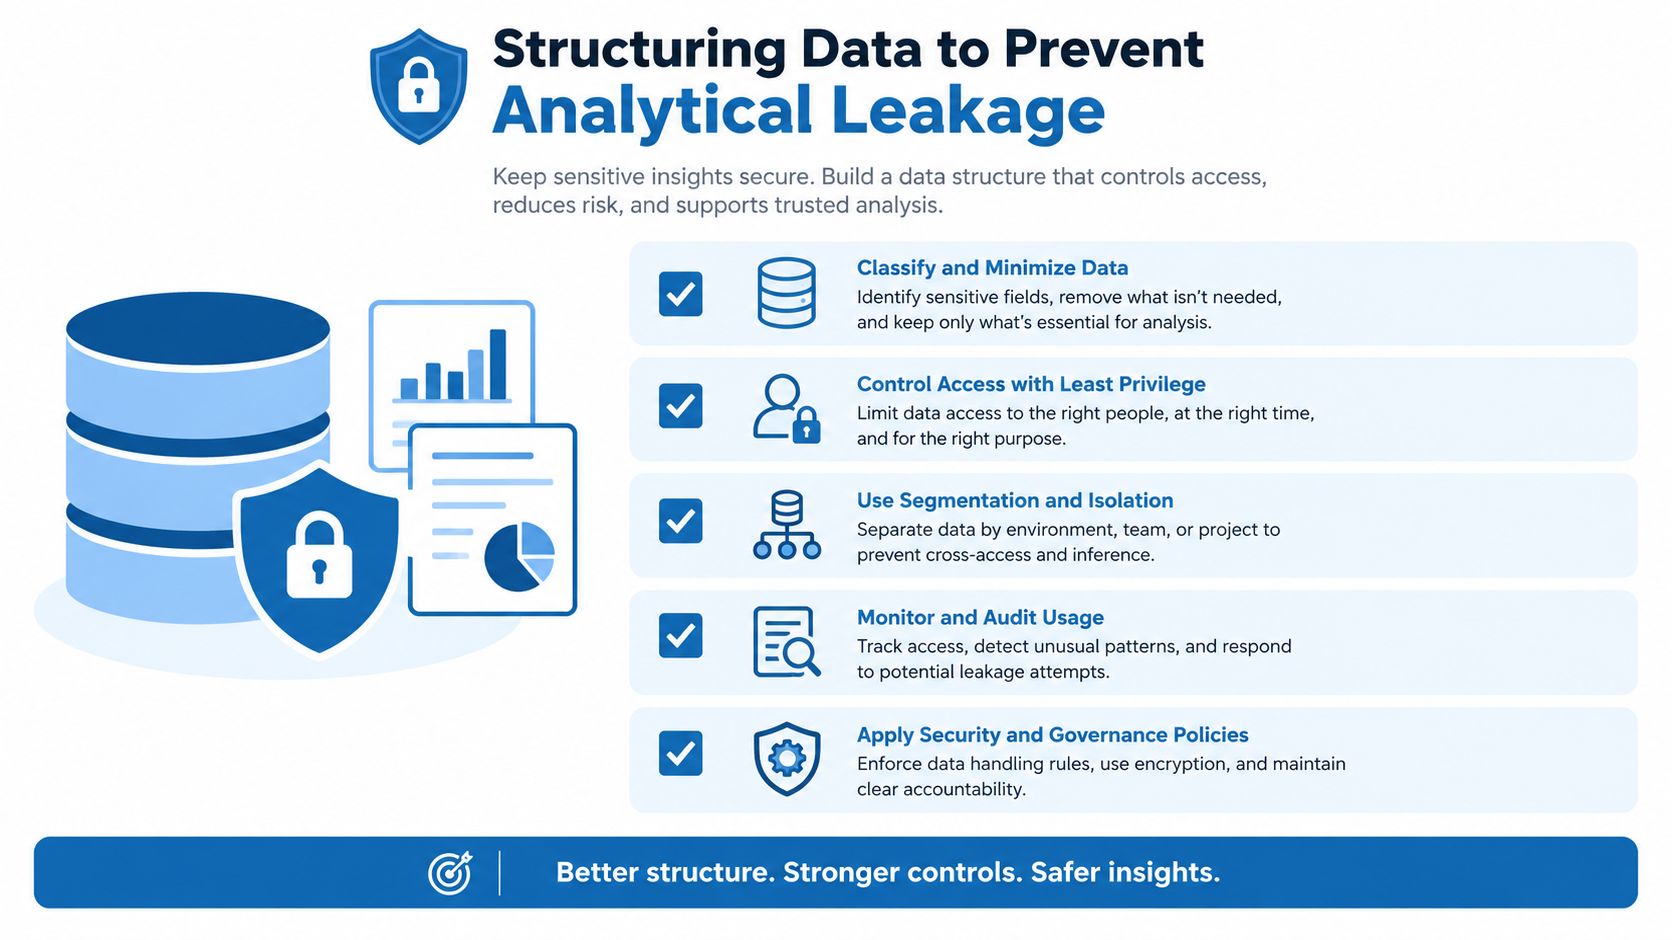
A model trained on information unavailable at the moment of decision will produce confident fiction. The most familiar example is call duration. It can be highly predictive of campaign response, but the bank learns the duration only after the call. Including it in a prospect-selection model gives the algorithm information that the relationship manager won't have when deciding whom to contact.
That error isn't a minor technicality. It makes a campaign appear easier to predict than it is, and it can direct investment toward a false sense of precision. Every feature should therefore be classified by availability: known before contact, generated during contact, or observed after the outcome.
Use the deployment environment as the test
A rigorous bank-marketing analysis treats response as an imbalanced binary-classification problem. The practical implication is that raw accuracy can't carry the evaluation. Research on imbalance treatment in bank marketing recommends precision-recall analysis and balanced accuracy, while emphasizing that oversampling must occur inside training folds to prevent information leakage.
The preparation sequence should be explicit:
- Audit record quality. Remove duplicates, document missing-value codes such as “unknown,” and identify fields created after contact.
- Respect time. Use a chronological split when campaign dates exist. If dates aren't available, use stratified cross-validation and preserve the same preprocessing logic inside every training fold.
- Keep resampling inside the fold. Apply SMOTE or random oversampling only to the training portion. Never transform the full dataset before cross-validation.
- Evaluate the operating trade-off. Report precision, recall, F1, PR-AUC, balanced accuracy, lift, and expected profit at the intended threshold.
- Protect the final estimate. Validate the chosen threshold on an untouched holdout that reflects the expected deployment environment.
The threshold is a business decision, not merely a model output. A bank with limited relationship-manager capacity may prefer fewer, higher-value contacts. Another institution may accept lower precision to expand reach in a strategically important market. Both decisions can be sound, but neither should be hidden behind a single accuracy figure.
Data-control rule: If a feature wouldn't exist in the CRM at the instant a banker makes the outreach decision, it doesn't belong in the prospect-selection model.
This discipline also applies to institution history. Analysts should preserve dates, identifiers, ownership changes, and entry or exit events so a model doesn't interpret consolidation or reporting changes as customer demand. A clean dataset isn't just technically tidy. It reflects the bank's actual decision environment.
Calibrating Probabilities for Sales Execution
Ranking prospects is useful, but sales execution requires a credible estimate of likelihood. If a score is used to prioritize outreach, assign relationship-manager capacity, or estimate campaign economics, the bank must know what that score means in practice. A ranking can place customers in the right order while still overstating or understating the probability of response.
Treat the score as an economic input
Probability calibration should follow a controlled sequence:
- Train the classifier using only information available before contact.
- Generate out-of-fold probabilities from the training process.
- Fit Platt scaling or isotonic regression only on those out-of-fold predictions.
- Review calibration curves, Brier score, and observed-versus-predicted response rates by decile.
- Set the outreach threshold using contact cost, conversion value, capacity, and customer-experience constraints.
Scikit-learn's calibration guidance explains why cross-validated calibration matters. The calibrator shouldn't learn from the same predictions used to fit the base model, or the bank risks measuring a polished version of overfitting.
The commercial consequence is straightforward. Suppose a campaign score places a group at a predicted response probability of 20%. The bank should be able to test whether a comparable group responds at roughly that level under similar deployment conditions. If it doesn't, expected revenue, staffing assumptions, and contact economics are all misstated.
Capacity changes the optimal threshold
A bank shouldn't set one universal cutoff for every campaign. A high-margin commercial product can justify outreach at a lower predicted probability than a low-value offer with substantial contact cost. A relationship manager serving a concentrated portfolio may need a short, prioritized queue, while a digital campaign can handle broader targeting if consent and customer experience permit it.
Calibration becomes more valuable than a leaderboard position. A model with a slightly weaker discrimination score but reliable probabilities can support:
- Capacity planning: Estimate the likely opportunity within each relationship manager's book.
- Budget allocation: Compare expected contribution against contact and channel costs.
- Offer selection: Match likely needs to products rather than send generic promotions.
- Customer treatment: Suppress low-value or over-contacted customers and document the reason for outreach.
- Management reporting: Compare forecast response with observed response by campaign, period, geography, and segment.
Oversampling deserves special scrutiny here. Because oversampling changes the class distribution seen during training, a model can retain useful ranking while producing probabilities that don't match deployment prevalence. Calibration must therefore occur against an appropriate validation process, and monitoring must continue after launch.
A score also needs an explanation that a banker can use. “High propensity” is not a conversation. “Existing deposit relationship, recent business-account activity, and relevant local lending whitespace” gives the relationship manager a defensible starting point, assuming the fields are permitted and current.
The board-level question is not whether the model has a high AUC. It is whether the institution can connect a calibrated score to a defined offer, contact capacity, expected margin, and measured outcome. Without that chain, prediction remains an analytical artifact.
Leveraging Regulatory Data for Competitive Whitespace
Public regulatory records can answer questions internal production data cannot. They show how a bank's activity compares with peers, markets, and borrower segments, creating a basis for identifying whitespace rather than relying on intuition. Three sources are particularly useful because each exposes a different commercial lens.
The HMDA dataset provides loan-level records through each institution's modified Loan/Application Register, along with national files, institution-specific files, dynamic weekly datasets, and disclosure reports. The 2024 HMDA dataset covers approximately 4,898 reporting institutions, according to the Consumer Financial Protection Bureau's HMDA release. A bank can compare its product, geography, approval, and borrower-segment mix with similarly situated institutions, then investigate where demand exists but conversion lags.
The FDIC Quarterly Banking Profile provides a different control. Built primarily from FFIEC Consolidated Reports of Condition and Income, or Call Reports, it includes aggregate condition and income data, performance and condition ratios, structural changes, and loan-quality measures such as past-due, noncurrent, and charge-off information. The FDIC's user notes emphasize comparisons by asset size, geography, and predominant asset concentration. Those peer groups prevent a community bank from adopting growth or margin expectations designed for a fundamentally different institution.
SBA activity reveals product and ticket-size strategy. FY2024 SBA reporting covers 7(a), 504, and Community Advantage activity, with monthly and annual data from FY1991 through FY2024. In Connecticut, traditional SBA activity included 1,058 loans totaling about $383 million, including $318.8 million in 7(a) loans to 901 businesses. M&T Bank recorded 168 7(a) loans totaling $19 million, TD Bank recorded 98 loans totaling $9.2 million, and Webster Bank recorded 95 loans totaling $31.4 million. Their approximate average loan sizes were $113,000, $94,000, and $331,000, respectively, showing different strategies despite similar loan counts. The Connecticut SBA market analysis illustrates why volume alone is an inadequate competitive measure.
| Data Source | Primary Marketing Application | Executive Action Trigger |
|---|---|---|
| HMDA | Compare mortgage product, geography, approval, and borrower-segment mix | Investigate markets where demand is present but conversion trails peers |
| FDIC and FFIEC data | Benchmark performance, growth, credit quality, and institution-level condition | Revisit targets when growth or credit costs diverge from the correct peer group |
| SBA program data | Identify small-business whitespace by geography, product, lender, and ticket size | Direct relationship managers toward underserved borrower and referral segments |
SBA borrower-segment data adds another lens. FY2024 lending reached 5,200 loans totaling $1.5 billion to Black-owned businesses, 9,600 loans totaling $3.3 billion to Latino-owned businesses, and 15,500 loans totaling $5.6 billion to majority women-owned businesses. The SBA described these as substantial gains relative to FY2020, including a tripling of Black-owned-business loan count, a 2.5-times increase for Latino-owned businesses, and a doubling of majority women-owned-business participation. SBA's report supports a commercial question executives should ask: does the bank's local coverage and product strategy reflect expanding borrower opportunity?
For mortgage teams building repeatable peer comparisons, Visbanking HMDA data analysis provides one way to turn regulatory records into an operating view rather than a static file.
Operationalizing Intelligence for Measurable Growth
The most expensive failure in bank analytics is a model that never reaches the CRM. A notebook can rank prospects, but it can't allocate a relationship manager's time, explain an offer, record consent, or measure incremental revenue. Those functions require a governed workflow that connects data, prediction, action, and outcome.
Recent U.S. industry research found that two-thirds of surveyed banks and credit unions scored below 50 on sales and marketing data-execution capabilities, including personalization, segmentation, and campaign analytics. Cornerstone Advisors' research points to a core constraint: fragmented data and weak execution, rather than just a lack of advanced classifiers.
Design the closed loop
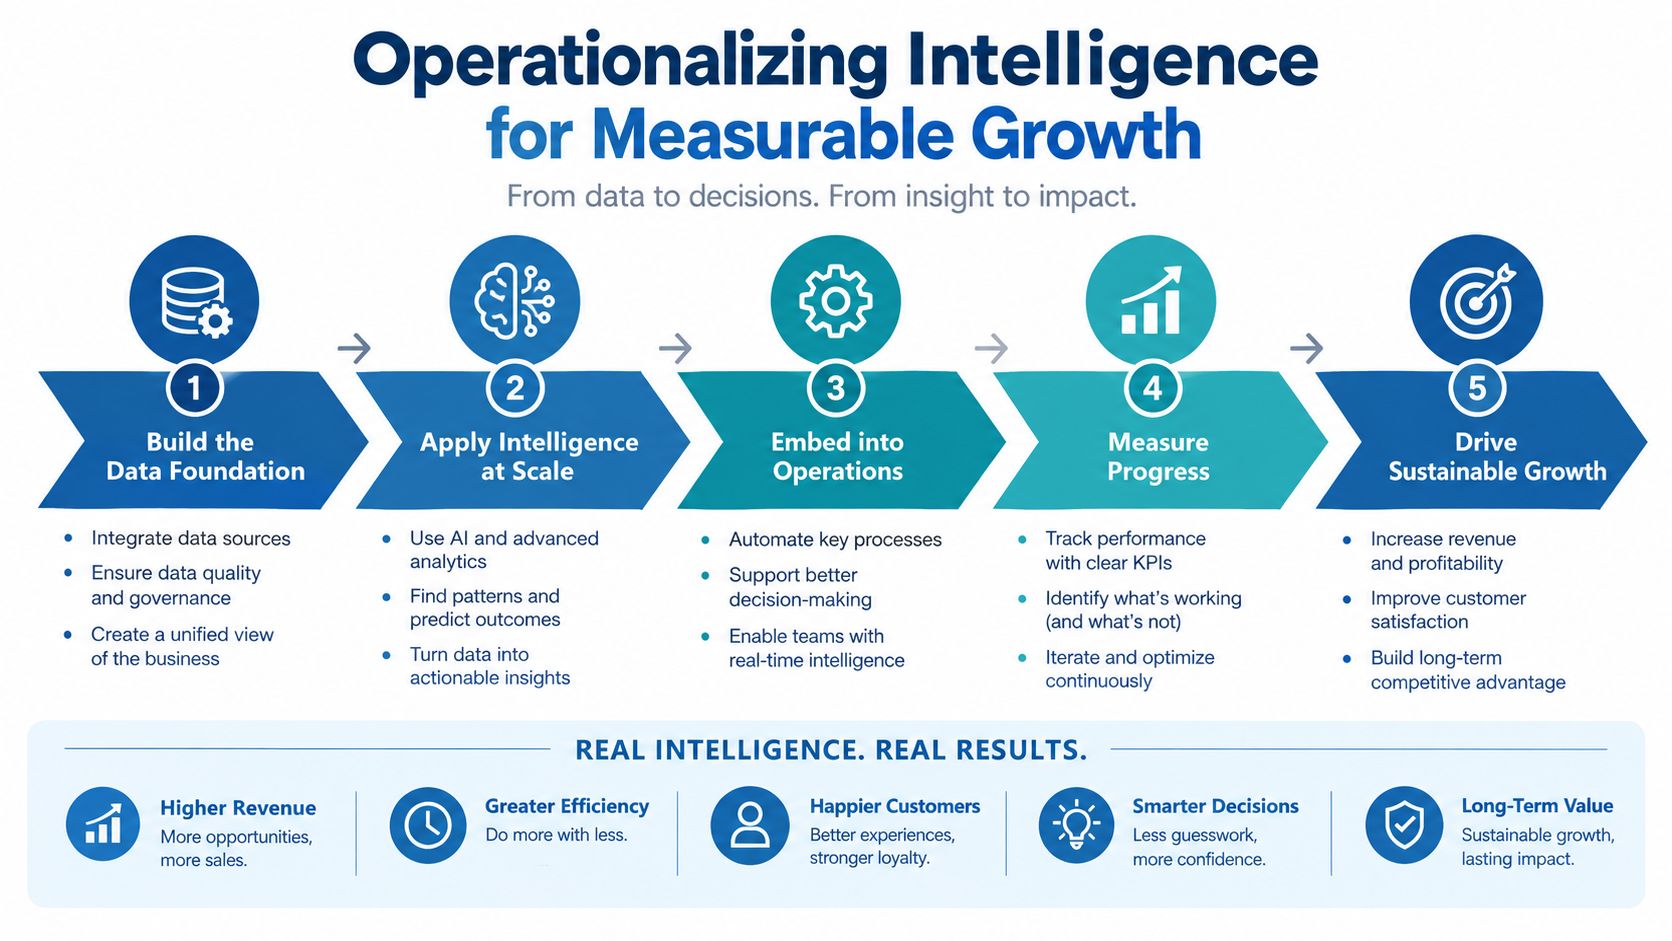
A practical operating model should connect five elements:
- Signal: Combine internal relationship data with regulatory, market, people, and competitive information.
- Decision: Produce a calibrated score, an offer recommendation, a reason code, and an eligibility or consent check.
- Execution: Deliver the prioritized action through the CRM, relationship-manager queue, digital channel, or approved outreach process.
- Measurement: Record contact, response, conversion, margin, channel, and customer-experience outcomes.
- Governance: Monitor drift, subgroup performance, permissible features, threshold changes, and audit evidence.
Controlled experiments are essential because response after contact doesn't prove that the model created incremental value. A bank should compare treatment and control groups where appropriate, measure outcomes against the campaign objective, and distinguish new revenue from activity that would have occurred anyway.
Monitoring also has to reflect the operating risk. Track response prevalence, precision at the outreach-capacity cutoff, calibration drift, subgroup recall, campaign-period performance, and the relationship between forecast and realized margin. If the market changes or the product changes, the model's historical ranking can remain visually stable while its economics deteriorate.
A useful dashboard gives the banker a reason to act, not just a score to interpret. It should show why the customer is prioritized, which product or need is relevant, whether contact is permitted, and what outcome the bank expects to learn. Leaders evaluating the human side of this operating model can also consult a guide to advisor digital marketing for broader context on how financial-services teams connect audience strategy with execution.
Visbanking is one example of an intelligence and action platform that unifies financial, regulatory, market, and people data, including FDIC Call Reports, FFIEC and UBPR, NCUA 5300, SBA, UCC, SEC/EDGAR, BLS, BEA, and HMDA sources. Its workflow-oriented applications support peer benchmarking, prospect and relationship analysis, talent intelligence, predictive signals, alerts, and API-based delivery. The relevant standard isn't the platform's feature list. It's whether the bank can trace a decision from source data to action and then to measurable commercial and risk outcomes.
Executives should demand that traceability before approving another model-development project. The winning bank marketing dataset analysis program won't be the one with the most impressive offline metric. It will be the one that turns reliable signals into accountable decisions, learns from results, and adjusts before value or trust erodes.
Visbanking helps banks and credit unions unify regulatory, market, relationship, and people data for calibrated benchmarking, prospect prioritization, and measurable campaign execution. Visit Visbanking to explore the data and workflows that can turn bank marketing dataset analysis into institution-specific growth decisions.
Latest Articles

Brian's Banking Blog
ESG Peer Benchmarking for Bank Leaders
Brian's Banking Blog
What Is Repricing Risk: A Bank Executive's Guide

Brian's Banking Blog
How to Manage Vendor Relationships in Banking

Brian's Banking Blog
ISO 20022 Migration Strategy for Bank Leaders

Brian's Banking Blog
Lead Tracking Software for Banks: An Executive Guide

Brian's Banking Blog