
Exposure at Default: The Complete Guide for Bank Leaders
Brian's Banking Blog
A revolver can look lightly used on the balance sheet and still represent a large credit loss and capital exposure. A $10 million corporate facility drawn at $2 million may produce $9 million or more of exposure at default, depending on expected utilization before failure. The risk isn't the current balance alone. It's the borrower's ability and incentive to draw the unused commitment while credit quality is deteriorating.
For bank executives, that makes exposure at default, or EAD, a commercial variable. Facility design, commitment sizing, covenants, pricing, monitoring, and sales incentives all influence the amount that will be outstanding when default occurs. Treating EAD as a back-office model output leaves capital and pricing decisions disconnected from the way business is won.
What Exposure at Default Actually Means for a Bank
Exposure at default is the gross amount a bank expects to have outstanding when a borrower defaults. It includes the drawn balance and, where relevant, likely future drawdowns from unused commitments. For revolving facilities, it can also include accrued but unpaid interest and fees, as described in the OCC working paper on unsecured credit exposure.
The executive-level definition is simple:
EAD is not what the borrower owes today. It's what the bank expects to owe itself at the point of failure.
That distinction matters because EAD is one of the three inputs in the expected-loss formula:
Expected Loss = PD × LGD × EAD
PD estimates the probability of default. LGD estimates the loss severity after recovery. EAD converts those risk assumptions into the dollar exposure that can be lost. If EAD rises while PD and LGD remain unchanged, expected loss rises with it.
Separate the four balances that people confuse
A facility has several different reference points:
- Drawn balance: The amount already advanced and recorded on the balance sheet.
- Committed amount: The total contractual facility size.
- Undrawn commitment: The remaining availability that the borrower may still access.
- Utilization: The proportion of the commitment currently drawn.
EAD uses these inputs differently. A term loan may have little contingent exposure because the borrower can't normally redraw principal. A revolving commercial line, by contrast, can have a modest current utilization rate and a much larger expected balance at default.
A $10 million revolver with $2 million drawn has $8 million undrawn. If the bank expects the borrower to draw most of that headroom before default, the eventual EAD can be several times the current balance. That isn't an accounting anomaly. It's the expected result of lending against a commitment that remains available during stress.
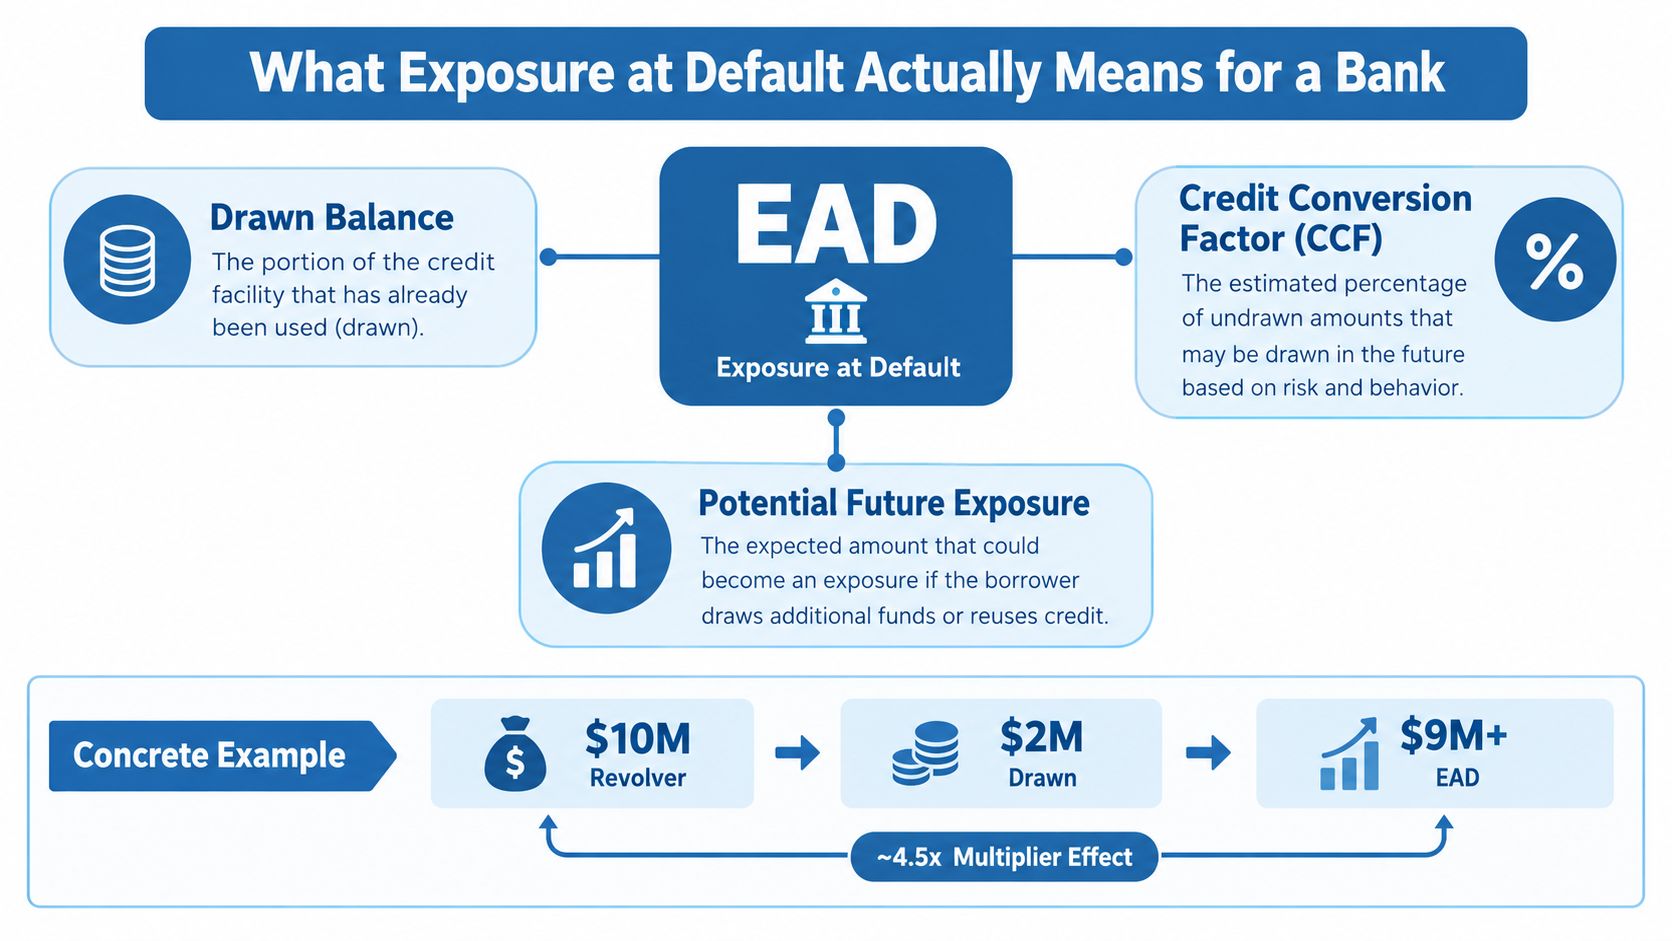
EAD is therefore forward-looking and facility-specific. The relevant question isn't only whether the borrower is risky. It's whether the product gives that borrower a practical path to increase the bank's exposure before default.
That is why executives should challenge three things in every revolving portfolio: the credit conversion factor, the behavioral evidence behind it, and the commercial process that keeps unused commitments open. Those choices affect loss estimates, regulatory capital, risk-weighted assets, pricing power, and the return generated by growth.
How EAD Fits into Basel and Modern Capital Rules
Exposure at default became a formal pillar of bank credit-risk measurement under Basel II, alongside probability of default and loss given default. Under the Basel IRB framework, expected loss is modeled as PD × LGD × EAD, while the capital formula scales risk-weighted assets by 12.5 times the capital requirement times EAD, as set out in the Basel II IRB risk-weight functions.
Basel also established the regulatory logic for off-balance-sheet exposure. EAD includes the amount already drawn plus likely future drawdowns on unused lines, while credit conversion factors translate commitments into an estimated default-time exposure. The framework set a minimum PD floor of 0.05% for most non-sovereign exposures and required standardized EAD inputs to respect floors based on on-balance-sheet amounts plus 50% of off-balance-sheet exposure, reinforcing the conservative role of EAD in capital measurement.
The regulatory arc matters more than the historical label. Basel II centralized EAD as a core capital input, later Basel revisions retained it, and current implementation work continues to refine how commitments and defaulted exposures are treated. The Basel regulatory discussion of system-wide PD, LGD, and EAD estimates shows why EAD remains a live supervisory issue, particularly where unused commitments and stressed utilization are difficult to observe.
Regulatory treatment of EAD across key frameworks
| Framework | EAD modeling approach | Key CCF or input treatment |
|---|---|---|
| Basel II IRB | Bank-estimated EAD for eligible exposures | Drawn amounts plus likely future drawdowns, with facility-specific modeling |
| Basel standardized approach | Prescribed treatment for off-balance-sheet items | Regulatory CCFs convert commitments into exposure |
| Later Basel revisions | Continued use of EAD with tighter implementation expectations | Floors and treatment of defaulted exposures remain important |
| PRA implementation | Supervisory treatment adapted to UK implementation | Defaulted exposures and certain retail real-estate cases receive clarified treatment |
| Bank accounting and allowance processes | EAD supports expected-loss measurement | Exposure assumptions must align with product behavior and credit conditions |
For executives, the conclusion is direct: EAD isn't settled uniformly across markets. The applicable framework, regulatory geography, model permission, and product classification can change the capital result even when borrower credit quality is identical. EAD also connects capital measurement with allowance processes, so banks should align the metric with their allowance for credit losses governance rather than manage it in an isolated risk silo.
The Core EAD Calculation From Drawn and Undrawn Balances
The basic calculation is:
EAD = Drawn Balance + (Undrawn Commitment × CCF)
The formula is straightforward. The judgment sits inside the credit conversion factor, or CCF. A CCF estimates how much of the currently unused commitment could be drawn and remain outstanding at default. Under the Basel definition, it is the ratio of the undrawn amount that could be drawn and outstanding at default to the currently undrawn amount. The commitment is generally measured using the advised limit unless the unadvised limit is higher, as described in the Basel CCF guidance.
Consider a commercial revolving facility with a $25 million legal commitment. The borrower has drawn $8 million, leaving $17 million available. If the bank's modeled CCF is 60%, the calculation is:
- Drawn balance: $8 million
- Undrawn commitment: $17 million
- CCF-adjusted future draw: $17 million × 60% = $10.2 million
- EAD: $8 million + $10.2 million = $18.2 million
The resulting EAD is more than twice the current drawn balance. A credit committee that reviews only the $8 million on-book exposure is looking at the wrong risk number.
The CCF is the capital decision
A bank may use an internally modeled CCF where the applicable IRB permissions and data support it. Under a standardized approach, the bank applies the relevant regulatory treatment to the commitment. The verified Basel material describes a 50% off-balance-sheet input floor in the standardized framework, while the exact regulatory application depends on the facility and commitment category.
That difference can materially change EAD and therefore risk-weighted assets. A lower internal CCF may support a lower modeled exposure, but only if the bank can defend the assumption with representative utilization history, downturn analysis, validation, and governance. A simple factor may be easier to operate and more conservative, while a variable model can better distinguish products and borrower behavior.
Map every exposure component correctly
Executives should require facility inventories that separate:
| Component | Value | Treatment |
|---|---|---|
| Current drawn balance | $8 million | Included directly in EAD |
| Undrawn commitment | $17 million | Converted using the applicable CCF |
| CCF-adjusted future draw | $10.2 million | Added to drawn exposure |
| Total EAD | $18.2 million | Used for loss and capital analysis |
On-balance-sheet components can include term loans, current advances, arrears, accrued interest, and eligible fees. Off-balance-sheet components can include undrawn revolvers, guarantees, letters of credit, trade-finance commitments, and foreign-exchange lines. The bank should not force every product through the same behavioral assumption. Product mechanics determine how much exposure can emerge before default.
Two Modeling Paths Banks Use to Estimate EAD
Banks generally choose between fixed supervisory treatment and variable internal modeling. The first path applies prescribed conversion factors to defined product categories. The second estimates EAD from observed borrower and facility behavior, usually with stricter data, validation, and model-governance requirements.
Fixed treatment offers operational clarity. It works well where product behavior is relatively standardized or where the bank lacks enough reliable history to estimate utilization at default. Credit cards, for example, are revolving products, but a bank may use a fixed or supervisory CCF rather than build a separate behavioral model for every customer segment. Term loans typically have less undrawn optionality, so the primary exposure is the outstanding balance and any directly associated additions.
Variable modeling becomes more valuable for corporate revolvers, overdrafts, delayed-draw facilities, and other commitments where utilization changes with liquidity pressure. The model can incorporate borrower segment, facility type, limit changes, covenant events, seasonality, delinquency status, and the period leading into default. That flexibility can produce a more risk-sensitive result, but only when the bank has credible facility-level observations.
Fixed versus variable EAD modeling by product type
| Product | Typical modeling path | Key driver | Capital impact |
|---|---|---|---|
| Credit cards | Fixed or supervisory CCF | Payment behavior and line utilization | Simple, often conservative treatment |
| Term loans | Direct balance-based exposure | Outstanding principal and accrued amounts | Limited contingent component |
| Corporate revolvers | Variable EAD where permitted | Drawdown behavior before default | Can materially change capital and pricing |
| Overdrafts | Product-specific treatment | Breach of advised limit and repayment behavior | Exposure can rise quickly near default |
| Guarantees and letters of credit | Prescribed or modeled conversion | Likelihood of claim or draw | Off-balance-sheet risk enters EAD through CCF |
The trade-off is clear. Fixed factors reduce model risk and implementation cost, but they can obscure differences between facilities. Variable models improve segmentation and pricing precision, yet they create a larger burden for data lineage, validation, stress testing, monitoring, and supervisory explanation.
Credit committee rule: use a variable EAD model only when the bank can explain the data behind every important assumption. Otherwise, a transparent conservative factor is safer than false precision.
The path that performs better under stress isn't automatically the more complex one. A fixed factor may remain stable when utilization behavior changes abruptly. An internal model may respond more accurately if its downturn data captures how borrowers draw before default. Bank leaders should judge both paths by capital stability, loss forecasting quality, and decision usefulness, not by model complexity alone. Banks reviewing model design can also use a structured credit risk modeling framework to connect assumptions with portfolio decisions.
A Practical Example of EAD on a Revolving Commercial Line
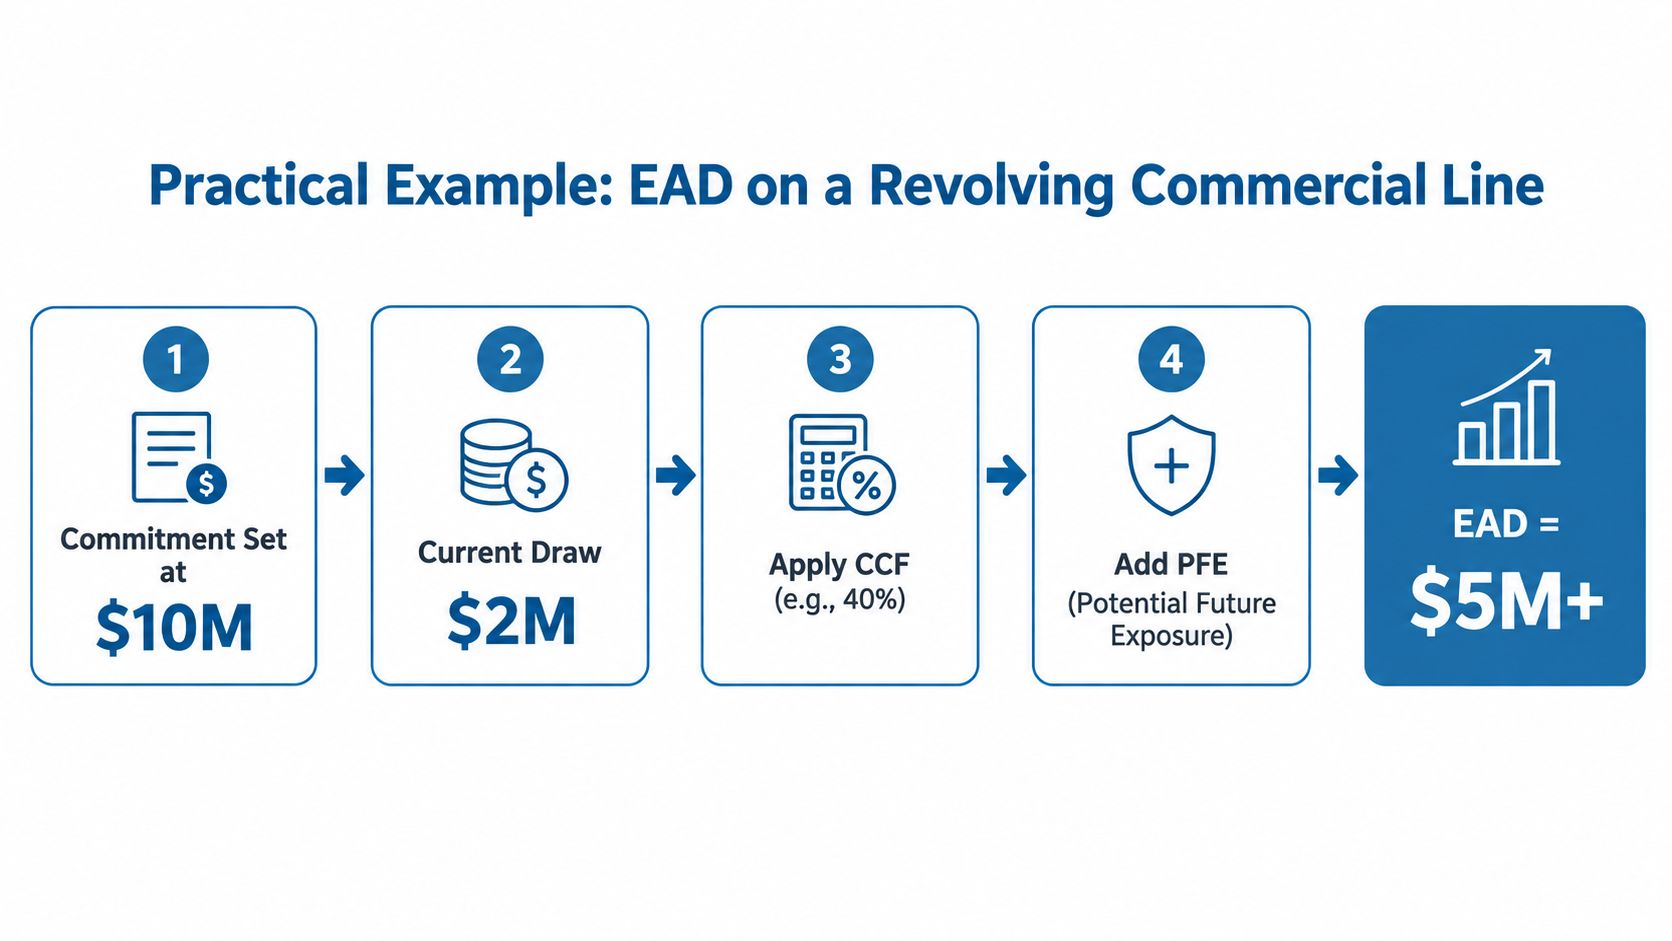
A commercial borrower receives a $10 million revolving line and initially draws $2 million. The bank therefore has $8 million of unused availability. Suppose the facility's applicable CCF is 40%. The expected future draw is $3.2 million, producing an initial EAD of:
$2 million + ($8 million × 40%) = $5.2 million
The bank's EAD is therefore more than twice the current drawn amount. That difference should flow into the credit decision, not appear later as a model surprise.
Watch the facility through the stress point
Mid-year, utilization rises to 70% of the commitment. The drawn balance becomes $7 million, leaving $3 million undrawn. If the same 40% CCF applies to the remaining availability, the EAD becomes:
$7 million + ($3 million × 40%) = $8.2 million
The drawn balance has increased by $5 million, but the EAD has increased by $3 million because the remaining undrawn component has become smaller. The bank's expected exposure at default still rises substantially, and expected loss rises with it because EAD multiplies PD and LGD.
A credit officer can replicate the analysis on any live deal:
- Identify the legal commitment.
- Confirm the current drawn balance.
- Calculate unused availability.
- Apply the relevant CCF.
- Add the CCF-adjusted amount to the drawn exposure.
- Recalculate when utilization, covenants, or limits change.
The Basel standardized approach defines defaulted exposure as one past due for more than 90 days, or an exposure to a defaulted borrower. It also treats an overdraft as past due when the customer breaches an advised limit or is told to use a limit smaller than current outstandings, according to the Basel standardized credit-risk treatment.
Tie EAD to capital, not just loss
The capital impact depends on the applicable risk-weight function, PD, LGD, exposure class, and capital ratio. If the bank uses a 10% total capital ratio for internal planning, the capital requirement is calculated from the relevant risk-weighted assets, not by multiplying EAD by 10%. Executives should reject any dashboard that presents EAD without showing the associated RWA and capital consequence.
Covenant design matters here. A step-down mechanism, tighter availability after a covenant breach, or a commitment sized to seasonal rather than peak demand can prevent a low-utilization facility from becoming a large default exposure. The right structure protects growth because it preserves capacity for borrowers who can use it without forcing the bank to carry unpriced contingent risk.
Why EAD Is a Sales and Relationship Decision, Not Just a Risk Output
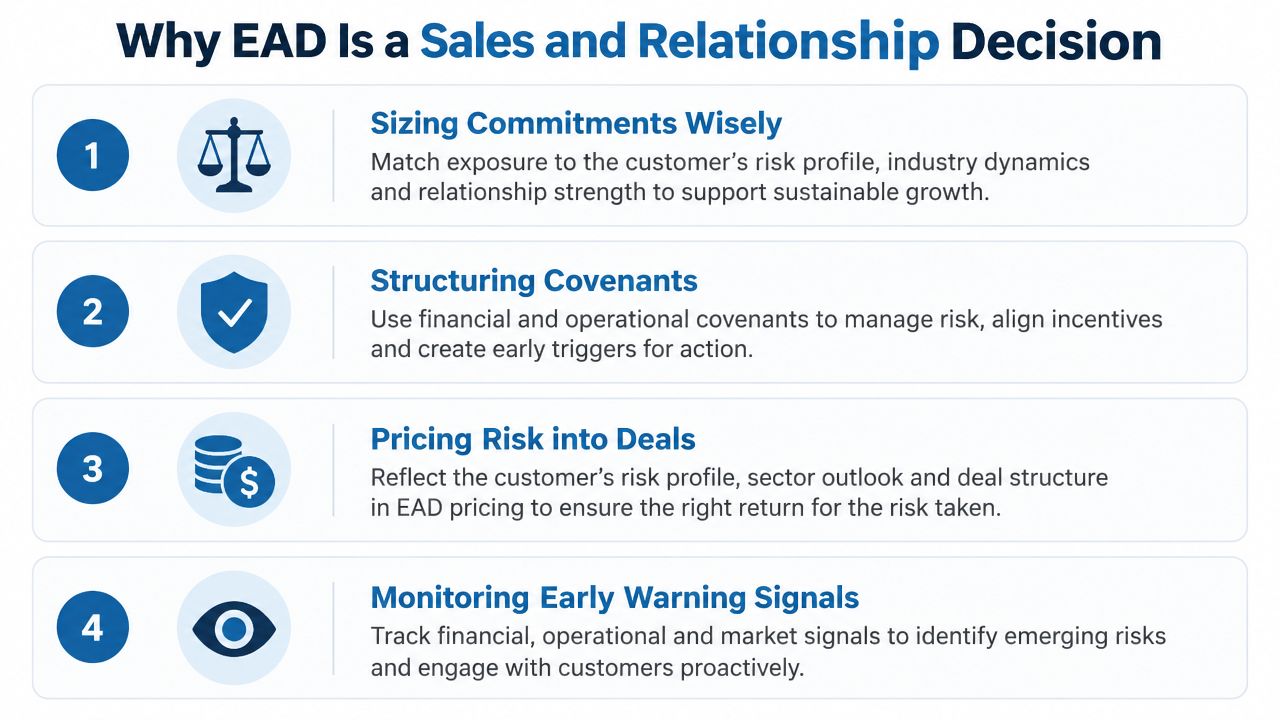
Relationship managers influence EAD before a model ever calculates it. They negotiate the commitment size, tenor, borrowing-base mechanics, covenant package, pricing grid, renewal terms, and availability conditions. Product heads decide whether unused capacity is treated as a retention feature, a sales concession, or a separately priced liquidity option.
That makes EAD a growth-and-discipline metric. A bank that rewards teams solely for committed volume can encourage large unused lines with weak economic returns. A bank that prices and manages contingent exposure can grow the same relationship with better control over capital consumption.
The deal structure changes the economics
Take a $10 million revolver with a $2 million current draw and a 40% CCF. The resulting EAD is $5.2 million. If the bank reduces the undrawn commitment by $2 million, while keeping the current draw unchanged, the undrawn amount falls from $8 million to $6 million. The EAD becomes:
$2 million + ($6 million × 40%) = $4.4 million
The change reduces EAD by $0.8 million without forcing the borrower to repay the current balance. That can reduce expected loss and capital usage, depending on the applicable capital treatment. It may also improve return on risk-weighted assets if pricing remains appropriate.
The bank can achieve a similar effect through structure rather than a blunt limit cut. A covenant step-down can reduce availability after a defined deterioration in liquidity. An amortization trigger can lower the commitment as the borrower's seasonal need recedes. A utilization-linked pricing grid can charge more for persistent draws and encourage the borrower to treat liquidity as a priced resource.
Put commercial incentives beside risk controls
Sales teams need visibility into more than current utilization. They should see unused commitment, historical draw patterns, covenant status, renewal timing, and the facility's effect on capital. Treasury and relationship teams should understand whether a line holds real value for the client or is too large because the bank wanted to win the mandate.
Commercial principle: a commitment is a product with a balance-sheet cost, even when the borrower hasn't drawn it.
Banks that connect these facts can make better decisions at origination and renewal. They can offer capacity where it supports profitable client activity, tighten terms where behavior signals stress, and avoid confusing a large headline commitment with high-quality growth.
Data, Modeling, and Governance Required to Act on EAD
Credible EAD starts with facility-level history. Monthly portfolio snapshots aren't enough if they don't show how each borrower used the line before default. Without draw history linked to default outcomes, a CCF is an assumption dressed up as a model.
A practical data set should include:
- Drawn and undrawn history: Track balances and availability through the life of each facility.
- Limit changes: Record increases, reductions, cancellations, renewals, and temporary overlines.
- Facility attributes: Store product type, segment, maturity, currency, collateral, and commitment terms.
- Credit events: Link covenant trips, restructurings, delinquency, default, and charge-off outcomes to the facility.
- Utilization at default: Preserve the exposure state at the relevant default event, including related fees and contingent components.
- Stress behavior: Test whether borrowers draw more aggressively as liquidity and credit quality deteriorate.
Internal outcomes should cover a sufficiently long observation window to represent different credit conditions. The verified data requires banks to estimate EAD for each exposure under IRB and to maintain floors and treatment rules that prevent modeled exposure from falling below defined on-balance-sheet amounts.
Governance has to reach the business
Model documentation should explain segmentation, observation windows, CCF definitions, exclusions, overrides, and downturn adjustments. Independent validation should use challenger approaches and out-of-time backtesting. A named owner should be able to defend the number to supervisors, model-risk committees, finance, and the business.
Monitoring can't stop at annual validation. Management should review utilization drift, limit growth, covenant behavior, overrides, data breaks, and segment-level forecast error on a recurring basis. EAD inputs should feed loan pricing, RAROC, limit setting, stress testing, allowance processes, and active portfolio management.
A bank can reduce manual rekeying by using standardized counterparty, facility, regulatory, market, and people data in connected workflows. Visbanking provides bank-performance benchmarking, exposure-related intelligence, APIs, alerts, and exportable analytics that can support portfolio and pricing workflows. Whatever technology a bank selects, its model risk management framework must preserve traceability from source data to decision.
The practical standard is demanding but clear: every material CCF should have an owner, evidence, a challenger, a stress view, and a documented connection to capital and commercial decisions.
Executive Takeaways and How to Benchmark Your Exposure Data
Three conclusions belong in the executive review pack.
First, EAD is a commercial lever. Relationship managers and product teams shape it through commitment sizing, covenant design, availability, tenor, and pricing. Risk teams measure the result, but origination decisions create much of the exposure.
Second, the gap between drawn balance and EAD is where hidden risk and hidden return live. A portfolio report that ranks clients by current balances but ignores undrawn commitments can distort pricing, concentration analysis, limit allocation, and capital planning. Banks should manage unused exposure actively, especially in revolving, trade-finance, guarantee, and contingent-liquidity products.
Third, credible EAD requires disciplined data and benchmarking. Compare utilization, drawdowns, limit changes, covenant events, and default outcomes by product and borrower segment. Then challenge whether your CCFs reflect actual behavior or merely reflect legacy assumptions.
Executives should ask management to identify the facilities where current utilization is low but potential exposure is high, the products with weak draw-history data, and the pricing decisions that ignore capital consumed by unused commitments. Those questions turn EAD from a regulatory input into a practical growth-control mechanism.
Visbanking helps banks compare performance, exposure, utilization, and relationship data across institutions and segments, then connect those signals to portfolio, pricing, and growth decisions. Visit Visbanking to benchmark your exposure assumptions and explore data workflows that make EAD more actionable.
Latest Articles

Brian's Banking Blog
Automated Alerts and Notifications for Banks
Brian's Banking Blog
Customer Feedback Loop for Banks: A Practical Playbook

Brian's Banking Blog
Commercial Lending Trends: What Bank Executives Must Know

Brian's Banking Blog
Bank Marketing Dataset Analysis Strategy

Brian's Banking Blog
ESG Peer Benchmarking for Bank Leaders
Brian's Banking Blog