
Data Integration Example for Banks That Drives Decisions
Brian's Banking Blog
A board asks a straightforward question: How is our bank performing against comparable institutions, and where should we pursue the next relationship? The answer should be available quickly. Instead, one team has Call Report data, another has HMDA files, a business-development group works from UCC filings, and relationship managers rely on core-system records. Each source may be accurate in isolation, yet the institution still lacks one consistent view.
That delay isn't merely inconvenient. It weakens peer analysis, slows outreach, and makes risk discussions harder to explain. A sound data integration example shows how banks can connect regulatory, market, public-record, and internal data without losing the identifiers, definitions, and quarter-end lineage that make the analysis defensible.
Introduction Why Banking Decisions Stall Without Integrated Data
A director doesn't usually ask for another dashboard. The question is about action: whether loan growth is keeping pace with peers, which commercial prospects have meaningful borrowing relationships elsewhere, or whether a change in credit mix deserves attention. Answering requires more than collecting files. It requires linking facts that were created for different purposes and reported on different schedules.
Consider a hypothetical regional bank reviewing its commercial strategy. The finance team can see regulatory performance, the lending team can see internal balances, and business development can find UCC filings that indicate secured business assets. HMDA can add a view of mortgage activity. But if the records don't resolve to the same institution, market, product, and reporting period, executives receive several partial narratives rather than one decision-ready picture.
The central idea is simple: integration turns disconnected records into governed analytical context. It preserves the original source, standardizes definitions, resolves entities, and makes the path from a board-level conclusion back to a source record visible. That matters in banking because a result must be explainable to directors, auditors, risk committees, and operating teams.
Executive test: If a number changes, your team should be able to explain which source changed, which identifier connected it, which transformation was applied, and which reporting period it represents.
This guide uses banking-specific sources to show how that works in practice. It covers the meaning of integration, the choice between batch and selective real-time patterns, an identifier-bridging workflow across FDIC Call Reports, FFIEC UBPR, HMDA, UCC, and core data, and the controls needed after go-live. The objective isn't to make every feed instantaneous. It's to make important decisions faster without sacrificing lineage, consistency, or trust.
What Data Integration Means in Banking
A bank's systems often resemble separate filing cabinets. One cabinet contains regulatory financials, another holds customer and account records, and others contain public lending or collateral information. A reporting tool may place charts on top of those cabinets, but a dashboard alone doesn't create a reliable connection between them.
Data integration is the disciplined process of bringing those records together into a governed analytics layer. The work normally includes four activities:
- Extract the source records. Retrieve files, API responses, database tables, or event messages while retaining source metadata and reporting dates.
- Transform the records. Clean formats, standardize names and units, handle missing values, and apply documented business rules.
- Resolve identity. Determine which records refer to the same bank, organization, market, customer, or relationship.
- Harmonize meaning. Align definitions so that similarly named fields aren't treated as equivalent when their business meanings differ.
The fourth step separates serious integration from simple file movement. If one system defines a balance at quarter-end and another reflects an intraday state, joining them without a time rule creates a misleading comparison. If two systems use different names for the same institution, joining on name alone can duplicate or omit records.
The banking identity problem
The FDIC public bank-data API exposes over 1,100 quarterly Call Report variables, and the FDIC ecosystem pairs financial information with institution metadata, including names, locations, events, and historical or failure data, as described in the FDIC bank-data integration example. A pipeline can use a quarter-end identifier to connect those financial facts to master-bank records, then normalize the result for peer benchmarking, trend analysis, and risk monitoring.
That process is called entity resolution. It answers a foundational question: are these two records about the same institution? The answer should rely on durable identifiers and documented matching rules, not an analyst's judgment while preparing a spreadsheet.
Integration versus reporting
Reporting summarizes data that has already been organized. Integration establishes the organization itself. A bank can build a polished report from inconsistent tables, but the visual quality won't correct a broken join, conflicting field definition, or missing period.
The practical mental model is a single governed layer with three properties:
- Identity is stable. Records connect through authoritative identifiers.
- Meaning is consistent. Definitions and transformations are documented.
- Lineage is preserved. Users can trace an analytical value to its source and reporting period.
Core Patterns and Architectures Behind a Data Integration Example
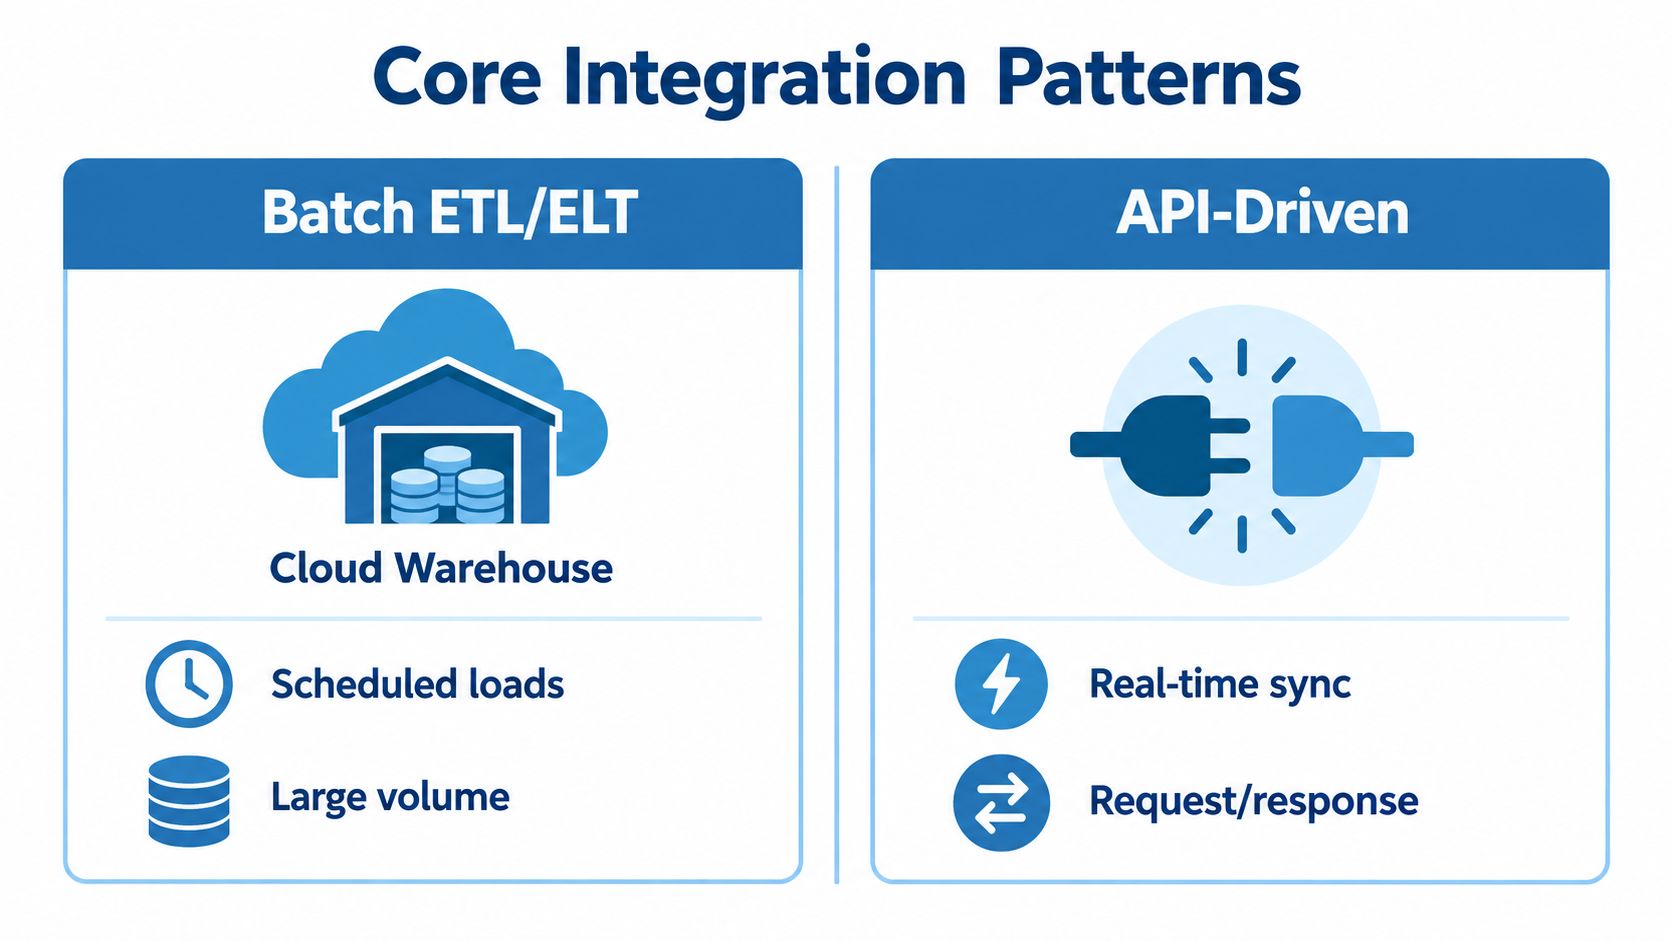
The right architecture depends on the decision, not on the novelty of the technology. A quarterly peer benchmark doesn't need the same delivery pattern as a fraud alert or a relationship-management trigger. Banks should match latency to business value, then evaluate auditability, operating cost, and failure modes.
| Pattern | Best For | Latency and Tradeoff |
|---|---|---|
| Batch ETL or ELT | Regulatory files, periodic benchmarking, historical analysis | Delivers scheduled, repeatable loads. It is easier to reconcile and govern, but it won't support decisions that depend on immediate changes. |
| API-driven integration | On-demand lookups, application workflows, targeted enrichment | Retrieves current information when requested. It can reduce unnecessary movement, but availability, authentication, and response behavior require active management. |
| Change-data capture | Database updates that should flow into downstream systems | Captures changes without repeatedly moving full tables. It adds operational complexity and requires careful handling of deletes, ordering, and replay. |
| Event streaming | Decisions where event timing changes the outcome | Supports continuous processing. It can become fragile and expensive when applied to workflows that gain little from sub-minute freshness. |
The practical distinction is between scheduled truth and operational immediacy. Call Report and peer-analysis workflows generally center on reporting periods, source availability, and reconciliation. A relationship-management workflow may benefit from an API lookup. A transaction or account event may justify CDC or streaming when a rapid response changes the decision.
Recent guidance makes the same tradeoff explicit. Multiple 2026 sources recommend using CDC or streaming only where sub-minute latency changes decisions, while using batch elsewhere to reduce cost, fragility, and tool sprawl, as discussed in guidance on data integration challenges. Faster data isn't automatically more useful data.
A decision rule for executives
Start with the decision's clock. Ask when the information becomes actionable, how much delay the business can tolerate, and whether the result must be reproduced for audit or review. Then choose the least complex pattern that satisfies those requirements.
Cloud warehouse design also matters. Teams evaluating storage, modeling, and governance choices can use data warehouse architecture principles as a reference while defining the analytical layer. For implementation teams, guidance on building data pipelines can help translate the pattern into ingestion, transformation, testing, and delivery stages.
A bank should also resist a common architectural mistake: treating real-time as a default requirement. Selective real-time integration often produces a more defensible operating model because it concentrates complexity where it can affect revenue, risk, or service outcomes.
A Banking Data Integration Example From Source to Decision Ready Analytics
A useful banking integration example begins with a question, not a source list. Suppose a bank wants to identify markets where peer institutions are gaining commercial momentum and determine whether those institutions have relationships or signals worth pursuing.
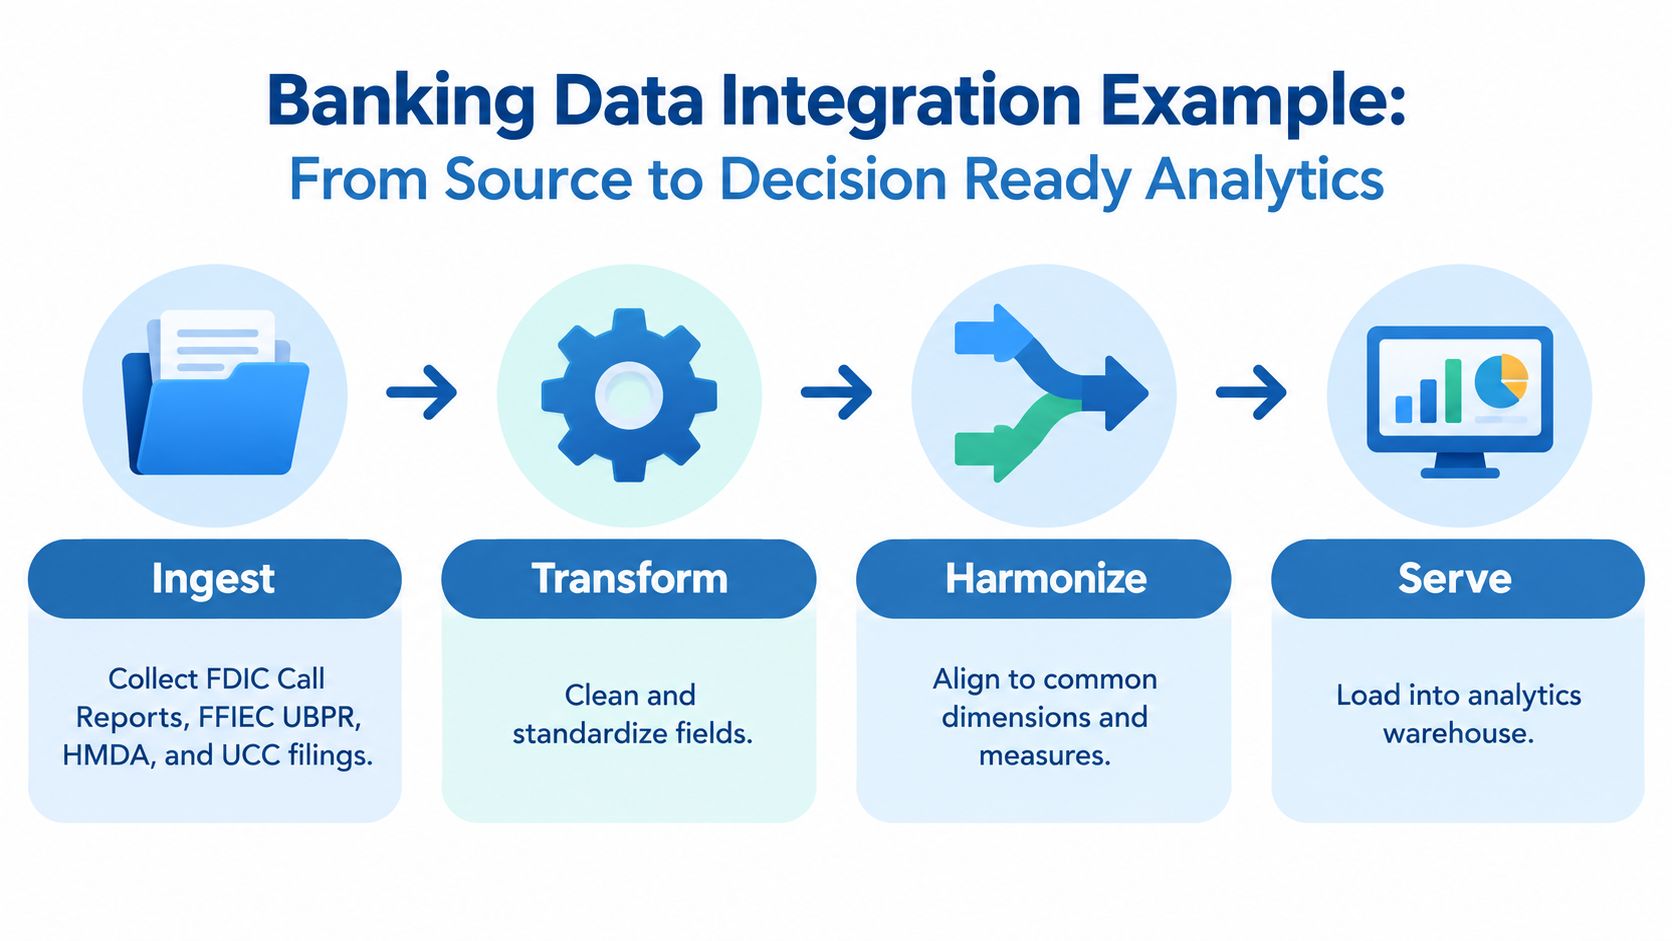
The pipeline ingests FDIC Call Reports, FFIEC UBPR data, HMDA, UCC filings, and internal core data. Each source contributes a different perspective. Call Reports provide regulatory financial facts. UBPR organizes quarterly performance analysis and peer context. HMDA adds mortgage-lending information. UCC filings can reveal secured business activity. Core data shows the bank's own customers, balances, products, and relationship history.
Step one is identifier bridging
The pipeline first creates a reference layer for institution identity. The FFIEC and FDIC materials describe quarterly Call Reports and bulk API data, while institution attributes include RSSD, FDIC certificate, OCC charter, name, city, state, address, and filing type. Raw Call Report schedules are keyed by IDRSSD, making identifier bridging the mechanism that connects regulatory schedules to institution records and downstream analytics, as documented in the Call Report data-source attributes guide.
The reference layer stores the source identifier, institution identifier, effective period, and match status. A bank name can change, an address can change, and an organization can have multiple records across sources. The pipeline should preserve those changes rather than overwrite them in a way that destroys historical interpretation.
Step two preserves the quarter-end relationship
The integration assigns every periodic record to its reporting period before joining sources. This prevents a current institution attribute from being attached to an earlier regulatory observation. It also makes quarter-over-quarter lineage explicit, so an executive reviewing a trend can distinguish a real performance change from an identity or timing error.
The transformation layer then standardizes field names, units, geographic values, product categories, and missing-value conventions. HMDA and UCC records aren't forced into the same shape as Call Reports. Instead, each source retains its native facts while sharing common dimensions such as institution, geography, reporting period, and relationship.
Step three makes the output useful
The final analytics layer can answer questions that siloed systems can't answer cleanly:
- Peer performance: Compare a bank's regulatory measures with defined peer groups and historical periods.
- Market opportunity: Combine geographic lending signals with internal coverage and relationship records.
- Relationship prioritization: Connect public business activity to institution and market context before a banker begins outreach.
- Risk review: Flag changes that warrant investigation, while preserving the source records behind the signal.
A migration partner can support this type of work when legacy systems, file formats, or historical tables require specialized extraction and reconciliation. For example, Refact's data migration services provide relevant context for planning the movement and validation of inherited data.
The result isn't a larger dataset. It is a governed view in which each insight has an institution identity, a period, a source, and a transformation history. That combination lets executives move from “What happened?” to “Which action follows, and can we defend the reasoning?”
Why Integrations Fail After Go Live and How to Keep Them Trustworthy
A pipeline can run successfully and still produce unreliable intelligence. The difficult work often begins after the first successful load, when source systems change, definitions diverge, and users ask questions the original design didn't anticipate.
Recent coverage identifies recurring problems including schema drift, duplicate events, event-time versus processing-time mismatches, missing data contracts, backfill and replay complexity, and lineage gaps, as discussed in common data integration problems. These failures are especially serious in regulated environments because contradictory customer, account, transaction, or institution views can influence decisions and complicate review.
The seams deserve more attention than the connections
Schema drift occurs when a source adds, removes, renames, or changes a field. Duplicate events can inflate activity if the pipeline lacks a stable event identifier and idempotent processing. Event time describes when something happened, while processing time describes when the system received it. Confusing the two can place a late-arriving record in the wrong analytical period.
Semantic inconsistency creates a quieter problem. Two fields may share a name but represent different concepts, or two teams may apply different rules to “active relationship,” “peer,” or “quarter-end.” The system still produces output, but users stop trusting the result when reports disagree.
Controls that preserve confidence
A trustworthy integration needs controls designed into the operating model:
- Data contracts: Define required fields, types, allowed values, ownership, and change-notification expectations for each source.
- Identity controls: Maintain crosswalks, effective dates, match confidence, and exception queues instead of forcing uncertain matches.
- Reconciliation checks: Compare expected and received records, totals, period coverage, duplicates, and rejected rows.
- Lineage records: Store source file or endpoint, ingestion time, reporting period, transformation version, and downstream dataset.
- Replay procedures: Make backfills repeatable and idempotent, so corrected history doesn't create duplicate facts.
- Observability: Monitor freshness, completeness, schema changes, failed tests, and downstream usage. A practical framework for this discipline appears in Visbanking's data observability guidance.
Practical rule: A pipeline isn't production-ready until an owner can identify what changed, assess the affected decisions, and restore a trusted version without rebuilding the entire history.
Trust also requires business ownership. Technology teams can monitor delivery, but finance, risk, lending, and relationship leaders must define whether a measure is meaningful. That shared accountability turns integration from a recurring repair exercise into a controlled analytical capability.
Implementation Considerations for Regulated Banks
Banking data arrives according to regulatory calendars and source-specific operating realities. A pipeline can't promise decision freshness that the source itself doesn't provide. Bulk Call Report data becomes available beginning 45 calendar days after the report date, with the full quarter available in tab-delimited or XBRL formats, according to the FFIEC data availability guidance.
That timing should shape the service-level agreement. The bank can schedule ingestion around expected availability, run completeness checks before publishing peer comparisons, and label datasets clearly when a reporting period isn't complete. The FFIEC public system supports bulk downloads by product, reporting period end date or calendar year, and file format, which makes repeatable collection more practical than manual retrieval from individual filings, as described in the FFIEC bulk-data download instructions.
Design around the source calendar
Call Reports are filed at quarter-end, while internal systems may update continuously. HMDA and UCC data have their own publication and processing patterns. The integration should preserve each source's native timing, then expose a common analytical calendar rather than pretending every record represents the same moment.
UBPR adds another important consideration. The FFIEC describes it as a multi-page financial analysis built from quarterly Call Report data, with five separate periods of time in each report. Its dollar values, ratios, peer-group averages, and percentile rankings are computed from those quarterly filings, as explained in the FFIEC UBPR FAQ. A bank should therefore treat UBPR as a derived analytical product with its own lineage, not as an unrelated scorecard.
For the first quarter of 2026, completed Call Reports were due electronically no later than 30 days after March 31, 2026, which meant April 30, 2026 for most institutions. Banks with more than one foreign office received an additional five calendar days, moving the deadline to May 5, 2026, according to the FDIC first-quarter filing letter.
Scope the implementation before selecting tools
Executives should require answers to four questions:
- Decision scope: Which decision will improve first, peer benchmarking, prospecting, portfolio review, or risk monitoring?
- Source authority: Which system owns each field, and how will conflicts be handled?
- Control design: What checks block incomplete or contradictory data from reaching users?
- Delivery path: Will teams consume the result through a warehouse, API, dashboard, CRM, export, or several channels?
The best initial release is narrow enough to govern and useful enough to influence a real meeting. Banks can add sources after the identity model, period logic, and quality controls have earned user confidence.
Turning Integrated Data Into Action With Visbanking
Integration creates value when a banker can act on the answer without reconstructing it from separate systems. A unified analytical layer can support bank-performance benchmarking, relationship mapping, market prioritization, and risk review while retaining the source and period context behind each result.
Visbanking's Bank Intelligence and Action System, or BIAS, unifies financial, regulatory, market, and people data into explainable analytics. Its Bank Performance application supports peer benchmarking and historical trend analysis across 4,600+ institutions, while other modules support prospect research, professional-relationship analysis, and predictive risk and performance signals. The platform's production data pipelines, entity resolution, observability, feature stores, secure APIs, and export options address the operational requirements discussed above. More detail is available in the unified analytics platform.
The executive question is not whether the bank has more data. It is whether the institution can connect the right records, at the right period, with enough lineage to act confidently. Start with one decision, define the identifiers and timing rules, select batch or selective real-time delivery based on business value, and measure whether teams can move from analysis to action without manual reconciliation.
Visbanking helps banks unify regulatory, market, public-record, and internal intelligence into decision-ready analytics for benchmarking, prospecting, and risk oversight. Visit Visbanking to benchmark your institution, explore harmonized bank data, and identify where integrated intelligence can improve the next executive decision.
Latest Articles

Brian's Banking Blog
ISO 20022 Migration Strategy for Bank Leaders

Brian's Banking Blog
Lead Tracking Software for Banks: An Executive Guide

Brian's Banking Blog
What Are Key Metrics for Banks? a Decision Guide

Brian's Banking Blog
Customer Feedback Surveys: A Playbook for Banks

Brian's Banking Blog
How to Create a Dashboard That Banks Actually Use

Brian's Banking Blog