
Commercial Real Estate Intelligence for Bank Leaders
Brian's Banking Blog
Approximately $875 billion in commercial and multifamily mortgages are projected to mature in 2026, including roughly $396 billion held by depository institutions, according to Matthews' analysis of the capital reset. For bank directors, the actionable question isn't how large the maturity wall is. It's which borrowers will need additional equity, which relationships the bank should retain, and which credits require intervention before refinancing becomes urgent.
Commercial real estate intelligence should answer those questions, not merely describe the market. Its value is a defensible action list tied to capital, credit policy, and relationship ownership.
What Commercial Real Estate Intelligence Covers
U.S. commercial banks held approximately $3,038.7 billion in commercial real estate loans in October 2025, including about $2,926.8 billion at domestically chartered banks, according to the Federal Reserve's bank assets and liabilities release. That makes CRE intelligence a balance-sheet discipline, not a specialized market report.
Commercial real estate intelligence is the continuous collection, reconciliation, and interpretation of property, market, borrower, and regulatory data so a bank can price, underwrite, and monitor CRE exposure before losses appear in reported results. A dashboard reports the weather. Intelligence tells you whether to cancel the sailing trip.
For executives, that distinction separates information production from risk management. An attractive chart of office vacancy doesn't establish whether the bank should renew a particular loan. The decision requires the property's income, the borrower's obligations, the sponsor's liquidity, and the bank's remaining capacity for that exposure.
Four layers behind a banking decision
- Property and market fundamentals: Vacancy, rents, absorption, lease expirations, and competing supply establish whether operating assumptions remain credible.
- Capital markets: Transaction prices, available financing terms, and maturity schedules help assess exit options.
- Borrower and sponsor information: Debt-service coverage, liquidity, guarantees, and equity invested identify who can absorb a shortfall.
- Bank-side information: Call reports, concentration ratios, delinquencies, and criticized assets connect individual transactions to institutional capacity.
The layers matter because they answer different questions. A well-leased property can still face a financing gap. A liquid sponsor may support a temporarily weak asset, while a heavily committed sponsor may struggle to support an otherwise attractive building.
Turn exposure into a decision
Consider two institutions with similar CRE production. Comparing dollar growth alone won't show whether one bank is consuming capital faster, lending into weaker submarkets, or adding exposure to sponsors already represented elsewhere in its portfolio.
Normalize the comparison by capital, assets, loan category, geography, and peer group. Then require management to identify the decision associated with each material exception.
Director's test: If an intelligence report doesn't change pricing, covenants, collateral requirements, relationship strategy, or production limits, it may be reporting activity rather than supporting a decision.
That test also prevents indiscriminate tightening. The objective isn't to label CRE as good or bad. It's to distinguish exposures the bank can support from exposures whose structure no longer compensates it for the risk.
Data Sources That Turn Filings Into Signals
Core CRE data sources and what each reveals
| Source | What It Reveals | Best Use |
|---|---|---|
| FDIC Call Reports | Bank balance sheets, CRE loans, and capital | Concentration and peer benchmarking |
| FFIEC and UBPR | Standardized bank ratios and multi-quarter trends | Peer comparison and trend analysis |
| NCUA 5300 | Credit union financial condition and lending | Credit union CRE exposure |
| SEC and EDGAR | Listed REIT and public borrower filings | Sponsor and borrower leverage |
| UCC filings (multi-state) | Liens and secured debt on borrower collateral | Collateral conflicts and competing lenders |
| BLS and BEA | Employment, income, and output by region | Local demand and submarket risk |
| SBA PPP, 7(a), and 504 | Small business and owner-occupied lending | Owner-occupied and mixed-use exposure |
| MSCI RCA CPPI | Repeat-sales price momentum | Checks on stale appraisals |
No single source can establish the bank's full exposure. Regulatory filings describe an institution, public-company filings describe disclosed corporate obligations, and property records describe specific collateral. Analysts have to reconcile those perspectives before interpreting the result.
Use the source that matches the question. Call reports support concentration analysis, but they don't establish an individual borrower's liquidity. UCC records can flag secured-credit relationships, but analysts still need the underlying documents and legal review to determine priority and collateral scope.
Read transaction signals alongside appraisals
In April 2025, the U.S. national all-property index declined 0.8% year over year, according to MSCI's RCA Commercial Property Price Index report, which describes its repeat-sales regression methodology. Following properties that transact more than once provides a transaction-based check on valuation assumptions rather than relying solely on appraisals.
That doesn't make an index a substitute for a property valuation. The index may cover a broader geography or a different mix of assets than the bank's collateral. Use it to challenge assumptions and determine where updated property-level work is necessary, not to apply an automatic haircut to every loan.
Public borrower analysis needs similar discipline. Our explanation of SEC EDGAR provides context for locating corporate disclosures, but the analyst must still distinguish property-level debt from parent-company obligations and identify guarantees rather than assume them.
Build a traceable evidence chain
For developers assembling property-listing inputs, RealtyAPI.io's Loopnet data endpoint for developers is a resource to evaluate alongside the bank's licensing, coverage, and validation requirements. Listing information can support comparable-property research, but asking terms aren't evidence of an executed sale or lease.
Preserve the distinction between observed facts and analyst judgments:
- Observed: A reported balance, recorded lien, executed lease, or completed transaction.
- Derived: A concentration ratio, normalized operating income, or estimated financing gap.
- Assumed: A future capitalization rate, renewal probability, or refinancing spread.
Visbanking pulls data directly from regulatory filings, including FDIC, NCUA, and FFIEC filings. That supports auditability, but the bank must still preserve reporting dates, field definitions, and reconciliation rules when combining those records with borrower information.
The executive takeaway is source discipline: a finding is only as useful as the evidence supporting the specific banking decision.
Why Market Averages Hide Regional and Property Risk
Global commercial real estate investment volume fell by nearly half in 2023, and that single number conceals more than it reveals for a lender deciding where to keep lending.
2023 CRE investment volume by market and period
| Market or Period | Change Year over Year | Volume |
|---|---|---|
| Global, full year 2023 | -47% | About US$647 billion |
| Americas, full year 2023 | -50% | About US$375 billion |
| Global, second quarter 2023 | -57% | US$142 billion |
| Global, fourth quarter 2023 | -37% | US$157 billion |
CBRE's review of global investment activity reports these declines and, at the time, forecast a +7% rebound in global investment for 2024. Two observations matter for credit policy. The Americas contracted more sharply than the global total. And the quarterly swing within a single year means a full-year average already lags the market a credit committee is weighing.
Volume is a liquidity measure. It counts completed transactions, so a steep decline reflects fewer willing buyers and sellers rather than a uniform drop in the value of every standing property.
Separate liquidity from valuation
Higher borrowing costs reduce the debt a property's income can support. Buyers need more equity or a lower acquisition price, while sellers resist recognizing a lower value. That standoff suppresses transactions, and it makes the surviving comparable sales less representative of the broader market.
For a bank, thin transaction volume is an evidence problem before it is a pricing problem. A recent appraisal may rest on deals negotiated under cheaper financing, and the handful of completed sales may reflect distressed sellers or one-off circumstances. The concrete response: when comparables are scarce, ask which side of the bid-ask gap each sale represents, and tighten advance rates where the evidence is weakest.
Office-market evidence shows why property-level analysis is required. U.S. office vacancy reached approximately 19% in the first quarter of 2024, exceeding prior recession highs, according to the Real Estate Roundtable's industry compilation, citing the Federal Reserve Bank of St. Louis and CBRE.
Vacancy reaches the balance sheet through the cash-flow statement. Lost rent, concessions, tenant improvements, and leasing commissions reduce the cash available for debt service well before a reappraisal changes the collateral value on paper. A borrower whose rent roll is thinning is a candidate for refinancing outreach or tighter covenants now, before the maturity date sets the terms of the conversation.
Local evidence must earn its place
A local valuation discussion, such as INTELLI on Austin commercial valuations, can help frame the submarket questions an analyst should investigate. Verified comparables, current leases, and a bank-approved valuation process remain the evidence base for the credit decision.
A useful executive comparison pairs:
- Capital availability with the financing assumptions used in underwriting.
- Leasing fundamentals with the borrower's rent roll and renewal schedule.
- Transaction evidence with the collateral's location, condition, and tenancy.
The 2024 forecast cited above was an aggregate expectation, covering no individual region or property category. Set lending appetite using the bank's actual collateral mix, then translate the finding into action: where to tighten advance rates, where to commission updated valuations, and where refinancing outreach is justified this quarter.
Refinancing Risk Loan by Loan, Not Sector by Sector
Treating office or multifamily as a single risk category confuses asset classification with repayment capacity. The decisive question is whether a specific loan can refinance under the applicable interest rate, debt yield, valuation, amortization, and loan-to-value constraints.
In its forward-looking refinancing analysis, Trepp's quarterly data review estimates that 75% of maturing Class A CMBS office loans could require fresh equity, compared with 61% of Class B/C loans; it also estimates that about 43% of roughly $160 billion in apartment loans maturing over the following year could require additional cash at current rates, with banks holding approximately $84 billion of that apartment debt. These are conditional estimates for the populations analyzed, not observed default rates or a forecast for an individual bank's portfolio.
The implication is narrower, and more useful, than a sector-wide warning: higher property quality doesn't guarantee a financeable capital structure. Acquisition basis, debt load, income, and financing terms can outweigh a building's classification.
A hypothetical refinancing gap
Assume a bank holds a $20 million loan secured by a property producing $1.44 million in annual net operating income. With annual debt service of $1.20 million, coverage is 1.20x.
Now assume proposed refinancing terms raise annual debt service to $1.60 million. With unchanged income, coverage falls to 0.90x. This is a financing problem even if tenants keep paying rent.
Suppose an updated valuation supports $28 million, and the proposed lender permits 65% loan-to-value. The value-based proceeds ceiling is $18.2 million, leaving a $1.8 million equity requirement, before fees, reserves, or other closing costs.
Those figures are hypothetical assumptions and arithmetic, not market observations. They show why the analyst must calculate both the value-based ceiling and the proceeds available under the lender's debt-service requirement, then use the more restrictive result.
A borrower's willingness to contribute equity isn't the same as its ability to contribute equity. Verify available liquidity and competing commitments before treating sponsor support as a repayment source.
Distinguish time from insolvency
Extension risk exists when the borrower needs additional time to complete leasing, sell an asset, or arrange capital, with a credible and documented path to repayment. An extension can be reasonable, but it should have milestones, reporting requirements, and a clear rationale.
Default risk requires a different response when sustainable income and available sponsor resources cannot support the obligation. Merely moving the maturity date doesn't close that gap.
Require the refinancing model to expose its assumptions:
- Rate and amortization: Calculate debt service using the proposed structure, not the expiring loan's payment.
- NOI and capitalization rate: Separate operating deterioration from valuation sensitivity.
- LTV and debt yield: Apply both constraints and identify the binding limit.
- Sponsor concentration: Aggregate guarantees, equity commitments, and maturities across related properties.
The relationship manager's output should state the estimated equity need, the likely source of that equity, and the date by which the bank needs a decision. That's more actionable than a sector risk score.
Underwriting New Loans With Market Intelligence
A hypothetical $30 million multifamily loan against a $46.15 million appraisal begins at approximately 65% LTV. Assume relevant submarket transaction evidence supports a 5% lower value, or about $43.8 million.
The same loan would then represent approximately 68.5% LTV. At a hypothetical 65% policy limit, maximum proceeds would be about $28.5 million, requiring a smaller loan or additional sponsor equity.
Test both repayment and exit
A starting 1.30x debt-service coverage ratio isn't sufficient if the proposed stressed payment would push coverage toward 1.00x. Calculate the payment explicitly and compare it with sustainable NOI, excluding unsupported rent increases.
For a separate valuation sensitivity, holding NOI constant while increasing a hypothetical capitalization rate from 5.50% to 6.50% reduces value by approximately 15.4%. That arithmetic shows why exit assumptions deserve the same scrutiny as initial financing.
- Challenge collateral support: Unitism®’s guide to valuing commercial property for lenders provides context for reviewing valuation approaches.
- Connect assumptions to approval: Incorporate stressed value and coverage into the bank's credit risk modeling, with exceptions explicitly approved.
These are illustrative calculations, not current market readings. Approve the structure only after reconciling its value, coverage, and leasing assumptions, and preserve the calculations in the underwriting memo.
Monitoring Portfolios with Joint Risk Triggers
No single market indicator should automatically determine a borrower's treatment. A price decline doesn't establish payment distress, and current payments don't establish refinancing capacity.
The Federal Reserve's Spring 2025 Financial Stability Report described signs of stabilization in commercial property prices, vacancy, and rent growth. That finding doesn't establish that borrowers can refinance loans originated under different financing conditions.
Banks should therefore connect market changes with account-level evidence. A broad delinquency trend can justify closer surveillance, but the relationship manager needs current property information before recommending a credit action.

Use a defined routing rule
Joint risk triggers and the action each one calls for
| Trigger | What to Watch | Action Route |
|---|---|---|
| Delinquency trend | Rising quarter over quarter for CRE loans | Relationship manager reviews rent roll |
| Submarket vacancy | Rising against the loan underwriting assumption | Re-test debt-service coverage |
| Rent growth | Weak or negative against loan projections | Request updated leases and tenant concentration |
| Repeat-sales prices | Falling for the relevant property type | Estimate refinancing equity need |
| Maturity date | Within a bank-defined refinancing outreach window | Open refinancing discussion with sponsor |
| Combined signals | Two or more triggers at the same time under an illustrative policy | Escalate to watch list and board report |
The combined-signal rule is a proposed management convention, not a regulatory standard. Management should validate the thresholds against its portfolio, document exceptions, and avoid interpreting a trigger count as a probability of default.
For an illustrative first pass, count concurrent triggers and then rank flagged loans by exposure, estimated shortfall, and time available to act. A small loan with several weak signals shouldn't automatically outrank a large exposure with a material near-term repayment problem.
Assign work, not just a score
Suppose a hypothetical bank screens 240 CRE loans, and 18 meet its illustrative rule of two or more concurrent triggers. Assign a named relationship manager and a completion date to each account rather than distributing an unowned spreadsheet.
The manager should obtain:
- Current operating evidence: Updated rent rolls, collected rents, operating expenses, and lease concessions.
- Tenant concentration: Major tenant dependencies, expirations, and renewal status.
- Recalculated coverage: Current and stressed debt service using supportable income.
- Sponsor capacity: Available liquidity, contingent obligations, and other capital calls.
- A refinancing plan: Proposed lender, expected proceeds, equity source, and execution milestones.
Require the analyst to record whether each signal is observed, estimated, or unresolved. Missing borrower information is not proof of distress, but it is a reason to identify an information owner and deadline.
Committee standard: Every escalated account should arrive with a proposed action, an accountable owner, and the evidence that would change the recommendation.
The executive output is a ranked watch list that credit committee can use immediately. It should distinguish requests for information from decisions to reprice, restructure, seek collateral, or limit additional exposure.
Concentration Screens and Growth Paths
The FDIC's CRE concentration guidance identifies two supervisory screens: construction, land-development, and other land loans at 100% or more of total capital; or total CRE loans at 300% or more of capital, combined with CRE growth of at least 50% over the preceding 36 months.
These are screening criteria, not lending limits or automatic findings of unsafe practices. Apply the relevant regulatory definitions rather than assuming every internally labeled CRE exposure belongs in the same calculation.
Review the path as well as the level
In a hypothetical example, $600 million of CRE loans divided by $200 million of capital equals 300%. If the portfolio began at $400 million, growth is 50%.
That arithmetic shows why a point-in-time ratio is incomplete. Management must understand whether production, acquisitions, capital changes, or repayments drove the result.
The Federal Reserve's October 2025 lending survey reported generally unchanged conditions for most CRE categories, but modest net tightening for construction and land-development standards.
- Segment production: Show stabilized properties separately from construction commitments.
- Test internal appetite: Use a consistent definition of concentration risk across policy and reporting.
Before approving growth, directors should ask whether the proposed exposure fits the bank's capital, liquidity, and loss-bearing capacity, not merely whether it passes a supervisory screen.
Building a Governed Intelligence Workflow
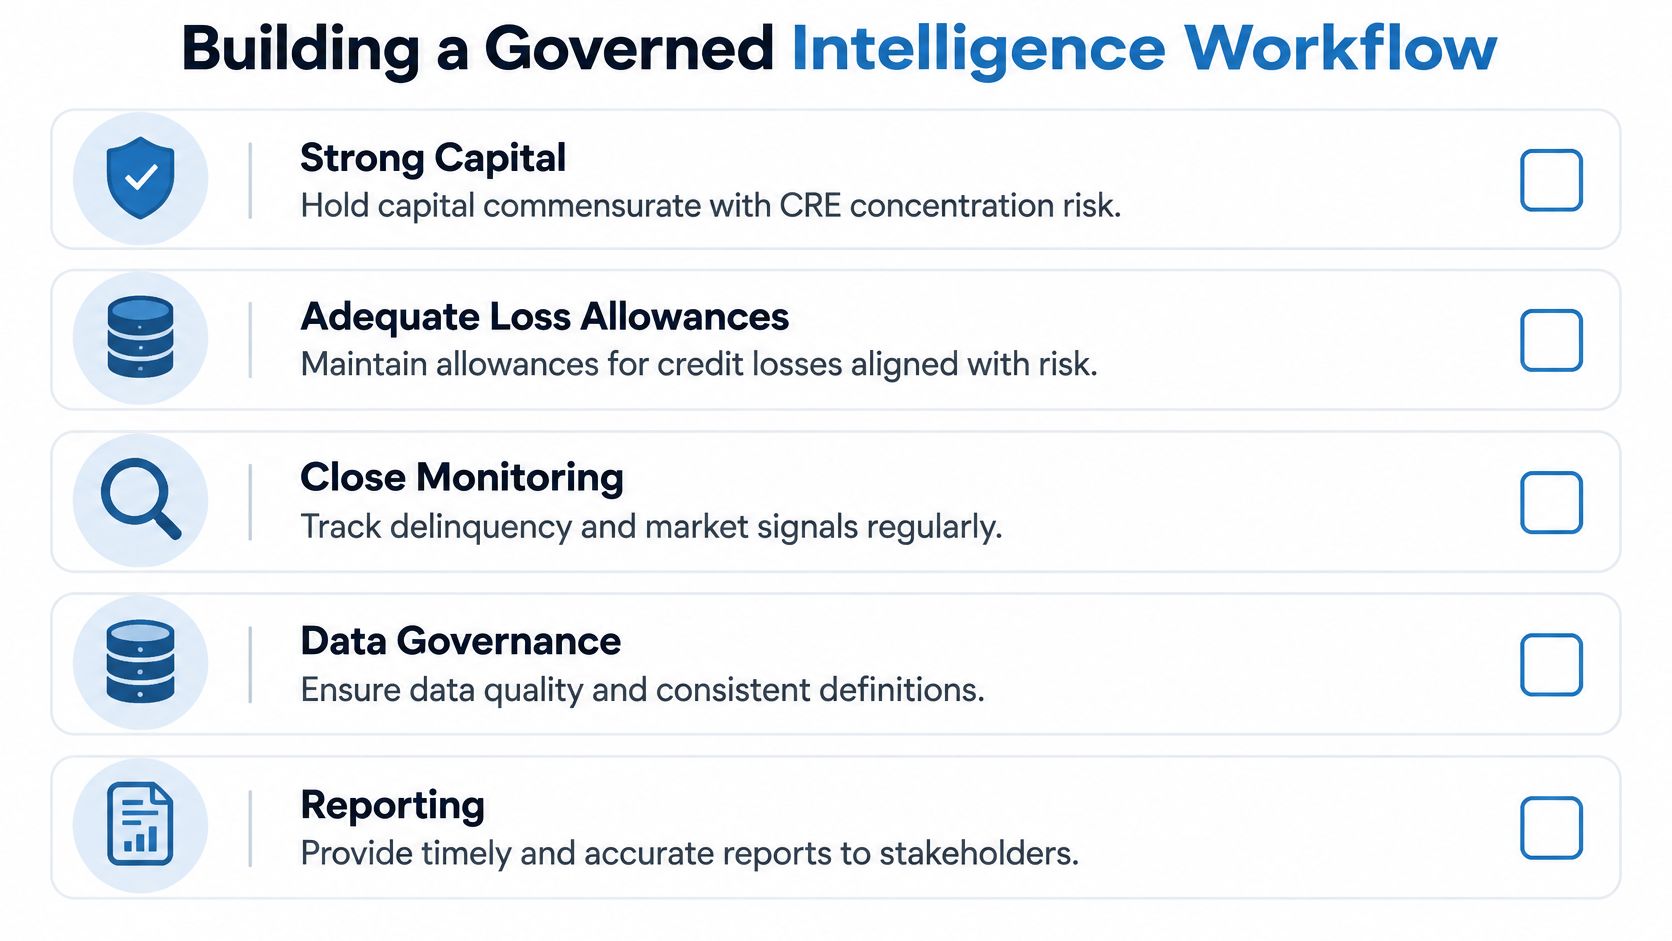
CRE intelligence is part of governance because directors need reproducible evidence to challenge management's assumptions. The FDIC's guidance on managing CRE concentrations emphasizes strong capital, appropriate credit-loss allowances, close oversight, updated financial information, workout capacity, adequate liquidity, and diverse funding.
FDIC-supervised institutions must also maintain written real-estate-credit policies covering diversification, underwriting, administration, documentation, approval, and reporting. The analytical workflow should implement those policies rather than operate as a separate reporting exercise.
Design the board view around challenge
Consider a hypothetical quarterly board report covering a $75 million office portfolio, maturities over the following 12 months, and the five largest borrowers. Place updated debt-service coverage, allowance coverage, sponsor dependencies, and relevant peer comparisons beside those exposures.
The board needs to know what changed, why management believes the risk remains acceptable, and which decisions require approval. A portfolio total without that explanation doesn't support effective challenge.
As an internal service target, ask whether staff can reconcile material exposures within a day or two. That isn't a regulatory deadline. It's a practical test of whether management can answer an urgent question without rebuilding the portfolio from disconnected spreadsheets.
Implement in a controlled sequence
- Define policy metrics. Specify the exposure perimeter, capital denominator, treatment of commitments, and exception rules before building calculations.
- Map sources to fields. Record the authoritative source, reporting date, refresh schedule, and fallback process for each material input.
- Resolve entities. Connect legal borrowers, sponsors, guarantors, and properties without treating similar names as proof of common ownership.
- Add quality checks and version control. Reconcile balances, flag missing records, and retain prior inputs so reviewers can reproduce earlier decisions.
- Set thresholds and owners. Assign responsibility for reviewing each exception and approving any override.
- Document the board report. Preserve definitions, management commentary, decisions, and follow-up responsibilities.
Visbanking unifies public and proprietary data into a consistent model with entity resolution, quality checks, and version control. That process supports consistency, but bank officers remain responsible for their credit judgments and approved policy exceptions.
A further control is essential: distinguish a revised source record from a revised analytical assumption. Otherwise, directors may see a changed risk score without knowing whether the borrower deteriorated or the model changed.
The best system produces the same answer from the same inputs and explains any change. An examiner should be able to follow the evidence from the source record through the calculation to management's action.
Benchmark Your CRE Exposure This Quarter
Use a bounded review that ends with decisions rather than another standing dashboard.
- Establish the capital position. Calculate CRE exposure using the latest call report, apply the relevant supervisory definitions, and compare with peers of similar asset size and location.
- Measure the growth path. Determine whether changes in production, capital, or portfolio composition explain the trend.
- Map the refinancing queue. Group upcoming maturities by property type, sponsor, and expected funding gap.
- Rank actionable accounts. Combine warning signals with exposure size, sponsor capacity, and the time available to respond.
- Submit a decision list. Bring the highest-priority relationships to credit committee with a recommendation to retain, restructure, reprice, or reduce production.
Visbanking's Bank Performance supports peer comparison by location and asset size, historical call-report analysis, and executive reporting. Call-report pages include quarterly charts for assets and liabilities, loans and leases against deposits, income and expense, and net income; reporting includes annotated charts and export-ready reports. The Bank Intelligence app remains in beta, including its early-warning capabilities such as bankruptcy probability and stress markers.
Treat those signals as inputs to review, not automatic credit decisions. The quarter's deliverable should be a documented set of actions that management can execute and directors can oversee.
Visbanking brings regulatory, financial, and market information into a consistent foundation for benchmarking and executive analysis. Visit Visbanking to explore our data and benchmark your bank's CRE position, then identify the relationships and concentrations that warrant action this quarter.
Latest Articles
Brian's Banking Blog
Audit Assertions Explained: A Bank Executive's Guide

Brian's Banking Blog
Credit Risk Analytics Software: A Bank Buyer's Guide

Brian's Banking Blog
Data Driven Partners for Banks: A Practical Guide

Brian's Banking Blog
Prospecting Rules for Banks: How to Build and Score Them
Brian's Banking Blog
Predictive Risk Intelligence for Banks: A Practical Guide

Brian's Banking Blog