
What Is Predictive Analytics? a Guide for Bank Leaders
Brian's Banking Blog
Predictive analytics uses historical and current data, statistical methods and machine learning to estimate what is likely to happen next, such as the probability that a commercial borrower becomes 90 days delinquent within 12 months, and it doesn't claim certainty. What it produces is a probability attached to a time window.
The counterintuitive part is where these programs fail. Rarely at the algorithm. McKinsey's 2021 global AI survey, which collected responses from 1,843 participants across regions, industries and company sizes, found that 56% of organizations reported adopting AI in at least one business function, up from 50% in 2020, and that 27% said at least 5% of enterprise EBIT was attributable to AI, up from 22% a year earlier (McKinsey). Tooling and adoption are no longer the binding constraint.
What separates a forecast that changes a balance sheet from one that decorates a slide is unglamorous: a defined outcome, a time-ordered test, a calibration check, and a named person who acts when the score crosses a line. Accuracy and usefulness are different properties. Only one of them appears in a model's documentation by default.
What Predictive Analytics Is and How It Differs From Other Analytics
A prediction that never reaches a decision is arithmetic with better branding. Predictive analytics turns observed history into a priced guess about a named event: which borrower deteriorates, which deposits leave, where efficiency slips before the quarter closes. The logic is Bayesian in spirit. History supplies the prior, new data sharpens it, and neither removes uncertainty.
Executives who ask what predictive analytics is usually mean something narrower: can I act on the answer, and what does being wrong cost? A weather forecast is the closest familiar analogue. The forecaster states a probability, a range and a time window, and people learn to carry an umbrella on a 70% chance of rain rather than demand certainty. Banking forecasts earn trust the same way. The usable ones publish uncertainty instead of hiding it behind a single score.
Two output types cover most applications. Classifications answer a yes-or-no question, such as whether a borrower is likely to default or an account is likely to attrit. Numerical forecasts estimate a quantity, such as expected loss in dollars, quarterly deposit balances or loan volume for the next two quarters. Both are estimates of something not yet observed. Both stand or fall on defined outcomes, historical observations, measurable features, validation and monitoring for changing conditions.
A ladder of questions
Descriptive, predictive and prescriptive analytics are often sold as rival product categories. They work better as a ladder of questions, each answered with a different kind of evidence and each carrying a different cost of error.
Descriptive analytics summarizes what happened: deposits fell 4% last quarter, nonperforming loans rose, headcount was flat. Predictive analytics asks what is likely to happen next and returns a probability or a number with a horizon attached, such as a 12% chance that a commercial borrower becomes 90 days delinquent within 12 months. Prescriptive analytics asks what to do about it, returning a rule or recommendation, such as ordering a collateral review for every exposure above a set score.
The failure modes differ, which is why the distinctions earn their keep. A descriptive report mistaken for a forecast invites complacency. A predictive score trusted without calibration invites overconfidence. A prescriptive rule built on a weak forecast automates a bad decision at scale.
| Type | Question it answers | Typical output | Banking example | Main risk |
|---|---|---|---|---|
| Descriptive | What happened? | Trend report or call-report summary | Deposits fell 4% last quarter | Mistaken for a forecast |
| Predictive | What is likely to happen? | Probability or numerical forecast | 12% chance of 90-day delinquency within 12 months | Overconfidence in the number |
| Prescriptive | What should we do? | Recommended action or rule | Order a collateral review above a set score | Acting on a weak forecast |
The predictive rung covers more ground than credit. The same structure applies to deposit attrition, sales propensity, staffing needs and peer-performance changes, because each is a future event with a measurable window and a decision attached to it.
A dashboard with trend lines reports history. A peer comparison benchmarks position. For a number to qualify as a prediction it needs three parts: a forward probability or value, a stated horizon, and an action that follows when a threshold is crossed. Remove one and the result still informs, but it stops short of forecasting.
Prediction ranks and estimates. Usefulness begins when the score is validated, explainable to the owner, and tied to a named action whose cost of error is known.
How a Predictive Model Turns History Into a Forecast
The step teams skip is the first one. Before an algorithm is chosen, the event and the time window have to be named precisely enough to be measured, such as 90-day delinquency within 12 months or a 15% runoff in noninterest-bearing balances within two quarters. Everything downstream depends on that sentence.
The mechanics themselves are well defined. Research on rolling-origin forecast evaluation describes predictive analytics as an out-of-sample inference process: historical, time-stamped data are transformed into explanatory features, a model estimates a future outcome, and that model is evaluated on observations excluded from fitting. The exclusion is the whole point. A model graded on the data it learned from is a student grading their own exam.
Here's the sequence a validation team will ask you to document.
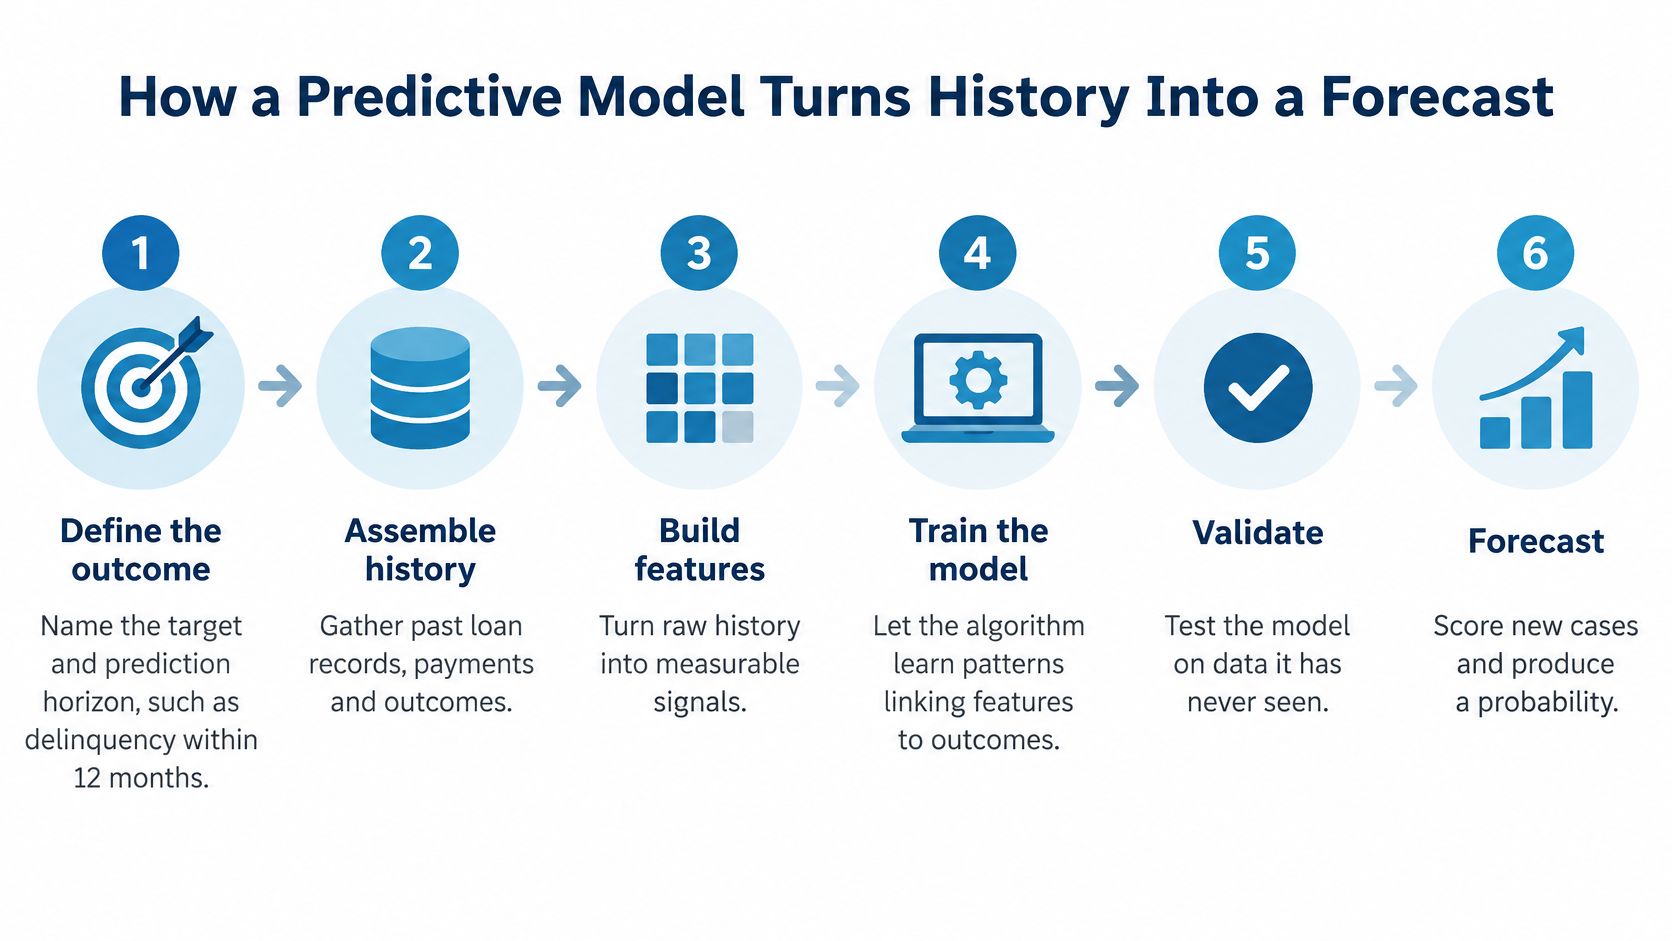
Six stages from history to a horizon
- Define the outcome and the horizon. Name the event, the threshold and the window, in writing. A model without a measurable target can't be scored, and teams that skip this stage end up debating accuracy without agreeing on the accuracy of what.
- Assemble point-in-time features. Use only what was knowable on the forecast date: balances, transaction volumes, payment history, utilization. The common mistake is backfilling a feature with a value that was revised later, which imports hindsight into the training set.
- Fit a simple model and a naïve baseline first. The baseline is the latest observed value or the same period last year. Complexity earns its place only when it lowers out-of-sample error, and the comparison is the only evidence that it did.
- Validate in time order. Hold out a later period the model never saw. Randomly mixing past and future observations leaks information and overstates performance, which is the most common way a promising model arrives at committee with numbers it can't repeat.
- Set the action threshold and price the error. Decide which score triggers a call, a review or a limit change, then estimate the cost of a false positive against a false negative. A threshold that nobody can afford to act on is a threshold set for the wrong side of the trade.
- Monitor drift and retrain on deterioration. Watch error metrics and input distributions after deployment. A calendar-based retraining schedule is a proxy for monitoring, not a substitute for it.
A working system hands a manager four things: the forecast, its horizon, a confidence level, and a named owner for the action that follows. Visbanking's end-to-end delivery covers source integration, production data pipelines, modeling, application development and decision-ready analytics, which is the difference between a validated model and a notebook that dies on a laptop.
Core Methods and What Each One Does Best
Every method below is a trade between transparency and predictive power. The right answer depends on what the score is allowed to do once it exists.
Logistic regression remains the workhorse for yes-or-no outcomes such as default or attrition. It's easy to explain, easy to validate and it can miss nonlinear patterns that appear when a borrower's deposits and line utilization move together. Exponential smoothing and ARIMA handle balances and volumes over quarters well, provided the history is stable. A rate shock breaks the pattern and the forecast with it.
Random forests and gradient boosting rank many variables at once, which is why they dominate credit-risk ranking work, and they're harder to explain than a scorecard. The same ensembles run condition monitoring in heavy equipment, and Forge Reliability's guide to catching gearbox failures early shows how feature engineering and alert thresholds play out when the cost of a missed signal is a failed machine.
Neural networks earn their governance burden only with very large or unstructured inputs such as call-center notes or news text. Survival analysis estimates time until an event, which fits deposit runoff or prepayment better than a yes-or-no classifier does, and it requires careful handling of censored observations.
| Method | Best for | Banking example | Main trade-off |
|---|---|---|---|
| Logistic regression | Yes-or-no outcomes | Default or attrition flag | Easy to explain, may miss nonlinear patterns |
| Exponential smoothing and ARIMA | Forecasts over time | Quarterly deposit balances | Needs stable historical patterns |
| Random forest | Ranking many variables | Ranking borrowers by relative default risk | Harder to explain than a scorecard |
| Gradient boosting | Complex tabular signals | Sales propensity scores | Requires careful tuning and monitoring |
| Neural networks | Very large or unstructured inputs | Text from call notes or news | Least transparent, heaviest governance |
| Survival analysis | Time until an event | Time to deposit runoff or prepayment | Needs careful handling of censored data |
The accuracy you pay for
NIST's AI Risk Management Framework recognizes a tradeoff between predictive accuracy and interpretability, which means the most accurate model isn't automatically the most appropriate model for a bank. Consider a hypothetical credit model that lifts default prediction from 78% to 84% accuracy by using hundreds of transaction and behavioral variables, and becomes difficult for lenders, auditors and customers to understand. A simpler model at 80% accuracy may be the better instrument if it can state plainly that the decision was driven by debt-service coverage, declining deposits and recent payment performance.
That explanation does operational work beyond compliance. A lender can separate genuine risk from a data-quality problem, and can give a customer a defensible rationale.
Write it down: agree in advance on the accuracy gap that justifies a less transparent model. Without that number agreed before the results arrive, every explainability debate becomes a matter of taste.
Banking Use Cases With Worked Numbers
Start with the case that pays for itself: early-warning credit monitoring. Say a bank holds a $50 million commercial-loan portfolio and a model flags 8% of exposures, or $4 million, for review after detecting falling operating-account balances, rising utilization of credit lines and weakening sector conditions. Relationship managers then request updated financials, reprice risk, adjust limits or deepen the relationship before the deterioration shows up in quarterly delinquency data.
The mechanics behind that flag come from combining signal types, not from one historical ratio. FDIC research on AI and big data in banking describes how big-data systems dynamically capture borrower behavior, financial transactions and market signals to produce timely predictive insights. A single ratio tells you what a borrower looked like at the last statement date. A combined signal tells you what's changing now.
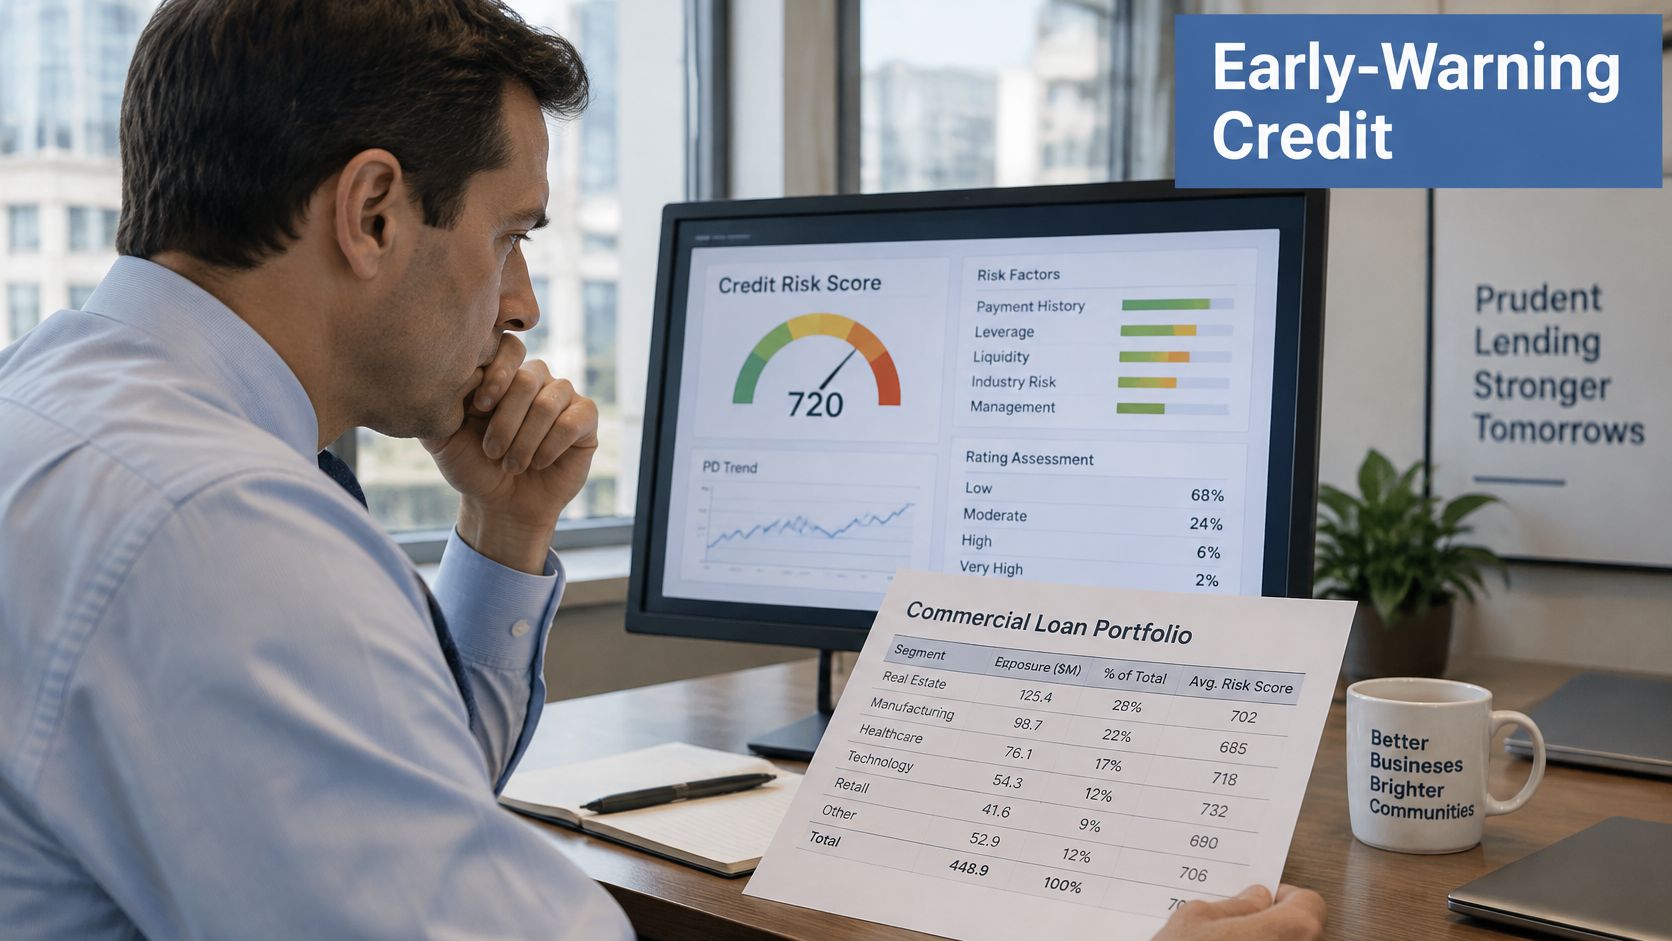
Three more decisions built the same way
Deposit attrition. Rate sensitivity, balance drift and digital activity patterns combine to rank accounts for outreach, which is the same structure behind customer churn prediction on the deposit side. The output is a call list ordered by value at risk, not a retention rate.
Sales propensity. A score ranks prospects by size, location and existing banking relationships, so officers call the right 50 names instead of all 500. The model doesn't create relationships. It sequences the work.
Staffing and peer performance. A forecast of loan volume and efficiency ratios against a peer group signals when capacity should shift, whether that means adding a commercial lender or holding headcount flat through a slow quarter.
Visbanking provides U.S. banking data and analytics, so financial, regulatory, market and people data sit in one view rather than in four spreadsheets that disagree. The practical takeaway is that predictive analytics isn't just forecasting. It's the structured conversion of changing behavior and external conditions into earlier, more targeted action.
Validation Checks That Separate Accuracy From Usefulness
High accuracy is the least useful number in a model review. A model can rank risk beautifully and still produce weak decisions if its probabilities are miscalibrated, its data is stale or its outputs sit in a queue nobody owns.
Data conditions decide most of that outcome. A 2025 KPMG banking survey found that 93% of respondents cited data privacy and risk as modernization concerns, 89% cited data quality and 81% cited legacy-system or integration complexity. Model choice is the smaller half of the problem.
A validation team runs the checks in a fixed order. First, compare the model with a simple baseline, such as the latest observed value, and reject complexity that doesn't lower out-of-sample error. Second, test stability with rolling-origin evaluation, because accuracy often drops after a rate move or a regime change. Third, measure ranking with ROC-AUC or precision at the target percentile, and probability quality with the Brier score and a calibration curve.
Fourth, monitor input drift and run sensitivity analysis on the features that drive the score. Federal Reserve research on credit default prediction found that random forests and stochastic gradient boosting can outperform logistic regression in ranking borrowers by relative default risk, yet their advantage in numerical probability accuracy is smaller, and over longer horizons model and data drift can let the conventional logistic model win out of sample. No single metric settles the question.
| Check | Question it answers | Warning sign |
|---|---|---|
| Out-of-sample error against a simple baseline | Does complexity add value? | Model barely beats the last-value forecast |
| Rolling-origin evaluation | Does performance hold over time? | Accuracy drops after a rate or regime change |
| ROC-AUC or precision at target percentile | Does the model rank risk well? | Strong ranking but flat results across cohorts |
| Brier score and calibration curve | Do probabilities match outcomes? | Forecasts of 12% default at roughly 20% actual |
| Input drift monitoring | Have the inputs shifted? | Feature distributions move after a market change |
| Sensitivity analysis | How much does one input move the score? | Small input change produces a large score swing |
These are standard components of any machine learning model validation program. What fails in practice is the sequence, not the mathematics.
Calibration test: if the model says 12%, roughly 12 of every 100 comparable borrowers should default. A model that ranks well but prices probability badly will misprice risk on every loan it touches.
Limits of Predictive Analytics and When Not to Rely on Them
Predictions are estimates, and the failure modes are predictable enough to plan around.
A model trained on calm conditions can fail badly in a shock, because the future stops resembling the training data and every coefficient learned from that period points the wrong way. Delayed, incomplete or biased records degrade forecasts regardless of algorithm, and data quality remains the practical constraint for most institutions. Long horizons are harder than short ones. Rare events, such as a cluster of commercial defaults in one sector, leave too few historical examples for any model to learn from, and a model that encodes unfair patterns in credit decisions creates legal exposure on top of the analytical error.
Three rules keep a bank out of trouble:
- Use predictions for prioritization where errors are cheap. A delinquency score that ranks 40 borrowers for review creates a queue for a credit officer. It doesn't create a loss estimate.
- Require human judgment and independent review where a wrong call is costly, irreversible or regulated. Limit cuts, adverse-action decisions and capital actions belong in that category.
- Test for adverse impact before deployment, not after. Fair-lending exposure isn't a modeling side effect you audit later.
The mature posture treats a score as an input to judgment rather than a replacement for it.
Explainability and Governance Before a Prediction Triggers Action
A predictive model is a decision model, and it needs the same oversight as any other decision that touches credit or customers. Federal Reserve supervisory guidance identifies model risk as the potential for adverse consequences when decisions rely on incorrect or misused model outputs, and calls for four disciplines: sound model development, effective implementation and use, independent validation, and governance through policies and controls.
Apply that to a live case. If a model estimates a 12% probability that a commercial borrower becomes 90 days delinquent within 12 months, management should be able to answer three questions. Was the estimate calibrated on comparable borrowers? Have economic conditions shifted since the calibration period? And which action does the score trigger at that level?
Global and local explanations
Global explanations describe how the model behaves overall: which inputs matter, in what direction, across the whole book. Local explanations describe why this borrower, this account, this prospect scored where they did. Managers act on the local version and validate against the global one, and confusing the two produces either false comfort or unusable detail.
The Bank for International Settlements work on managing explanations notes that explanation methods can be inaccurate, unstable or misleading, which means a clean reason code is not proof. Pair explanations with data lineage, confidence ranges, human approval, version history and post-deployment monitoring.
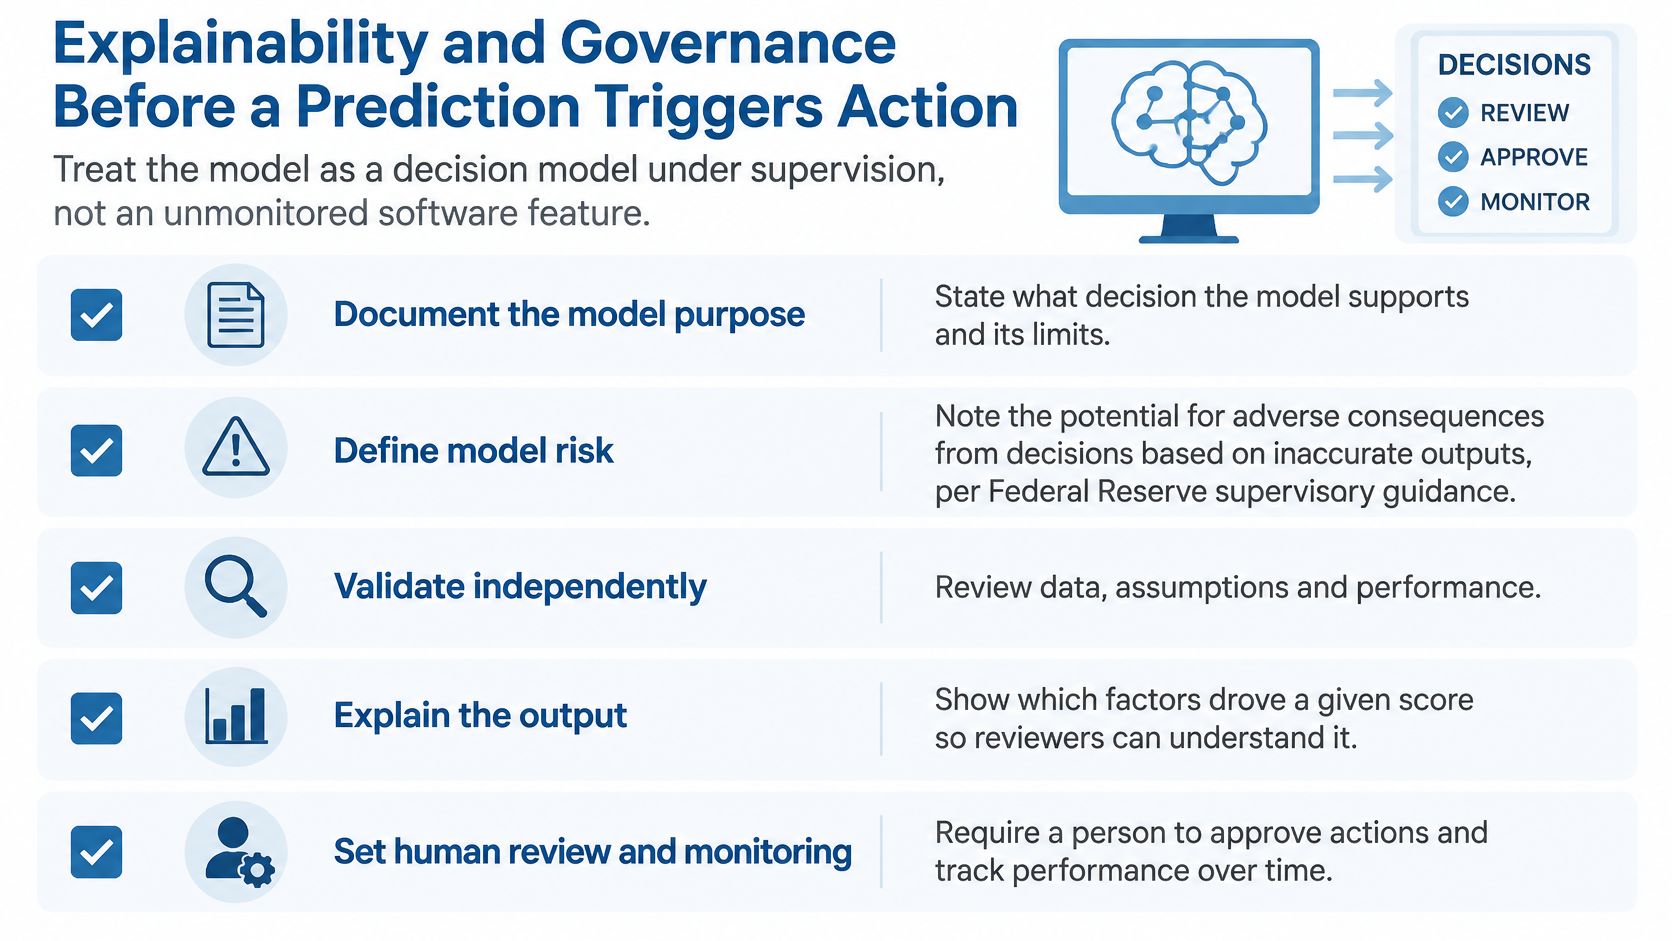
Before acting on any score, a manager should be able to name six things: the source signals behind it, the recency of those signals, the comparison group it was scored against, the uncertainty around the estimate, the owner of the action, and the recommended next step. That list doubles as a governance artifact, and it's the substance behind explainable AI in banking rather than a feature label. Firms that have already built oversight for software rollouts can reuse the structure; Rite NRG's governance guardrails for scaling SaaS sets out a practical framework that maps cleanly onto model risk.
Test Your Early-Warning Signals Against Peers
Pick one decision a prediction would change this quarter, either commercial credit review or deposit retention, and write four things down: the outcome, the horizon, the action threshold and the owner. That single page tells you whether you have a decision system or a reporting habit.
Then test the signal before committing budget. Ask whether your early warnings beat a simple baseline on data the model never saw, and whether your ratios sit where you think they do against institutions of similar size and mix. The Bank Intelligence app surfaces early warnings, including bankruptcy probability and stress markers, so the signal reaches the person who can act on it rather than sitting in a dashboard.
Request a benchmark on the decision you've named, and ask one question of the leadership team: which decision would change if our forecasts were proven accurate, and who would act on them?
Visbanking's Bank Intelligence and Action System unifies financial, regulatory, market and people data, spanning FDIC call reports, FFIEC and UBPR filings, NCUA 5300 data, SBA program data and HMDA, into explainable analytics a credit or relationship team can trace back to source. That's what turns a probability into a workflow: a signal, an owner, a date. Visit Visbanking to benchmark your institution against peers and see how your early-warning signals compare before your next credit review.
Latest Articles
Brian's Banking Blog
Bank Marketing Regulations: A Guide for Bank Executives
Brian's Banking Blog
Agentic AI in Banking: What It Is and How It Works

Brian's Banking Blog
Commercial Real Estate Intelligence for Bank Leaders
Brian's Banking Blog
Audit Assertions Explained: A Bank Executive's Guide
Brian's Banking Blog
Credit Risk Analytics Software: A Bank Buyer's Guide
Brian's Banking Blog