
Bank Loan Performance: Metrics, Formulas and Benchmarks
Brian's Banking Blog
A single ratio can appear stable while portfolio risk shifts beneath it. In the fourth quarter of 2009, the delinquency rate on all U.S. commercial-bank loans was 7.05%, compared with 2.17% in the second quarter of 2001 and 2.91% in the fourth quarter of 2007. The Federal Reserve series draws on FFIEC Consolidated Reports of Condition and Income and covers data compiled since 1985 (Federal Reserve charge-off and delinquency release).
Those movements reflect overlapping cycles, not one uniform credit cycle. Bank loan performance varies by product, origination vintage, and loan growth, while a headline ratio averages those differences. Delinquency means a loan is at least 30 days past due and still accruing; nonaccrual is a separate category. Charge-offs measure balances removed from the books, net of recoveries, relative to average loans on an annualized basis.
The measures capture different stages. Delinquency signals repayment stress; charge-offs record recognized losses. Read together, segment rates show where stress is emerging, vintage curves reveal whether newer loans are deteriorating faster, and growth helps explain changes in portfolio ratios. A stable aggregate can therefore mask worsening performance in a particular segment.
Core Loan Performance Metrics at a Glance
Eight measures cover the decisions a credit committee really makes. They fall into credit stress, recognized loss, and reserve and return. The reference below is the full set. Definitions follow it.
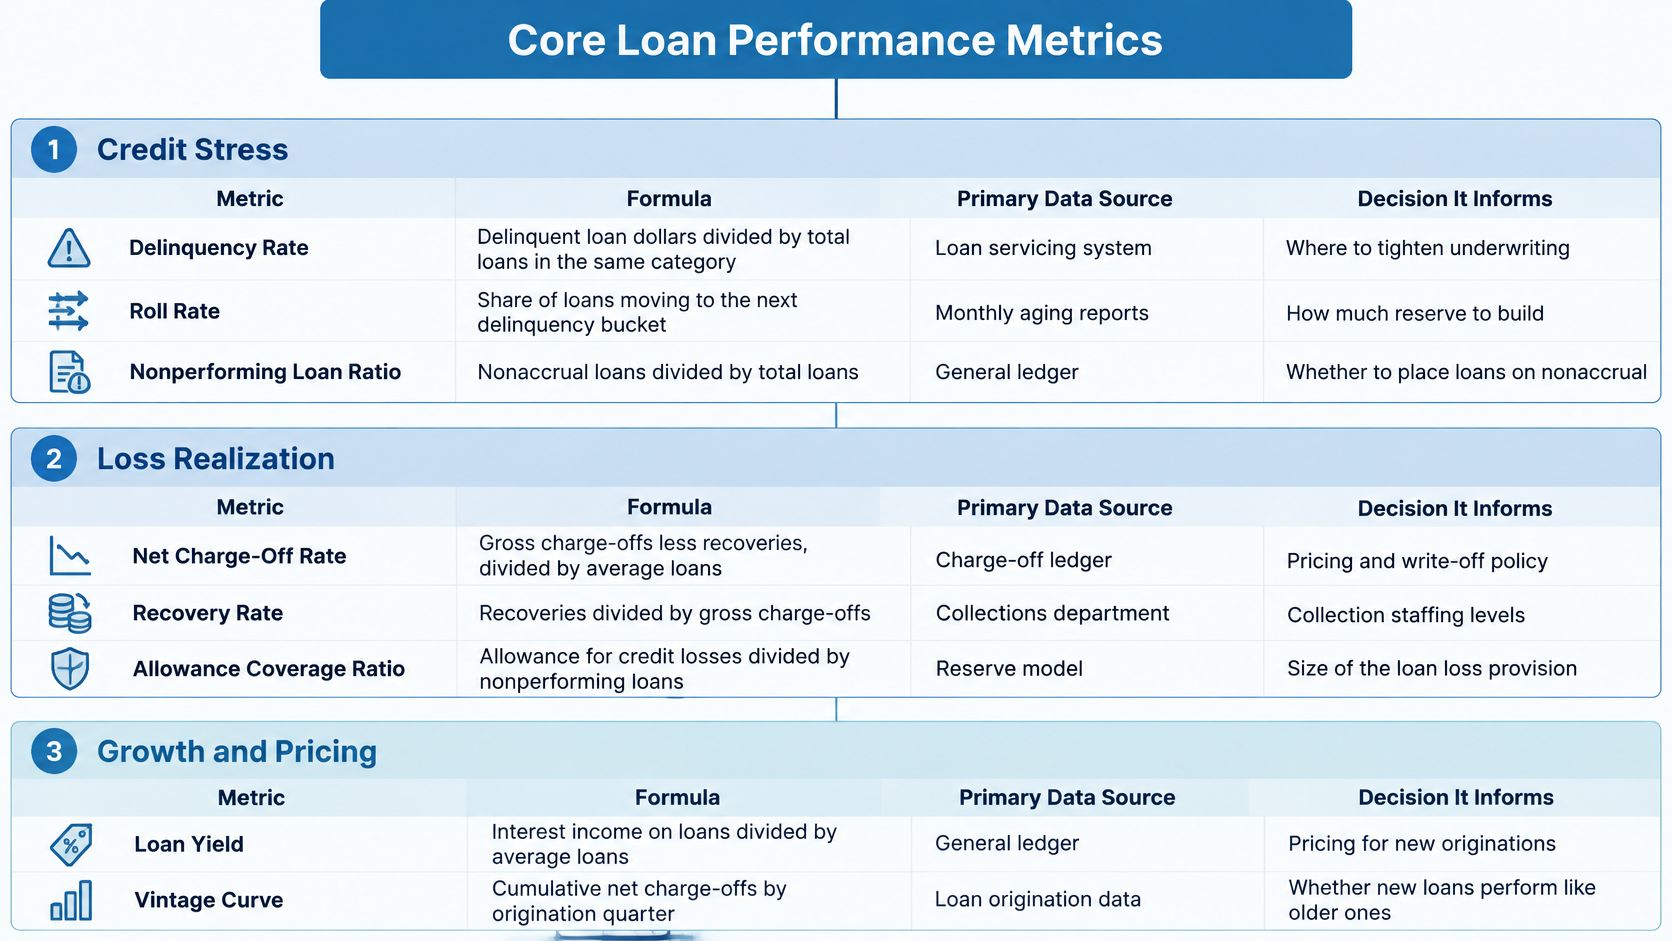
| Metric | Core formula | Primary source | Question it answers |
|---|---|---|---|
| Delinquency rate | Delinquent loans ÷ total loans, same segment | Call Report RC-N and RC-C | Is repayment stress building? |
| Past-due and nonaccrual rate | (30+ days past due plus nonaccrual) ÷ total loans | Call Report; UBPR | How much of the book is already impaired? |
| Net charge-off rate | (Gross charge-offs − recoveries) ÷ average loans, annualized | Call Report RI-B and RC-K | How much loss has been recognized? |
| Roll rate | Share of balances moving from one delinquency bucket to the next | Loan-level data tape | Where is delinquency heading? |
| Vintage cumulative loss | Cumulative net charge-offs ÷ original principal, by origination quarter | Loan-level data tape | Are newer loans underwriting worse than older ones? |
| Allowance coverage ratio | Allowance for credit losses ÷ total loans | Call Report RC; UBPR | Are reserves keeping pace with stress? |
| Loan yield | Annualized interest and fee income ÷ average loans | Call Report RI; UBPR | What return does the book earn? |
| Net yield after losses | Loan yield − annualized net charge-off rate | Derived from Call Report | What is the risk-adjusted return? |
What each group is for
Credit stress is the early read. The delinquency rate uses delinquent dollars over loans in the same category, so a card book isn't diluted by a mortgage book. The past-due and nonaccrual rate widens the lens to everything already late or on nonaccrual, which is the impaired stock directors usually see in the industry profile. The roll rate is a transition, not a stock. It says whether 30-day balances are curing or marching into the next bucket.
Recognized loss is what has left the balance sheet. The net charge-off rate is gross charge-offs minus recoveries, over average loans, annualized. Vintage cumulative loss asks a different question: at the same age, is this origination quarter worse than the one before it? A flat portfolio charge-off rate can sit on top of a vintage that is already off the old curve.
Reserve and return closes the loop. The allowance coverage ratio here is the allowance divided by total loans, a stock check on whether reserves are keeping up with the book, not a substitute for lifetime expected loss. Loan yield is what the book earns before credit cost. Net yield after losses subtracts the annualized charge-off rate, so a high coupon that leaks to write-offs doesn't look like a win.
Board test: If delinquency is rising and charge-offs are not, you are early. If charge-offs are rising and delinquency is not, you are late, or growth and modifications are hiding the stock.
The formulas that produce the two core rates come next. Published ranges for judging them sit with the benchmark set later in this briefing. Neither replaces segment math.
Formulas and a Worked Example by Portfolio Segment
Three calculations, used the same way every quarter, keep peer packs honest. The Federal Reserve's charge-off methodology separates the delinquency rate from the net charge-off rate, and the schedules are specific.
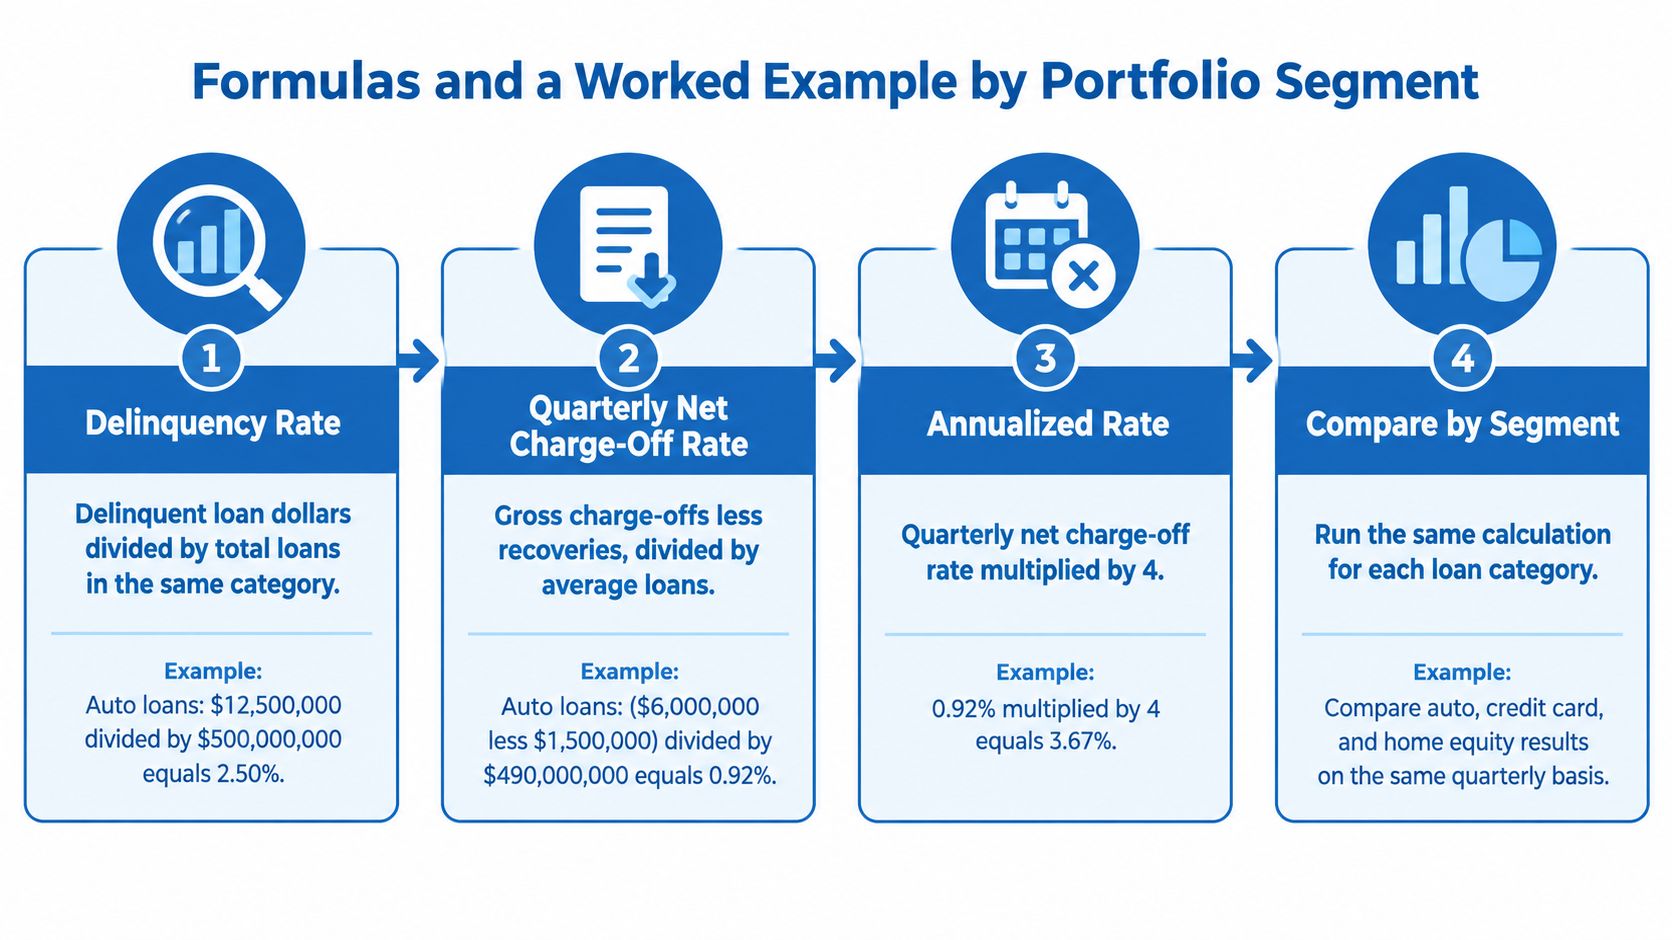
Delinquency rate equals delinquent loan dollars divided by total loans in the same category. Delinquent balances come from Schedule RC-N. Total loans come from Schedule RC-C.
Quarterly net charge-off rate equals gross charge-offs minus recoveries, divided by average loans for the quarter. Charge-offs and recoveries come from Schedule RI-B. Average balances come from Schedule RC-K.
Annualized charge-off rate equals the quarterly rate multiplied by four.
Run all three by segment. Commercial real estate, commercial and industrial, residential mortgage, credit card, and other consumer loans do not share a cycle. A stable total can hide a product that is breaking.
A hypothetical $1,250 million book
Take a book of $1,250 million: commercial real estate $800 million, credit cards $150 million, auto $300 million. Delinquent dollars are $10.0 million, $4.5 million, and $5.625 million. That is a blended delinquency rate of 1.61% ($20.125 million ÷ $1,250 million). The card rate is 3.00%. The blend looks ordinary because CRE, at 1.25%, dominates the denominator.
| Segment | Loans ($ millions) | Delinquency rate | Annualized net charge-off rate |
|---|---|---|---|
| Commercial real estate | 800 | 1.25% | 1.01% |
| Credit card | 150 | 3.00% | 6.49% |
| Auto | 300 | 1.875% | 1.21% |
| Total portfolio | 1,250 | 1.61% | 1.72% |
Card losses at 6.49% annualized are more than six times the CRE rate of 1.01%. The portfolio rate of 1.72% is a weighted average, not a description of any one book. A director who hears only 1.72% will underprice cards and over-worry CRE, or the reverse, depending on which anecdote is in the room.
The sequence, and why each step exists
- Segment balances by product. Mix is the main way a total lies. A growing CRE book will pull the blend toward the CRE rate even if cards worsen.
- Pull delinquent balances at 30 days or more, plus nonaccrual. That matches the regulatory definition, so internal reports don't use a softer 60-day cutoff than the Call Report.
- Compute each segment's delinquency rate. The card line at 3.00% is the number that changes collection staffing, not the 1.61% blend.
- Sum quarterly net charge-offs and average balances by segment. Recoveries belong in the numerator. Leaving them out overstates loss and then overstates the reserve need.
- Annualize and reconcile segment totals to the filed Call Report. Peer comparison is useless if your 1.72% doesn't tie to RI-B and RC-K. Rapid balance growth can also suppress the ratio while problem dollars rise, so keep the dollar change next to the rate.
Segment totals must tie to the filed schedules before any peer comparison leaves the building.
Where to Source Call Report and UBPR Data
Public series tell you where you sit. The loan tape tells you why. Most credit debates stall because the pack mixes the two without saying which is which.
| Source | What it contains | Performance use | Cadence |
|---|---|---|---|
| FFIEC Call Report (RC-C, RC-N, RI-B, RC-K) | Loan balances, delinquent balances, charge-offs, recoveries, average balances | Segment-level rates and reconciliation | Quarterly |
| Uniform Bank Performance Report (UBPR) | Ratios derived from Call Reports, ranked against peer groups | Peer benchmarking and percentile ranking | Quarterly |
| Federal Reserve charge-off and delinquency series | Commercial-bank delinquency and charge-off rates since 1985 | Long-run cycle context | Quarterly |
| FDIC Quarterly Banking Profile | Industry past-due, nonaccrual, and charge-off ratios | Macro benchmark for portfolio segments | Quarterly |
| Senior Loan Officer Opinion Survey | Banks' standards and demand by loan category | Forward credit-quality signals | Quarterly |
The two sources that carry the board pack
The FFIEC Call Report is the primary input. RC-C, RC-N, RI-B, and RC-K are the same schedules behind the formulas above, filed by every insured commercial bank. That is why a CRE charge-off rate at your bank can be set next to a peer's without a definition fight. Call Reports are generally due within 30 to 35 days after quarter-end, so a public benchmark is always one reporting period behind the loan tape you saw last week. Don't treat that lag as a data failure. Label the as-of date.
The Uniform Bank Performance Report turns those filings into ratios and ranks them inside peer groups, typically by asset size. A CRE charge-off rate that looks fine against the industry can sit in a weak percentile of banks your size. Percentile is the comparison directors should see. The industry mean is context, not a target.
The Federal Reserve's long series is the cycle backdrop, not a peer. The FDIC Quarterly Banking Profile is the current industry snapshot by product family. The Senior Loan Officer Opinion Survey is the forward signal: in the April 2025 survey, banks reported tighter standards and weaker demand for C&I loans, tighter or unchanged CRE standards, weaker or unchanged CRE demand, and tighter CRE loan-to-value and debt-service policies (April 2025 SLOOS). Standards can tighten while current charge-offs still look tame. For credit unions, the NCUA 5300 Call Report is the parallel filing. Don't drop those ratios into a commercial-bank peer group.
What the public file cannot do
Vintage curves and roll rates need loan-level fields. Federal Reserve CECL guidance points to origination and maturity dates, original principal, charge-off amounts and dates, recoveries, and cumulative losses for loans that share risk characteristics. Public data shows peer position. Only the tape supports cohort and migration work, so a performance system needs both.
Visbanking's Bank Intelligence and Action System is one way to hold Call Report, UBPR, NCUA 5300, and survey-related inputs in a single explainable view, next to the internal tape rather than in a separate slide. The discipline is the same whoever builds the file: one definition, one as-of date, one reconciliation to the filed schedule.
Vintage Analysis and Roll Rates Explained
A portfolio charge-off rate is a blend of old loans that have already revealed themselves and new loans that haven't. Vintage analysis breaks that blend. Group loans by origination quarter. Then track cumulative net charge-offs as a percentage of original principal at the same months on book. Age has to match. A six-month-old cohort will always look cleaner than a three-year-old cohort if you compare them at today's date.

A curve that moves before the portfolio rate does
Suppose the 2024 second-quarter commercial vintage shows cumulative loss of 0.9% at month 6, against 0.4% for the 2023 second-quarter vintage at the same age. The aggregate charge-off rate can still be flat, because older, cleaner cohorts dominate dollars outstanding. The curve is already saying underwriting drifted: looser structure, a hotter market, or both. That is the signal a relationship manager can use on renewals now, instead of waiting for the portfolio rate to confirm it next year.
Roll rates are the monthly version of the same idea, inside delinquency buckets rather than across vintages. In a hypothetical card book:
- Current to 30–59 days: 3.0% of current balances roll forward.
- 30–59 day cures: 40% of those balances return to current.
- 30–59 to 60–89 days: 30% roll deeper.
- 60–89 to 90 days or more: 25% roll to the charge-off threshold.
Rising rolls in the early buckets usually lead charge-offs by a quarter or more. A cure rate that slips from 40% toward 30% is an operations and credit issue at once. Collections capacity and underwriting both belong in the discussion.
The reserve check against those patterns
On the $1,250 million book, a $15.6 million allowance is 1.25% of loans. At a 1.72% annualized charge-off rate, that stock covers about 0.73 years of losses at the current run rate. It is a coverage sketch, not a CECL estimate. Executives should test it against the vintage result. A book whose newest commercial cohort is already at 0.9% by month 6 is not the book that produced the historical loss rate sitting in the model.
CECL asks for lifetime expected credit losses on assets at amortized cost, using history, current conditions, and reasonable and supportable forecasts over the contractual term. The allowance is the gap between amortized cost and what the bank expects to collect, updated each reporting date. Guidance doesn't prescribe one technique. Acceptable approaches include loss-rate, roll-rate, vintage, discounted cash flow, and probability-of-default with loss-given-default, if the method estimates collectability and stays consistent (Federal Reserve CECL FAQs).
A vintage test asks whether newer commercial cohorts show higher delinquency transitions than older ones. A loss-rate model can take in updated unemployment or property-market assumptions. The board question is whether forecasted loss, by segment and vintage, is moving with realized net charge-offs. If the model is calm and the 2024 curve is not, challenge the model. The fields those methods need are the loan-level items already listed with the data sources.
Loan Yield Adjusted for Credit Losses
Gross yield flatters the riskiest book. Two formulas correct it.
Loan yield equals annualized interest and fee income divided by average loans. Net yield after losses equals loan yield minus the annualized net charge-off rate. Apply both to the same $1,250 million example, and the ranking of the book changes character even when the order of the segments doesn't.
Commercial real estate at a 6.80% yield minus a 1.01% charge-off rate nets 5.79%. Credit cards at 21.00% minus 6.49% net 14.51%. Auto at 7.90% minus 1.21% nets 6.69%. The blended book earns 8.77% gross and 7.05% after the 1.72% charge-off rate.
Loss share is the decision metric
The useful cut is loss as a share of gross yield, not the net spread alone.
- Cards: 6.49 ÷ 21.00, about 31% of gross yield goes back out as loss.
- Commercial real estate: 1.01 ÷ 6.80, about 15%.
- Auto: 1.21 ÷ 7.90, about 15%.
Cards still show the widest net spread in this example. They also hand back nearly a third of gross yield, roughly twice the loss share of the other two segments. Card growth is therefore far more sensitive to a turn. A two-point rise in the card charge-off rate would consume another large slice of that 21% coupon. The same two points would wipe out the CRE coupon entirely, which is why CRE's lower loss share is not a free pass on concentration. Compare loss-to-yield by segment before you set pricing, growth targets, or risk appetite. The allowance for credit losses should move with that same segment view, or pricing and reserving will tell two different stories.
A wide coupon that returns a third of itself in charge-offs is a credit product with an interest rate attached, not a high-yield victory.
Three cautions keep the 7.05% from being misread. Fee income inflates headline yield, so report interest and fees on separate lines before anyone celebrates the card coupon. Yields lag when rates reprice, so use a trailing run of quarters rather than the latest month. Provision expense is a timing item. Net charge-offs are the loss. Compare yield with charge-offs, not with the quarter's reserve build. Growth can still flatter every one of these ratios, which is the next trap.
Benchmark Ranges for U.S. and Euro-Area Banks
Benchmark rates are useful only when their population, definition, and period match the question. The figures below are reference points, not targets, and the measures are not interchangeable.
| Benchmark | Value | Context |
|---|---|---|
| Delinquency rate, all commercial-bank loans, Q2 2001 | 2.17% | Pre-recession reference point |
| Delinquency rate, all commercial-bank loans, Q4 2007 | 2.91% | Before the financial crisis |
| Delinquency rate, all commercial-bank loans, Q4 2009 | 7.05% | Crisis peak, seasonally adjusted |
| FDIC past-due and nonaccrual rate, Q4 2025 | 1.56% | Versus a 1.94% pre-pandemic average |
| FDIC net charge-off rate, Q4 2025 | 0.63% | Versus a 0.48% pre-pandemic average |
| ECB NPL ratio, significant euro-area banks, Q4 2024 | 2.28% | Supervised euro-area banks |
| ECB NPL ratio, EU credit institutions, December 2024 | 1.97% | Up 0.06 percentage points year over year |
Which number belongs to which question
The Federal Reserve delinquency series provides seasonally adjusted cycle markers. The 2.17% rate in Q2 2001 and 2.91% in Q4 2007 help put descriptions of stress in historical context; the 7.05% rate in Q4 2009 marks the crisis peak. These figures calibrate delinquency severity, not charge-off triggers. They also do not show how performance varies among loan products or across newer and older vintages.
The U.S. industry anchor is the FDIC's fourth-quarter 2025 profile. Past-due and nonaccrual loans were 1.56%, below the 1.94% pre-pandemic average. The net charge-off rate was 0.63%, up 1 basis point from the prior quarter, down 8 basis points from a year earlier, and 15 basis points above the 0.48% pre-pandemic average (FDIC Quarterly Banking Profile, fourth quarter 2025). The two rates describe different stages of credit deterioration: past-due and nonaccrual balances indicate troubled loans on the books, while net charge-offs reflect losses recognized after recoveries.
A portfolio's aggregate rate can conceal several overlapping cycles. Segment mix affects the total, while new lending changes the denominator and may not yet have seasoned long enough to show losses. Use segment rates and vintage curves alongside the industry benchmark; a single all-loan figure cannot establish that each product is performing well.
Euro-area references and limits
The aggregate non-performing-loan ratio for significant euro-area banks was 2.28% in Q4 2024 (ECB banking supervision). For EU credit institutions, the ratio was 1.97% in December 2024, up 0.06 percentage points year over year (ECB press release). These are useful regional references, but they do not provide a direct ranking against U.S. delinquency or charge-off rates.
The ECB's NPL ratio measures a stock of non-performing loans. The Federal Reserve delinquency measure captures loans past due under its reporting definition, while the FDIC's net charge-off rate measures realized losses net of recoveries over a period. Different numerators, institution populations, and reporting frameworks make direct comparisons misleading. In particular, the U.S. past-due and nonaccrual rate should not be described as outperforming either euro-area NPL figure.
Set bank-level triggers by segment
For an internal comparison, review the UBPR peer median and top quartile for the bank's asset group, then set triggers using comparable definitions and periods. Compare each segment with its own historical performance, and examine vintage curves to distinguish worsening credit in established cohorts from growth in newer loans. This applies performance benchmarking as a monitoring control, rather than treating an industry average as a bank-specific target. Industry rates provide context; peer and segment measures identify where portfolio performance diverges.
Reading Performance Signals Without Being Misled
Four patterns make a ratio improve, or look stable, while the credit position gets worse. Each one has a test.
Growth that flatters the ratio
A bank grows loans from $1,000 million to $1,300 million, up 30%. Delinquent dollars rise from $20 million to $24 million, up 20%. The delinquency ratio falls from 2.00% to 1.85%. Anyone reading only the rate will call credit better. Problem balances are $4 million higher. New loans also haven't had time to go late, so the denominator is full of unseasoned credit. The test is dollars and the rate, side by side, plus the vintage curve on everything booked in the growth quarter. If new cohorts at month 6 already look worse than the prior year at the same age, the 1.85% is a timing gift.
Concentration that is not yet a loss
The OCC flags heightened attention when construction, land-development, and other land loans equal 100% or more of total capital. For non-owner-occupied CRE, the criterion is 300% or more of capital together with portfolio growth of at least 50% over the prior 36 months (OCC commercial real estate lending handbook). A bank at 315% of capital with 55% growth over three years isn't automatically unsafe. It does have to show how property type, geography, sponsor quality, and underwriting exceptions are controlled. Examiners look at diversification and standards, not at the ratio alone. Low charge-offs don't retire that file when maturities and tighter advance rates are stacking up. Peer benchmarking that flags banks approaching those thresholds is more useful than another all-bank average.
Reserves that diverge from migration
Under CECL, the methodology change mainly shifts when provision expense is recognized, not the eventual amount of net charge-offs. The allowance is management's estimate of expected loss and a contra-asset that reduces reported loans (Federal Reserve allowance guidance). A falling coverage ratio next to rising past-dues therefore needs an explanation the board can test: a model change, a sale of problem loans, or a real gap. Supervisory instructions also say known losses should be charged off promptly, not deferred or smoothed across periods. If charge-offs are being delayed to protect the coverage ratio, both numbers are fiction.
Modifications that hold the headline flat
Payment deferrals and modifications can keep a delinquency ratio unchanged while problem balances build. The test uses roll rates. Watch cures in the 30–59 day bucket against the share rolling into 60 days and beyond. If early-bucket rolls are steady and vintage curves are steady, a headline move is probably timing, seasonality, or mix. If rolls are worsening, or the newest vintage is already off the prior curve, act before the charge-off rate confirms it. Waiting for the annualized loss rate is how a quarter of lead time gets spent on a dashboard.
If roll rates and vintage curves are steady, treat the headline change as timing. If they aren't, the charge-off rate is a lagging confirmation, not a trigger.
Confirm Your Benchmark Routine Before the Next Credit Review
A useful benchmark routine begins with rates that reconcile and ends with a decision for each portfolio segment. Review the current book using the same sequence every quarter:
- Reconcile four quarters. Pull segment delinquency and net charge-off rates from Call Report schedules and confirm they tie to filed data. Resolve any mismatch before comparing performance.
- Rank each segment against peers. Use its UBPR percentile alongside the industry average. An average-looking result can still rank weakly among banks of similar asset size.
- Set segment triggers in advance. Compare results with the published ranges and the bank's own pre-pandemic baseline. A segment above its baseline warrants discussion even if it remains far below the 2009 peak.
- Separate growth and concentration effects. Review growth-adjusted ratios and roll rates monthly, and CRE concentration against OCC capital thresholds quarterly. Track delinquency dollars as well as the ratio, since portfolio growth can change the headline rate without reducing problem balances.
- Assign an owner to each trigger. Relationship managers follow early-warning accounts. The credit officer assesses reserves when coverage and migration diverge. Without a named owner, a trigger prompts no action.
The review should conclude whether each segment is above, at, or below its peer median, then identify any needed pricing changes, slower growth, or tighter underwriting. This keeps the response tied to the part of the portfolio showing stress. If a newer vintage departs from its earlier performance curve, adjust the underwriting box before charge-offs confirm the deterioration.
Visbanking's Bank Performance app provides Call Report and UBPR history for peer benchmarking, which can support the reconciliation and comparison steps without a manual extract. Bank Intelligence is another tool for monitoring risk signals. Use these tools to examine segment performance, but keep the benchmark decision grounded in reconciled rates, vintage trends, and growth effects. Benchmark your segments against that peer set, or explore the underlying data, at www.visbanking.com.
Visbanking brings Call Report, UBPR, and loan-performance history into segment benchmarks for credit committees. Viewing delinquency, charge-offs, and peer rank together makes it easier to identify which portfolio segment is changing before the overall ratio does. Benchmark your own segments against the peer set at Visbanking.
Latest Articles
Brian's Banking Blog
Predictive Risk Management for Banks
Brian's Banking Blog
Business Registration Data Banks Can Actually Use

Brian's Banking Blog
How to Secure REST API with JWT for Banking
Brian's Banking Blog
Commercial Loan Analysis: A Bank Executive's Guide
Brian's Banking Blog
Understanding Statistical Significance in Banking
Brian's Banking Blog