
Predictive Risk Management for Banks
Brian's Banking Blog
Nearly $685 billion in projected losses did not produce a loss. It produced a decision framework. That distinction explains why predictive risk management now matters to directors, not just modelers. Banks that can translate borrower, portfolio, and macroeconomic data into early, documented action protect capital and lending capacity. Banks that treat a score as an answer wait for reported results. The difference is operational, not mathematical.
Why Predictive Risk Management Now Defines Bank Resilience
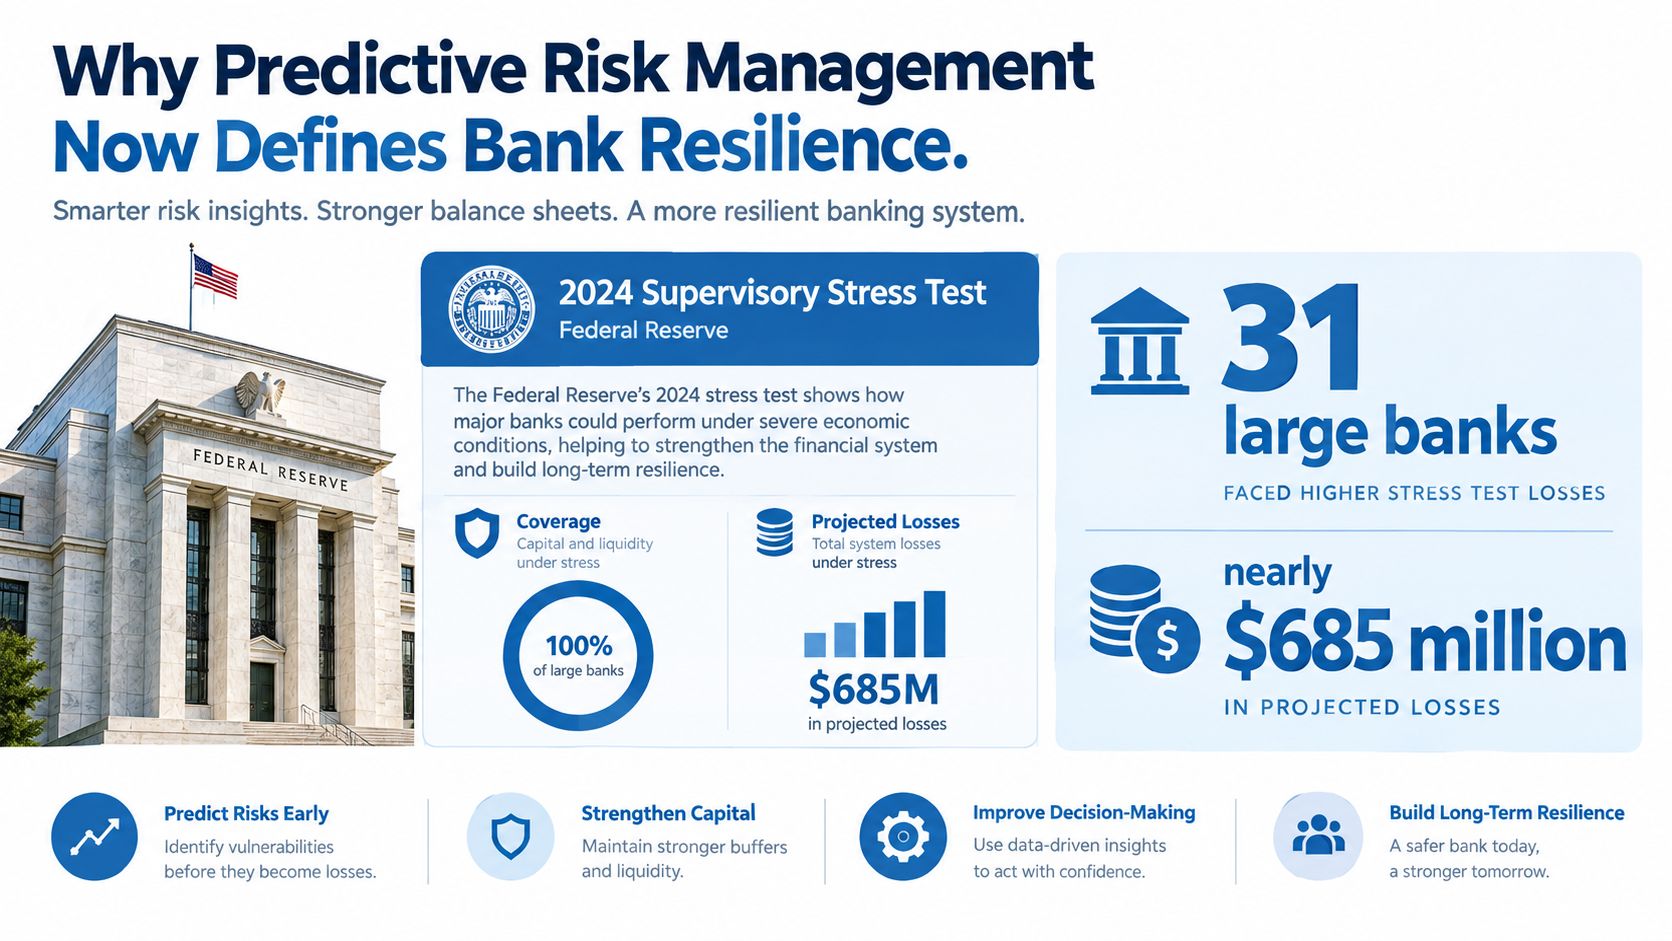
The Federal Reserve's 2024 supervisory stress test of 31 large banks projected nearly $685 billion in total losses, including approximately $175 billion from credit cards, $142 billion from commercial and industrial loans, and nearly $80 billion from commercial real estate, while all tested banks remained above minimum common-equity Tier 1 requirements. The useful lesson isn't the headline loss. It's where losses concentrate before they occur.
A separate summary of that exercise points to capacity to absorb severe losses while continuing to lend. Directors should read that as a management question. Where would your institution's losses cluster, which segments would turn first, and what would you change while you still can? Backward-looking reports answer a different question after the fact.
What the Term Means in Practice
Predictive risk management converts dispersed borrower, financial, and behavioral information into repeatable estimates of default probability, liquidity need, and capital impact. It then connects those estimates to underwriting, monitoring, pricing, and capital allocation. The forecast is only the middle of the process. Data arrive first. Governance and action must follow.
That process changes the board's role. Directors don't need to build models. They need to know which exposures the models cover, which assumptions drive the result, what threshold triggers action, and who owns the response. A forecast without those answers is commentary, not risk control.
A predictive signal earns its value when it changes a limit, a price, a reserve discussion, or an escalation decision while management still has options.
From Individual Loans to Institution-Wide Resilience
Loan-level prediction alone misses correlation. Scenario-based models combine institution data, macroeconomic assumptions, portfolio concentrations, projected revenue, expenses, and capital buffers. That combination shows how adverse conditions could affect several portfolios at once and whether earnings can absorb the shock. It also reveals where diversification is real and where it's only an accounting label.
The regulatory lineage reinforces the point. Supervisory stress testing moved from crisis response into recurring requirements for large banking organizations. Smaller institutions face different obligations, but the management logic travels. Identify a plausible adverse path, estimate its effect early, and assign the response before conditions force one.
Ask three questions this quarter. Which of our material risks have a forward estimate? Which estimates have a named owner and a pre-agreed threshold? Which signals can we trace to authoritative data within minutes during a committee meeting? Weak answers define your implementation agenda more clearly than a model inventory does.
How Credit Scoring Evolved into Modern Risk Systems
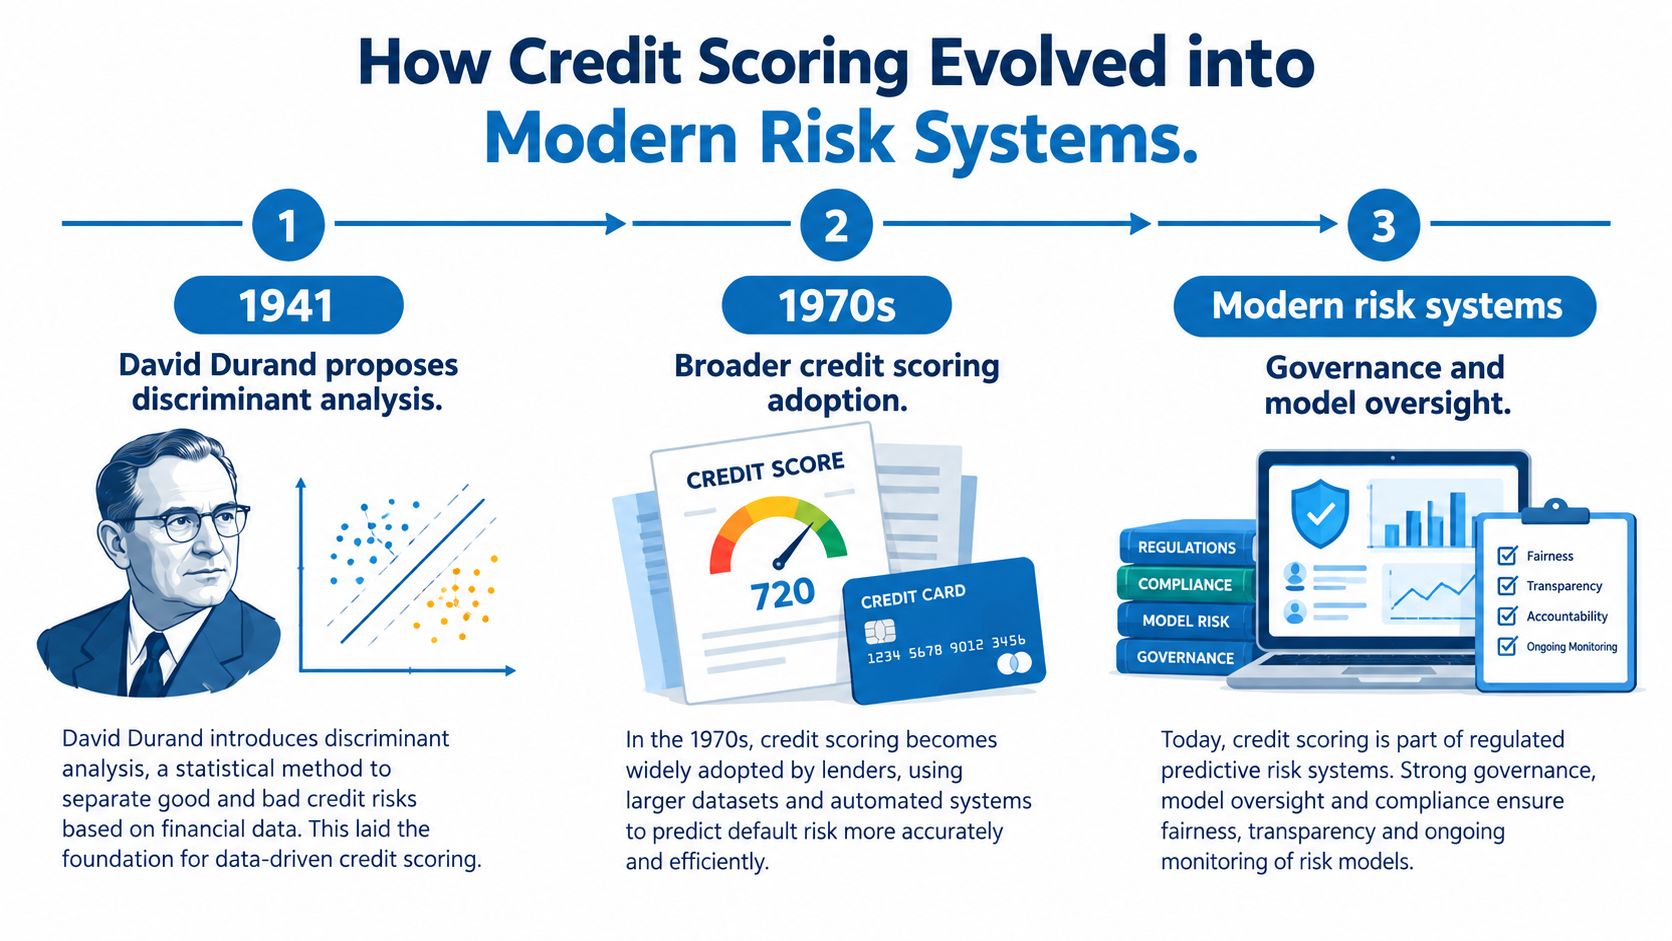
Modern systems look advanced. Their core idea is old. According to historical research on credit scoring, David Durand proposed discriminant analysis to distinguish good and bad loans in 1941, Edward Altman's 1968 Z-score model reported approximately 95% classification accuracy on its original data with firms above 2.675 considered substantially less likely to default, scoring gained major adoption during the 1960s, and it was used extensively for loan-application decisions by the 1980s.
Durand's contribution was conceptual. Borrower characteristics could be combined systematically instead of judged one at a time. Altman advanced that logic by using multiple accounting measures rather than a single ratio. One weak ratio might reflect timing or strategy. A pattern across measures carries more information.
Adoption Followed Lending Scale
Credit scoring expanded as bank and credit-card lending grew. Volume made purely individual judgment slower and less consistent. Statistical models offered repeatability across applications, branches, and underwriters. They also created records that management could test against realized outcomes.
That testability is the enduring point. Early scoring created a governance expectation that remains present today. Compare predictions with outcomes. Monitor deterioration. Document why a score changed a business decision. A model that can't be challenged against history shouldn't drive approvals just because it's newer or more complex.
From Technique to Regulated Discipline
Basel II strengthened the relationship between statistical credit-scoring models and internal ratings of borrower creditworthiness. That shift matters. Predictive assessment moved from optional analysis toward a core component of regulated risk management. Internal ratings influence how management views exposure quality and allocates attention across a portfolio.
Machine learning doesn't repeal those obligations. A more flexible model can detect nonlinear patterns and interactions that older scorecards miss. It can also hide unstable relationships inside apparently strong performance. The historical lesson for executives is direct. Demand evidence that the model classifies risk reliably, understand its decision boundaries, and require review when borrowers or conditions move beyond the data used to build it.
The Four Model Families Banks Actually Run
Banks don't need one master risk score. They need distinct models matched to distinct decisions. Credit models estimate borrower failure and loss. Concentration models detect correlated exposure. Liquidity models project funding pressure. Operational-risk models test whether internal failures and external events could produce losses outside normal experience.
Credit models start with probability of default, loss given default, and expected loss. Those measures support approval, risk grading, pricing, monitoring, and reserve discussions. Teams reviewing credit risk modeling approaches should insist that each output maps to a specific credit action, not just a color on a dashboard.
Segmentation determines whether those outputs reveal or conceal risk. Basel guidance supports segmenting exposures by product, geography, borrower type, collateral, and risk grade. An institution-wide average can look stable while one collateral class or metropolitan area weakens quickly. Management should review subportfolios where losses may be nonlinear.
Concentration and Liquidity Need Different Questions
The OCC framework provides a practical screen. Its concentration guidance notes that banks often combine a limit of less than 25% of capital with a credit-risk benchmark, so a bank with $400 million in capital would reach that screening level at $100 million in one segment. Size alone isn't enough. Monitor growth, credit-quality indicators, correlations, collateral trends, and stress results together.
Liquidity models apply the same forward logic to funding. They project cash needs under stress, examine deposit behavior and contingent draws, and test whether available funding sources remain adequate. The executive decision may involve balance-sheet composition, contingency planning, or earlier escalation to asset-liability management. Waiting for an actual outflow removes the benefit of prediction.
Predictive Risk Model Families and the Decisions They Inform
| Model family | Primary data inputs | Decision it informs | Regulatory benchmark |
|---|---|---|---|
| Credit | Borrower financials, payment behavior, collateral, risk grade | Approval, pricing, grading, monitoring | Internal ratings and expected-loss review |
| Concentration | Segment balances, growth, delinquency, collateral, correlations | Limits, heightened scrutiny, board escalation | OCC concentration monitoring |
| Liquidity | Deposits, funding maturities, commitments, market access | Funding plans and contingency actions | Scenario-based liquidity assessment |
| Operational | Internal losses, incidents, vendor events, controls | Reserves, staffing, controls, escalation | Comparison with severe historical losses |
Operational models require a tail test. Federal Reserve material describes a case where a model estimates $15 million of exposure while the bank has experienced a $22 million single loss and $28 million across its worst four-quarter period. That gap doesn't prove a new estimate. It proves the existing estimate needs challenge, missing-driver analysis, and possibly limits on use.
Data Sources and the Readiness Gap That Undermines Models
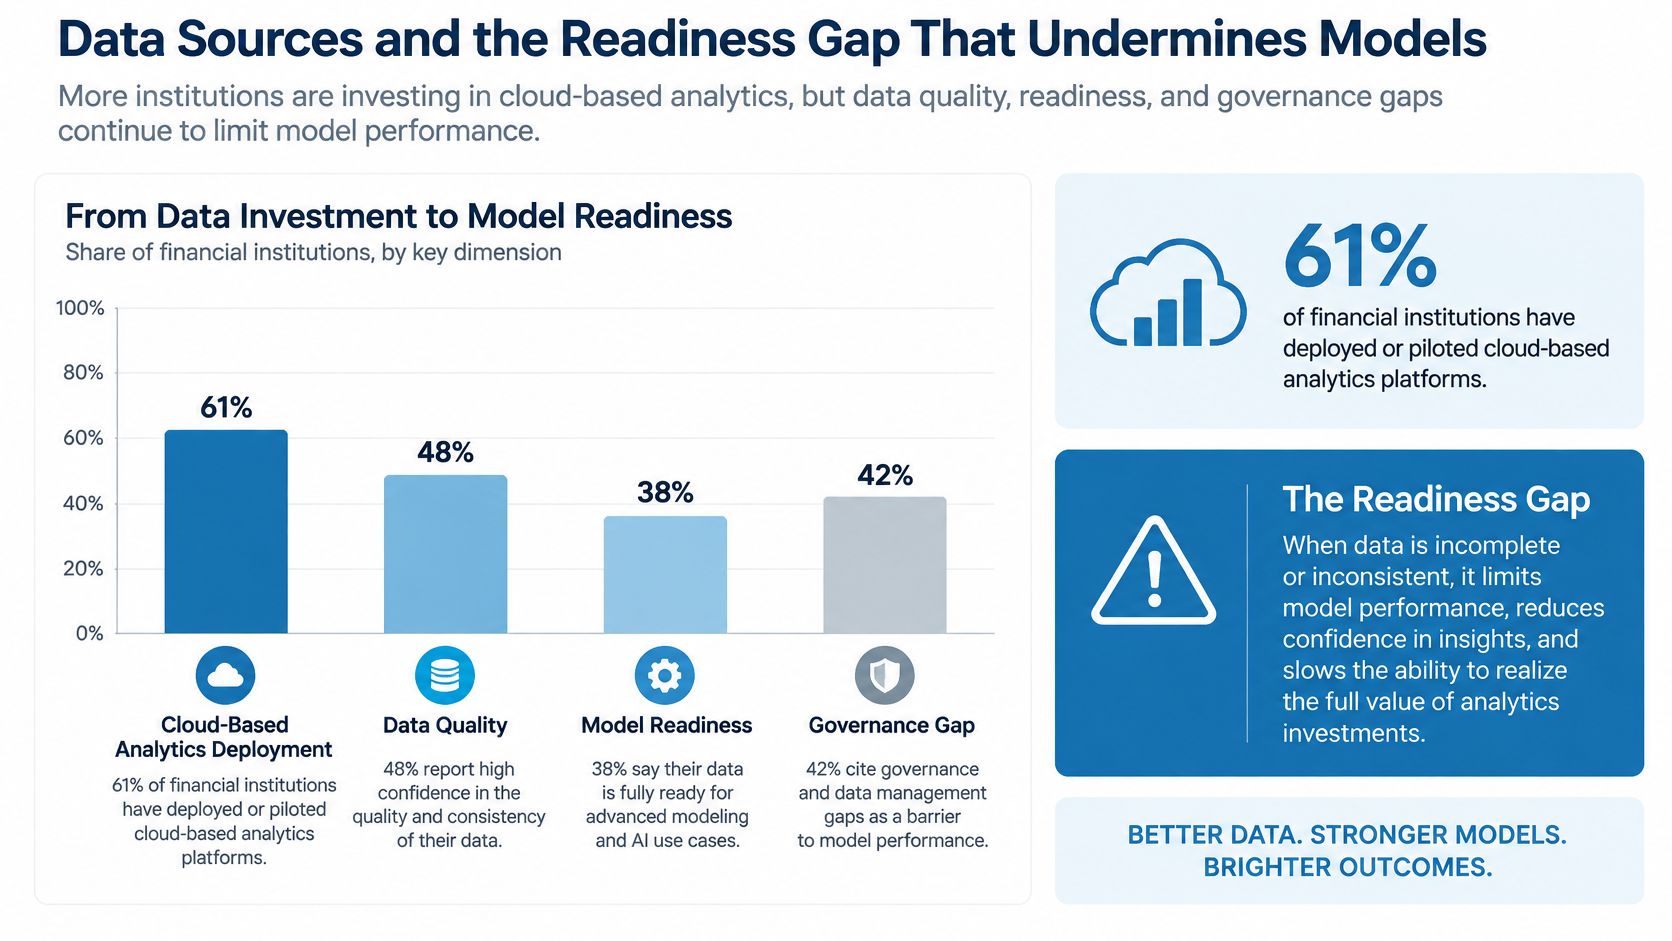
Model sophistication is running ahead of data readiness. Industry evidence reports that approximately 61% of financial institutions have deployed or piloted AI/ML, only 9.5% consider their data infrastructure very prepared, and obstacles include data quality at 48%, legacy-system integration at 40.5%, and regulatory concerns at 37.8%. That gap should reorder budgets. Better data controls often create more risk reduction than a more complex algorithm.
Sources That Build a Defensible Signal
A serious program combines institution and external records. FDIC call reports and FFIEC and UBPR filings establish reported financial position and peer comparisons. NCUA 5300 data serves a comparable function for credit unions. SBA program data, UCC filings, and HMDA records add lending and borrower context.
Market and economic records supply the forward environment. SEC and EDGAR disclosures can reveal borrower or counterparty developments, while BLS and BEA macro series provide labor and economic inputs for scenarios. No single source is sufficient. Regulatory data may be authoritative but lag conditions. Market data may be timely but noisy. Internal behavior may be current but incomplete outside the bank.
Smaller organizations outside banking face a similar discipline in matching evidence to decisions, and the risk management framework for Canadian SMBs from CloudOrbis Inc. offers useful context on structuring that work. For a bank, the standard is stricter. Each field needs ownership, definitions, freshness rules, and reconciliation to the source record.
Evidence chain: Every alert should carry its source records, data freshness, peer benchmark, confidence level, trigger threshold, recommended owner, and documented next action.
That chain changes vendor evaluation. Ask where each input originated, when it was updated, how entities were matched, and what happens when a source is missing. A simpler model with complete lineage and workflow integration can produce more defensible decisions than a more accurate model on fragmented data. Directors should interrogate freshness before they admire predictive accuracy.
Model Governance and Validation That Withstands Scrutiny
Governance begins with a precise definition. Federal Reserve guidance defines validation as verifying that a model performs as intended for its stated design objective and business use. Validation includes implementation testing, outcomes analysis, and judgment about whether changing products, exposures, customers, or market conditions require adjustment or replacement.
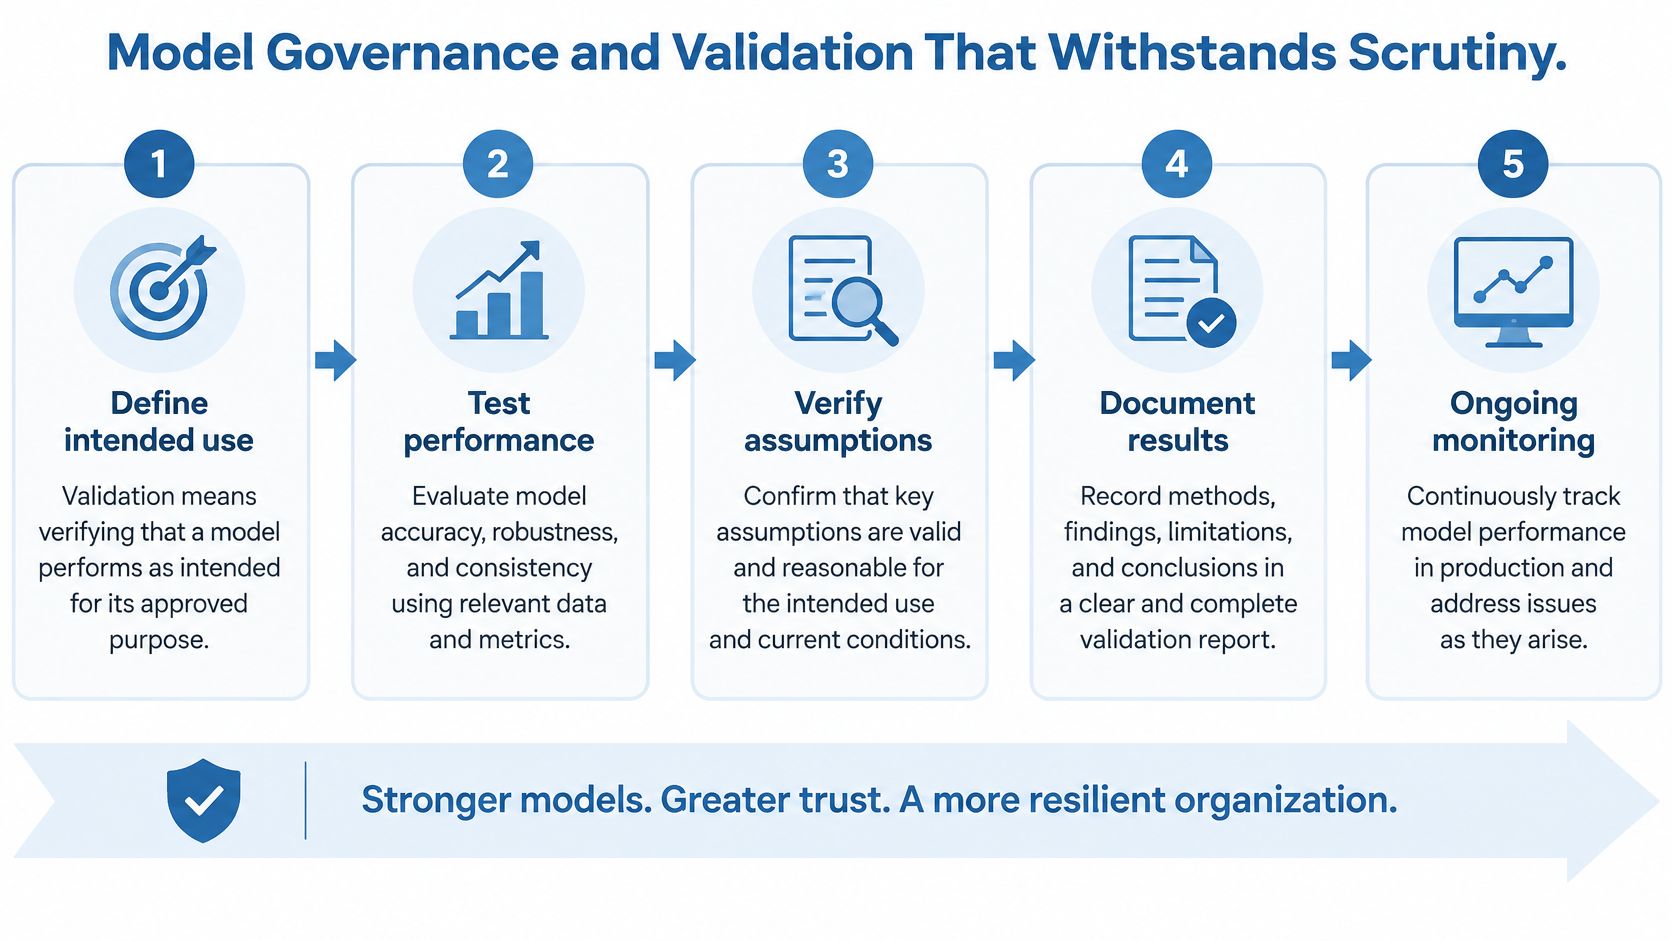
Build the Control Loop in Sequence
Start with a complete model inventory. Assign materiality tiers based on the decisions and exposures affected. Document intended use, prohibited uses, major assumptions, and limitations. Assign a business owner and an independent challenger. A risk team can't govern models it can't enumerate.
Next, validate before use and after significant change. Teams working through machine learning model validation practices should align the depth of review with materiality, not model novelty. Back-testing must use observations that weren't used for development. Performance should be monitored over the stated forecast horizon, at a frequency aligned with that horizon.
- Implementation testing: Confirm the deployed calculation matches the approved design.
- Outcomes analysis: Compare forecasts with realized default, attrition, or liquidity events.
- Use review: Check whether products, customers, or exposures have moved outside the approved scope.
- Independent challenge: Require review before changing thresholds or entering a new segment.
Security testing sits alongside model validation because governance evidence itself can become sensitive. Institutions assessing control documentation can use GLBA testing guidance for MSSPs from ThreatExploit AI as contextual reference while keeping model risk decisions grounded in supervisory expectations. Documentation that isn't protected and retrievable won't help during an examination or incident.
A Worked Calibration Example
Consider a supervised example from Federal Reserve guidance. In that illustration, a warning model flags leverage above 4.0 times EBITDA, while predicted deterioration of 8% versus observed deterioration of 12% across several quarters signals possible miscalibration. The flag shouldn't automatically change the borrower's risk grade or price. Review covenant waivers, industry conditions, collateral values, payment behavior, and recent financial statements first.
The calibration gap requires a separate action. Investigate the cause, recalibrate if justified, or temporarily limit automated use. Management should record which path it chose and why. That record turns governance from review language into an auditable decision process.
Choosing Between Dashboards, Scoring Tools, and Bank Intelligence Platforms
Most vendor comparisons ask the wrong question. Executives ask which interface looks clearest. They should ask which system shortens the path from evidence to accountable action. A polished display can still depend on stale extracts, unexplained definitions, and manual follow-up outside the system.
Static dashboards report what has already happened. They're useful for financial review, peer context, and trend inspection. Their weakness appears when a value changes. Who receives the signal, what evidence supports it, and what action is expected by when? If those steps live in email and memory, the dashboard isn't a predictive risk management system.
Standalone scoring tools answer a narrower question with one number. That can support consistent screening. It doesn't explain portfolio concentration, preserve scenario assumptions, or connect thresholds to workflow. A single score also invites false confidence when users can't inspect drivers, source freshness, or segment applicability. Precision in presentation isn't the same as reliability in use.
Criteria That Matter at the Executive Level
- Data lineage and freshness: Can users trace every signal to source records and update dates?
- Source breadth: Does the system combine regulatory, financial, market, and relationship data?
- Explainability: Does each alert show drivers, assumptions, and limitations?
- Routing and ownership: Does a threshold breach reach a named person with a required response?
- Audit completeness: Can management reconstruct what was known and decided at the time?
- Time-to-decision: How quickly can teams move from signal to documented action?
Integrated platforms are designed around those links. Visbanking's Bank Intelligence and Action System unifies financial, regulatory, market, and people data from FDIC call reports, FFIEC and UBPR, NCUA 5300, SBA programs, UCC filings, SEC and EDGAR, BLS and BEA series, and HMDA. Its Bank Performance app supports peer benchmarking and historical trend analysis across 4,600+ institutions. Bank Intelligence, currently in beta, surfaces predictive risk and performance signals through automated email, Slack, and CRM alerts.
Underneath the applications sit production-grade pipelines, MLOps, feature stores, observability, and secure APIs. Those are not technical ornaments. They support repeatability, monitoring, and auditability when a model or alert is challenged. Evaluate any platform the same way. Don't buy a risk number until you can inspect its evidence chain and decision workflow.
Implementing Early-Warning Signals and Automated Alerts
Deployment isn't the hard part. Sustained response is. A global banking survey found that only 19% of institutions have real-time AI model-drift monitoring, 42% lack defined kill switches for models crossing preset boundaries, and only 36% continuously retrain or update models. Those gaps explain why many programs produce alerts that staff eventually ignore.
Sequence the Build Around Decisions
First, define the decision each alert supports. A commercial real estate alert might trigger enhanced appraisal review, a limit discussion, or board reporting. A deposit alert might activate a funding review. Teams evaluating an early-warning system for banks should write the action before tuning the threshold.
Second, assemble and validate the data. Segment exposures by product, geography, borrower type, collateral, and risk grade. Then apply coherent scenarios and estimate changes in default probability, loss given default, expected loss, liquidity needs, and capital impact. Basel guidance states that stress-test data should be accurate, complete, sufficiently granular, and timely, with model sophistication matched to purpose and portfolio materiality.
Third, map every threshold breach to a named owner, response window, escalation path, and closure standard. Preserve scenario assumptions and model limitations beside the alert. Decision-makers need to distinguish early-warning evidence from a deterministic forecast before they act.
Separate Drift from Noise
Drift thresholds should reflect business outcomes, not statistical movement alone. Compare forecasts with realized results, use challenger benchmarks, and examine whether the portfolio or economy has moved outside the development sample. Temporary reporting anomalies call for investigation. Persistent calibration failure may require recalibration, rollback, advisory-only status, or retirement.
If nobody can explain what changed, who owns it, and when it must be resolved, an automated alert is only automated noise.
Measure more than accuracy. Track time-to-decision, alert-to-action conversion, false-positive burden, repeat alerts, and audit completeness. Review whether alerts improve portfolio and relationship decisions. Kill or redesign signals that consume staff time without changing outcomes. That's how an early-warning program stays credible with relationship managers and risk committees.
Turning Predictive Signals into Board-Level Action
Predictive risk management succeeds when a signal changes a decision. It fails when management admires a forecast and leaves limits, reserves, staffing, and escalation unchanged. Boards should therefore review outcomes, not model counts. Which alerts led to action? Which were wrong? Which risks remain outside coverage?
Run three checks now. Benchmark your risk posture against relevant peers. Confirm that material alerts have named owners, thresholds, and documented next actions. Trace the data behind selected signals to authoritative sources. Those checks expose whether you operate a monitored decision system or merely display scores.
Benchmark your institution's risk profile against peers, inspect the evidence behind emerging signals, and turn regulatory and market data into accountable next actions. Visit Visbanking to explore bank intelligence built for faster, better documented risk decisions.
Latest Articles
Brian's Banking Blog
Business Registration Data Banks Can Actually Use
Brian's Banking Blog
How to Secure REST API with JWT for Banking
Brian's Banking Blog
Commercial Loan Analysis: A Bank Executive's Guide
Brian's Banking Blog
Understanding Statistical Significance in Banking
Brian's Banking Blog
Option Adjusted Spread: A Banker's Practical Framework
Brian's Banking Blog