Uniform Bank Performance Reports: A Strategic Guide for Bank Executives
Brian's Banking Blog
For many bank executives, Uniform Bank Performance Reports (UBPR) are a compliance task—a regulatory report filed and forgotten. This is a significant strategic miscalculation.
These standardized reports are one of the most powerful intelligence tools available to your leadership team. They provide the definitive playbook for competitive analysis, proactive risk identification, and confident, data-driven decision-making.
Turning UBPR Data Into Decisive Action
Mastering UBPR data is no longer an ancillary skill; it is a core competency for modern bank leadership. These reports provide the objective evidence required to answer the most pressing questions from the board and stakeholders.
The value, however, is not in passively reading the report. It lies in translating dense financial data into strategic action. This guide reframes the UBPR—transforming it from a regulatory burden into a strategic weapon.
From Compliance Checkbox to Competitive Intelligence
The critical shift is one of mindset. Viewed through a purely regulatory lens, the UBPR is a historical report card. Viewed strategically, it is a predictive tool.
A declining Net Interest Margin (NIM) relative to your peer group is not a historical footnote; it is a clear and present threat to earnings that demands immediate attention.
Consider this scenario: Your bank's NIM is 3.10%, while your peer average stands at 3.45%. That 35-basis-point gap represents a substantial erosion of potential earnings. A deeper analysis of the UBPR might reveal the cause: an over-reliance on high-cost deposits or a loan portfolio yielding below-market rates. This insight provides the basis for action, such as launching a campaign for low-cost core deposits or re-evaluating loan pricing strategy.
Think of the UBPR as your bank's financial biography, with a new chapter added every quarter. Reading between the lines provides the context to benchmark performance, challenge legacy assumptions, and validate strategic effectiveness.
This cycle of analysis and action is the foundation of effective bank regulatory reporting. It transforms static numbers into a dynamic feedback loop that sharpens every facet of your operation.
Answering the Board's Toughest Questions
Ultimately, the UBPR provides the hard data to answer the board's most critical questions:
- How do we measure up against our true competitors? Direct peer comparisons provide an unvarnished view of where you lead and where you lag.
- Where are our primary vulnerabilities? Multi-quarter trend analysis can expose a gradual decline in asset quality or a growing liquidity risk long before it becomes a crisis.
- Which market opportunities should we pursue? Identifying peers with outsized growth in a specific loan category can signal a market segment your institution may be overlooking.
Mastery of uniform bank performance reports empowers your executive team to move beyond speculation and execute confident, evidence-based strategies that drive sustainable growth.
Understanding the UBPR Framework
To leverage the Uniform Bank Performance Report as a competitive tool, one must first understand its structure. The UBPR is not a random collection of data points; it is a standardized framework created by the Federal Financial Institutions Examination Council (FFIEC) to facilitate direct, objective comparisons among financial institutions.
Its power lies in translating raw Call Report data into a universal language of performance.
This common format enables true "apples-to-apples" comparisons, removing ambiguity from competitive analysis. Your bank is benchmarked against a specific peer group—institutions with similar asset sizes, geographic footprints, and business models. This context is critical. It measures your performance not in a vacuum, but against direct competitors facing the same market forces.
The Analytical Structure
The UBPR is designed for both high-level assessment and deep-dive investigation. It presents a top-down view, allowing executives to identify key trends and then drill into the underlying drivers.
- The 30,000-Foot View: The summary pages provide an immediate assessment of the bank's condition, covering core areas like profitability, capital adequacy, and asset quality.
- The Ground-Level Details: Subsequent pages systematically break down these summary figures, enabling detailed analysis of liquidity, earnings composition, and credit risk concentrations.
For example, a low Return on Average Assets (ROAA) on the summary page is a clear signal for further inquiry. The detailed pages are where you investigate the cause. Is it a compressed Net Interest Margin? Excessive noninterest expense? Or are loan loss provisions consuming profits? The report provides a clear path to the root cause.
Perhaps the most valuable component of the framework is its longitudinal perspective. The UBPR includes a rolling five years of financial data, updated quarterly. This historical context is essential for identifying trends and evaluating the long-term efficacy of your strategy. As the Federal Reserve's own materials demonstrate, this form of dynamic reporting has been a cornerstone of bank supervision for decades.
Think of the UBPR as your bank’s financial biography, written in the standard language of the industry. Understanding its structure is the first step to using that story to build a stronger future.
This multi-year data transforms the report from a static snapshot into a dynamic analytical tool. A single quarter of deteriorating asset quality might be an anomaly. A steady decline over 12-18 months, however, indicates a systemic issue requiring immediate board-level attention.
This is where data intelligence platforms like Visbanking provide a decisive advantage. They build on this foundational data, allowing executives to visualize trends instantly and benchmark against custom peer groups, converting raw data into actionable intelligence.
The Core Metrics That Define Bank Performance
The Uniform Bank Performance Report contains a vast amount of data, but effective executive oversight requires a focus on the handful of core metrics that reveal the true health of your institution.
These are not academic figures; they are the vital signs of your bank's operational strength, risk profile, and strategic execution. A disciplined focus on these indicators is the foundation of sound governance.
The CAMELS framework, used by regulators to assess an institution's safety and soundness, provides a valuable lens. For leadership, this means concentrating on the numbers that drive Capital Adequacy, Asset Quality, Management, Earnings, and Liquidity. A weakness in any one of these pillars inevitably places stress on the others.
The graphic below illustrates how standardized data flows—from raw regulatory filings to the final report—create the basis for this type of rigorous analysis.
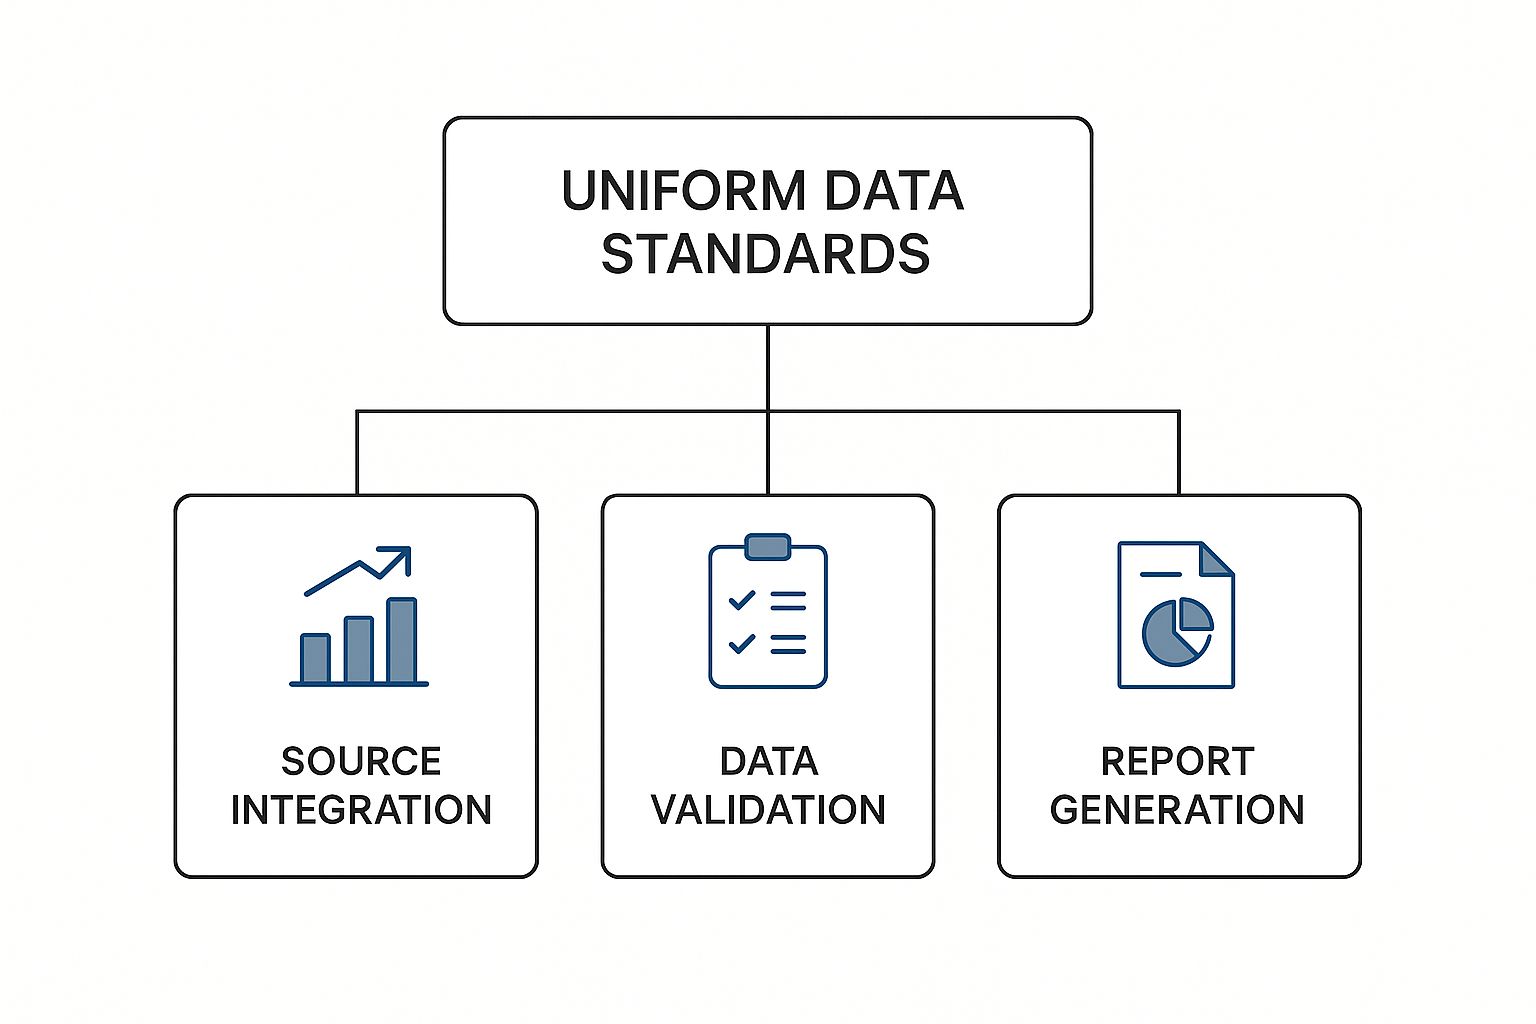
This structured approach is what enables the objective, "apples-to-apples" comparisons essential for effective benchmarking.
The power of the UBPR lies not in individual metrics, but in how they interrelate to narrate your bank's strategic story. The following table outlines the key indicators every bank executive and director should monitor.
Key UBPR Metrics and Their Strategic Implications
| Metric Category | Key Indicator | What It Measures | Strategic Importance for Executives |
|---|---|---|---|
| Capital Adequacy | Tier 1 Risk-Based Capital Ratio | The buffer of high-quality capital against potential losses from risk-weighted assets. | A high ratio signals financial strength and capacity for growth. A declining trend is an early warning to protect the balance sheet. |
| Asset Quality | Nonperforming Assets to Total Loans & OREO | The percentage of the loan portfolio that has soured. | This is a direct measure of credit risk. A rising ratio erodes earnings through provisions and signals underwriting or economic problems. |
| Management | Net Overhead Ratio | The cost of running the bank relative to its asset base, a key proxy for operational efficiency. | A lower ratio than peers indicates a significant competitive advantage, boosting the bottom line. |
| Earnings | Return on Average Assets (ROAA) | The ultimate measure of profitability—how well assets are being used to generate net income. | A consistent ROAA above 1.00% is the gold standard. A low number forces a hard look at pricing, efficiency, and strategy. |
| Liquidity | Net Noncore Funding Dependence | Reliance on "hot money" (like brokered deposits) versus stable, core deposits. | A high ratio reveals vulnerability to market shocks when less loyal funding sources quickly disappear. |
Each of these metrics provides a critical piece of the institutional puzzle. Viewed in concert, they offer a panoramic perspective on the bank's health, enabling leadership to shift from reactive management to proactive, strategic direction.
Capital Adequacy and Asset Quality
Capital is your bank's primary defense against unforeseen losses. The Tier 1 Risk-Based Capital Ratio is the definitive metric, measuring your highest-quality capital against risk-weighted assets.
A ratio comfortably above regulatory minimums—for example, 10% or higher—demonstrates strength and provides strategic flexibility. A downward trend in this ratio, even if it remains above regulatory thresholds, warrants immediate board-level scrutiny.
Asset quality, in turn, is the primary driver of risk to that capital. The ratio of Nonperforming Assets to Total Loans and Other Real Estate Owned is the critical indicator. When this figure rises, it signals potential weakness in credit underwriting or a deteriorating economic environment, leading to higher loan loss provisions that directly impact earnings and capital.
For instance, an increase in this ratio from 0.50% to 1.25% over two quarters is not a minor fluctuation—it is a significant warning of emerging stress within the loan portfolio.
Management and Earnings Performance
While regulators do not grade management teams directly, the Net Overhead Ratio serves as a powerful proxy for operational efficiency. This metric (Noninterest Expense minus Noninterest Income, divided by Average Assets) reflects the cost discipline of the institution.
A low and stable ratio indicates effective management. If your bank's ratio is 1.75% while peers operate at 1.50%, you have identified a significant efficiency gap that is directly constraining profitability.
This flows directly to earnings. Among the many profitability metrics, Return on Average Assets (ROAA) is the ultimate measure. It reveals how effectively management deploys the bank's assets to generate net income.
A consistent ROAA above 1.00% is the hallmark of a high-performing institution. A figure below this benchmark necessitates a rigorous review of margin, efficiency, and overall strategy. For a deeper analysis, review our guide to essential bank performance metrics.
Liquidity and Funding Stability
Finally, liquidity—the ability to meet obligations without resorting to forced asset sales—is paramount. The Net Noncore Funding Dependence ratio is the critical measure here, indicating reliance on volatile funding sources like brokered deposits.
A high ratio, perhaps exceeding 25%, signals significant vulnerability. In times of market stress, these funds are the first to exit, creating a potential liquidity crisis.
A well-managed bank demonstrates balance across these five pillars. Superior earnings cannot sustainably compensate for eroding capital or poor asset quality.
A firm command of these key UBPR metrics is what separates reactive managers from proactive leaders. With a data intelligence platform like Visbanking, you can instantly benchmark these ratios against custom peer groups, transforming standardized data into a powerful competitive edge.
Putting UBPR Data to Work: Real-World Scenarios
This is where the theoretical value of Uniform Bank Performance Reports is realized. Applying this data to concrete scenarios reveals how these metrics illuminate strategic decisions, highlighting both effective execution and emerging risks.

Let's examine two hypothetical institutions, "Bank A" and "Bank B." By analyzing their data, your leadership team can develop the pattern recognition needed to identify these same critical trends in your own reports. This exercise transforms boardroom conversations from subjective debates into data-driven strategic planning.
Bank A: The Blueprint for Sustainable Growth
Bank A represents a model of disciplined, profitable growth. Its UBPR data reveals a clear strategy backed by strong risk management and balanced execution. The numbers show intentional, well-managed expansion, not growth for its own sake.
This profile is characteristic of institutions that successfully pair ambition with strong fundamentals. Consider Illinois National Bank (INB). A recent analysis showed asset growth from $1.1 billion to $2.1 billion in five years—a 17% compound annual growth rate.
Critically, this growth was supported by a 13.8% compound annual growth in net operating income. They maintained a strong Tier 1 Risk-Based Capital (RBC) ratio of 11.23% and a conservative loan-to-deposit ratio of 90.2%. This case demonstrates how UBPR metrics make it unequivocally clear when asset-liability management is being executed effectively.
A strong UBPR profile like Bank A’s is defined by:
- Rock-Solid Capital: Capital ratios are robust and grow in lockstep with the balance sheet, providing a crucial buffer against economic downturns.
- Pristine Asset Quality: Nonperforming assets remain low and stable, confirming that underwriting standards have not been compromised to achieve loan growth.
- Stable Funding: A heavy reliance on core deposits indicates a stable, low-cost funding base, reducing dependence on volatile wholesale sources.
A strong UBPR is not about achieving perfect scores across every metric. It is about demonstrating balance and proving that leadership is adeptly managing the inherent trade-offs between growth, profitability, and risk.
Bank B: A Cautionary Tale of Unchecked Growth
Bank B’s UBPR tells a starkly different story—one of aggressive, high-risk expansion. This scenario mirrors the underlying issues seen in recent bank failures, where explosive growth masked a fundamentally weak foundation.
The warning signs are readily apparent in the data for those prepared to see them. Bank B may boast of doubling its asset size in under three years, but its UBPR reveals deeply concerning trends.
- Risky Funding Mix: Growth is not funded by loyal, local depositors but by a high concentration of uninsured or brokered deposits. Its Net Noncore Funding Dependence ratio might jump from 10% to a precarious 40% in just a few quarters.
- Mismatched Assets and Liabilities: In a chase for yield, the bank deploys this volatile funding into long-duration, fixed-rate assets, creating a significant interest rate risk exposure.
- Thinning Capital: While capital ratios may appear adequate at first glance, they are not keeping pace with the rapid expansion of the bank’s increasingly risky asset base.
This contrast underscores why uniform bank performance reports are indispensable. They provide the standardized, objective data needed to differentiate between genuine, well-managed success and a high-stakes gamble.
For leadership teams using a platform like Visbanking, benchmarking these key metrics against a custom peer group transforms this analysis from a quarterly compliance exercise into a continuous source of strategic advantage.
Expanding Your View with FR Y-9C Reports
An analysis limited to Uniform Bank Performance Reports provides an incomplete picture. While a subsidiary-level review is essential, it can obscure significant risks accumulating at the holding company level. For this reason, astute bank executives and directors must also master the Consolidated Financial Statements for Bank Holding Companies, known as the FR Y-9C report.
The FR Y-9C is the essential counterpart to the UBPR. It provides a consolidated view of the entire organization, including non-bank subsidiaries engaged in activities such as wealth management or equipment leasing. This enterprise-level perspective is a non-negotiable component of effective governance. A subsidiary bank that appears healthy on a standalone basis could be masking problems at an affiliate or exposed to risks originating from a non-bank operation.
The FR Y-9C provides the board with a complete, unvarnished view of the entire enterprise. It answers the ultimate question: What is the true financial condition of the consolidated company, not just the insured depository institution?
Understanding the Regulatory Scope
The Federal Reserve mandates this report to monitor the systemic health of the parent company, recognizing that the stability of a Bank Holding Company (BHC) directly affects its subsidiary banks. The evolution of its filing requirements is telling. As a key supplement to the Uniform Bank Performance Report system, the asset-size threshold for filing the FR Y-9C has increased from $150 million in 1978 to $3 billion by 2018. A review of the Federal Reserve’s own documentation shows this reflects a deliberate strategy to focus oversight on larger, more complex organizations while managing regulatory burden.
The regulatory message is clear: as an organization's complexity grows, the board's scope of oversight must expand in parallel. Relying solely on bank-level UBPR data is akin to navigating a vessel by monitoring only the engine room, blind to the external conditions that pose the greatest threat.
For executives, integrating FR Y-9C data into your analysis is a strategic imperative. It provides the context to understand capital allocation across the enterprise, identify consolidated liquidity pressures, and assess risks that exist entirely outside the bank. A modern data intelligence platform can seamlessly integrate this holding company data with UBPR metrics, providing an immediate, multi-dimensional view of performance.
Explore how Visbanking’s comprehensive data tools can illuminate your full financial picture and reveal how your entire organization truly measures up.
Activating Your Data with Modern BI Tools

Raw Uniform Bank Performance Reports contain immense strategic value, but their static, dense format is a significant impediment to timely analysis. Leadership teams cannot afford to wait weeks for analysts to manually process PDFs and spreadsheets. The market moves too quickly.
The transformative potential is unlocked when this data is integrated into a modern business intelligence (BI) framework. This is the bridge from static compliance documents to dynamic, forward-looking strategy.
From Data Overload to Decisive Action
Modern BI platforms, like Visbanking, convert dense reports like the UBPR into interactive, actionable intelligence. Instead of manually cross-referencing pages, executives can instantly visualize performance trends, benchmark against custom peer groups, and drill down into the root causes behind the data.
This fundamentally changes the strategic dialogue in the boardroom.
Consider an executive who notes from a UBPR that a peer bank is achieving a 1.15% ROAA while their own institution is stalled at 0.85%.
Historically, this observation would trigger a time-consuming research project. With a BI tool, it initiates an immediate, data-driven investigation. That same executive can instantly filter peers by asset size and geography, compare loan portfolio compositions, and analyze overhead ratios side-by-side—all in a matter of clicks.
This capability allows leadership to shift from asking "what happened?" to determining "what is our next move?"
Platforms like Visbanking are the engine for this transformation, converting a regulatory requirement into a distinct competitive advantage. You can see practical applications in these powerful financial dashboard examples that bring key metrics to life.
By activating your performance data, you empower your team to make smarter, faster decisions across all domains, from capital allocation to risk management. The question is no longer whether you possess the data, but whether you have the tools to act on it.
Straight Talk on UBPR Strategy
Bank leaders consistently ask how to translate the theory of Uniform Bank Performance Reports into practical application for the boardroom. Here are direct answers to the most frequent questions.
How often should our board review UBPR data?
Quarterly. There is no substitute.
A single data point is an anecdote; the value lies in trend analysis. A Net Interest Margin that declines from 3.45% to 3.20% over nine months while peers hold steady at 3.50% is a material signal of strategic drift. It requires attention now, not at the next annual planning session.
Can we create custom peer groups?
You not only can, you must.
The standard FFIEC peer group is a blunt instrument. True strategic insight comes from precision. A modern data platform allows you to construct custom peer groups based on geography, asset size, business model, or any other relevant criteria. This is how you ensure you are benchmarking against your actual competitors.
The most common strategic error is fixating on a single outlier metric without understanding its context. A high loan-to-deposit ratio could signal excessive risk, or it could be the intended outcome of a successful market expansion strategy. Context is paramount.
What is the biggest mistake banks make with the UBPR?
Failing to connect the data to the bank's strategic narrative.
An efficiency ratio that appears elevated is not inherently negative. It could be the direct result of a significant investment in technology poised to drive future profitability. The UBPR tells you what is happening. It is the responsibility of leadership to explain why.
Stop treating your regulatory data as a compliance burden. It is time to transform it into your most potent strategic asset. Visbanking developed the Bank Intelligence and Action System (BIAS) to enable you to do precisely that—benchmark performance, identify market opportunities, and make decisions with unparalleled confidence. Discover what you have been missing at https://www.visbanking.com.
Related Articles

Visbanking Blog
Revolutionize Your Bank's Performance with BIAS: Unlocking the Future of Visual Banking Data

Visbanking Blog
Unveiling Insights: Exploring Performance Conditions of US Banks with Visbanking Banking Report Portal

Visbanking Blog
Revolutionizing Banking Analysis: Introducing the Bank Comparisons Tool on Visbanking Banking Report Portal

Visbanking Blog
Banking Data Analytics: Turning Information Into Profit

Visbanking Blog
Visbanking Unveils Interactive Quarterly Banking Profile, Available One Month Ahead of FDIC Release

Visbanking Blog