
Bank Benchmark Rate: How Banks Price and Compare
Brian's Banking Blog
A 100-basis-point increase can reduce new lending by about one-third more in predominantly fixed-rate banking systems than in variable-rate systems, according to euro-area banking findings discussed by Risk Free Rates. The difference isn't the headline interest rate. It's which balance sheet absorbs the shock when funding costs rise and existing loans can't reprice.
For directors and CFOs, that's the useful way to approach a bank benchmark rate. Identify the reference, translate its movement into contractual cash flows, and compare your bank's response with similar institutions. Choosing the higher or lower index isn't the decision. Protecting an adequately compensated balance sheet is.
What a Bank Benchmark Rate Prices
A customer rate isn't a policy rate. A bank benchmark rate is the published reference against which a loan, deposit, or security is priced. The contract must identify that reference before management can attribute a change in earnings to the market rather than to its own pricing decisions.
Consider a CFO reviewing a commercial loan whose coupon hasn't moved after a policy announcement. The lending officer says the loan floats. Treasury says market rates have changed. Both statements can be correct, but neither establishes what the borrower owes without the named index and reset terms.
The historical distinction matters: the federal funds target was 9.5% on October 1, 1982, and 3% on October 1, 1992, while the Federal Reserve's standard daily historical series begins in July 1954, according to the Federal Reserve's historical analysis.

Separate the instruction from the transaction
The target expresses the central bank's policy setting. The effective rate describes the realized overnight market rate. A target range adds further distinctions between its bounds, midpoint, and the observed rate.
Those aren't interchangeable fields in a pricing model. If management substitutes a policy headline for a contract's reference, the resulting sensitivity analysis can assign income to the wrong period or misstate the amount that will reset.
Boardroom rule: Ask which contractual reference changed, not merely whether the Federal Reserve moved.
Require management to reconcile the customer coupon into identifiable components:
- Reference rate: The exact published series named in the agreement.
- Contractual spread: The increment charged above that reference.
- Reset provisions: The conditions determining when the coupon changes.
- Constraints: Floors, caps, and other terms that limit pass-through.
That reconciliation gives directors a defensible starting point for reviewing asset yields, funding costs, and net interest margin. Without it, a rate discussion can sound precise while remaining disconnected from the bank's actual cash flows.
Rates U.S. Banks Actually Reference
Bank benchmark rates executives price against
| Benchmark | Market observed | How the figure is set | Typical bank use |
|---|---|---|---|
| Effective federal funds rate | Overnight unsecured lending of reserve balances | Market print; the Fed sets a target or target range | Base for short-term rates and analysis of loan and deposit transmission |
| Prime rate | Rate charged to the most creditworthy commercial customers | Posted convention, commonly about 3 percentage points over federal funds | Variable commercial and consumer loans |
| SOFR | Secured overnight financing of U.S. Treasuries in repo | Transaction-based repo benchmark; federal law recognizes 30-day, 90-day, and 180-day Average SOFR in the statutory definitions | Replacement reference for USD LIBOR loans and fallbacks |
| Legacy USD LIBOR | Former quoted unsecured interbank term rate | Panel submissions; no longer the reference for new USD contracts | Legacy contracts and fallback comparison only |
| SONIA | Sterling overnight unsecured deposits | Transaction-based overnight sterling benchmark | Sterling reference only, not a U.S. funding proxy |
The decision is not which index is higher. It is which balance sheet absorbs a basis-point shock, and how the contract's reset terms turn that change into cash flow. A committee comparing prime-linked and SOFR-linked portfolios must account for what each reference measures before judging reported yields.
Prime is a customer-pricing convention, not a direct measure of secured wholesale financing. A prime-linked loan can show a different yield from a repo-indexed loan without either bank earning a stronger risk-adjusted spread. Compare the contract's reference, spread, and reset provisions, then assess the cash-flow effect on both assets and funding.
Reject mismatched comparisons
SOFR is not a sound standalone comparator for an unsecured sterling exposure. SONIA is not a proxy for a dollar-funded commercial loan. Legacy LIBOR helps explain the economics of existing contracts and fallbacks, but it is not a current reference for new dollar production.
Long historical comparisons also require a consistent interpretation. The Bank for International Settlements' U.S. policy-rate series uses the effective federal funds rate through December 18, 1985, and the target midpoint from December 19, 1985, onward. A chart spanning that boundary combines a realized market rate with an announced policy measure.
Before comparing bank yields, require analysts to align:
- Currency and market: Compare exposures priced and funded in economically comparable markets.
- Named reference and tenor: Distinguish a daily overnight observation from an average or term reference.
- Spread and product: Separate index differences from compensation for credit and relationship economics.
- Measurement period: Match the rate observation period to the income period being reported.
Do not rank lending teams by gross yield when their contracts use different references. Compare like-for-like spreads, then weigh the associated credit, liquidity, and capital demands. A higher coupon alone does not establish better pricing. A few basis points can change cash flows differently across portfolios, so the contract conventions and balance-sheet exposure belong in the same decision.
How Each Benchmark Is Built
How each bank benchmark rate is calculated
| Benchmark | Inputs | Statistic | Publication |
|---|---|---|---|
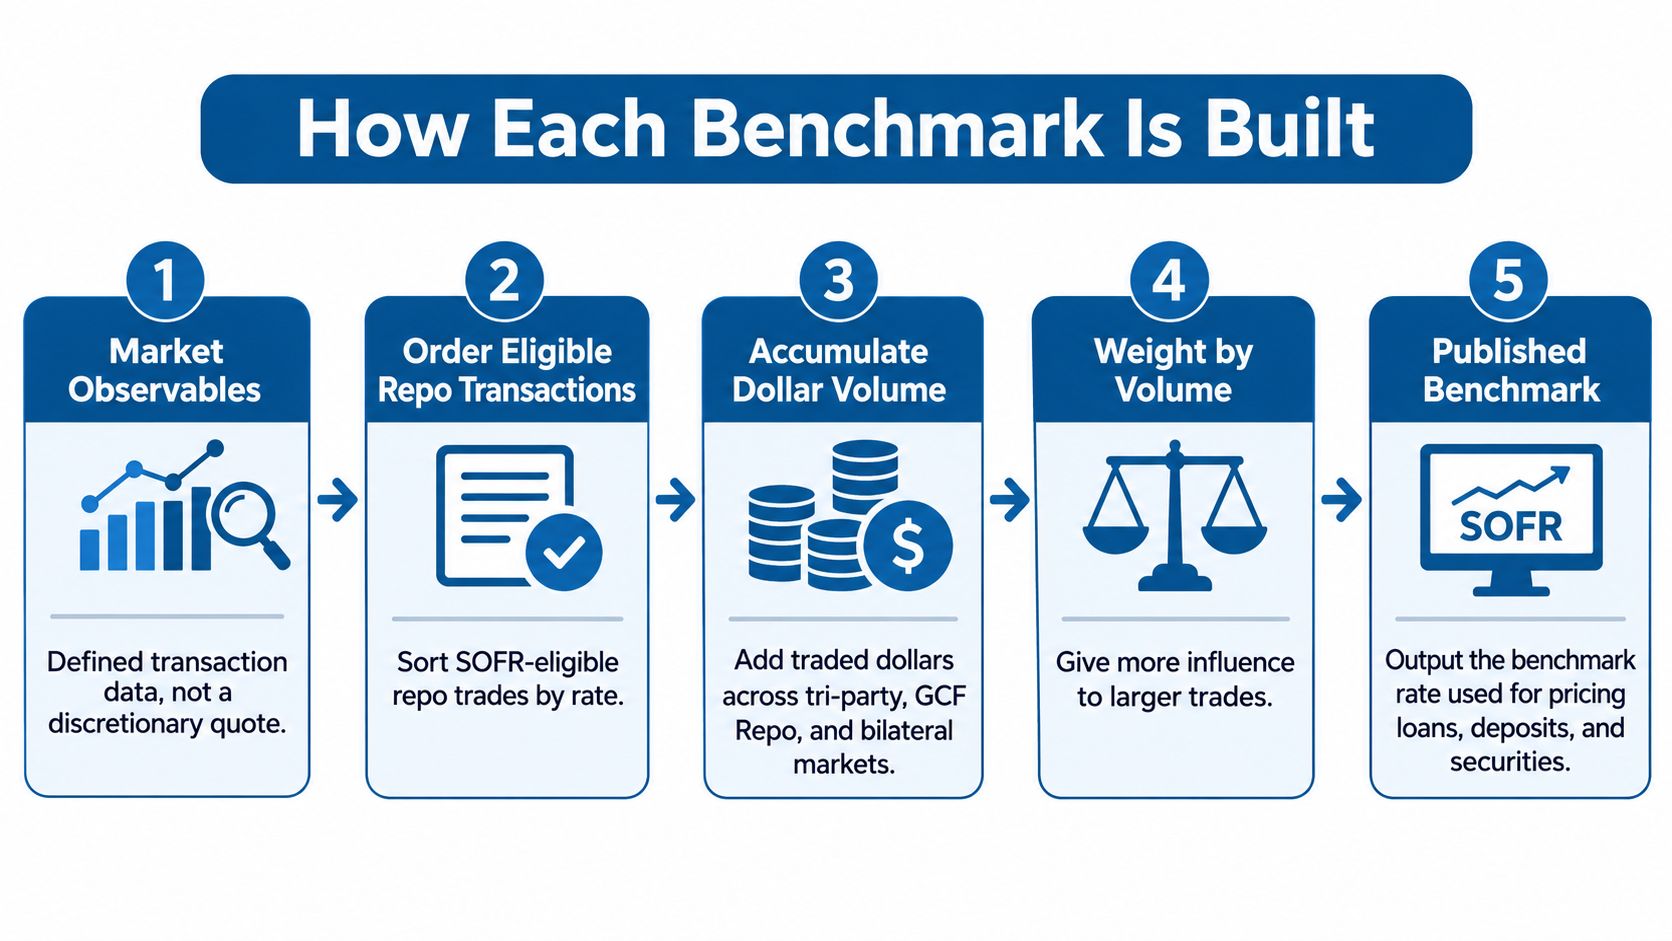
| Secured Overnight Financing Rate (SOFR) | Tri-party, GCF Repo, and FICC-cleared bilateral DVP repo transactions | Volume-weighted median at the 50th volume percentile | Rounded to the nearest basis point, under the New York Fed's methodology |
| Sterling SONIA | Eligible sterling unsecured overnight deposits of at least £25 million, executed between 00:00 and 18:00 UK time | Volume-weighted trimmed mean of the central 50% | Four decimal places, under the Bank of England's SONIA policies |
| Effective federal funds rate | Overnight reserve-balance trades between depository institutions | Realized market-rate observation | Historical effective-rate series |
| Federal funds target | Policy decision by the FOMC | Announced target or target range, not a transaction statistic | Announced by the FOMC |
| Prime rate | Posted rate for the most creditworthy commercial customers | Bank pricing convention, not a transaction median | Set by banks; generally linked to federal funds |
For SOFR, administrators sort eligible transactions by rate and accumulate their dollar volumes. They then identify the median by traded volume rather than by counting transactions. A small, unusual trade therefore doesn't receive the same influence as a large share of the underlying market.
That distinction is central to interpreting the benchmark. SOFR describes secured market financing conditions. It doesn't calculate what your institution should charge for borrower credit risk, committed liquidity, servicing, or capital.
Different statistics answer different questions
SONIA's trimmed mean and SOFR's median aren't competing answers to an identical question. Administrators apply different calculations to different eligible markets. The resulting rates need to be interpreted within those definitions.
A policy target is a different object altogether. Policymakers announce it; administrators don't derive it by sorting customer or funding transactions. Prime adds another category because banks post it as a customer reference.
For a director, the practical requirement is data lineage. Treasury should be able to trace a displayed rate back to its administrator, market, calculation rule, and observation period without reconstructing the process manually.
- Store the definition: Preserve the administrator and source series, not just the rate label.
- Retain the observation: Record the date, tenor, and relevant transaction segment.
- Identify the regime: Flag methodology changes and target-versus-effective distinctions.
- Preserve contract context: Keep reset conventions and spreads beside the reference.
Don't allow the reporting team to overwrite those fields with a generic benchmark column. Once the definition disappears, analysts can't reliably distinguish a pricing exception from a market-data mismatch. Clean lineage is a control over both earnings analysis and customer billing.
Basis Points on Real Balance Sheets
Start with the arithmetic. In a hypothetical example using the prime convention described by the Minneapolis Fed, federal funds at 5.25%, plus a 3-percentage-point prime spread, produces prime of 8.25%; adding a 1.00% loan spread produces 9.25%.
That's an indicative pricing scenario, not a current quote. The committee's next question should be how much income changes when the reference moves.
Annualized interest from a benchmark move
The following scenarios hold balances and other pricing terms constant; the prime calculations extend the Minneapolis Fed example, while the SOFR case applies the explicitly recognized average-rate structure.
| Case | Balance | Benchmark move | Annualized interest change |
|---|---|---|---|
| Prime plus 1.00% loan | $50 million | 25 basis points | $125,000 |
| Prime-linked book, full reset | $50 million | 100 basis points | $500,000 |
| 30-day Average SOFR plus 2.00% | $100 million | 50 basis points | $500,000 |
These are annualized interest-income sensitivities, not forecasts of net earnings. They exclude prepayments, unused commitments, balance changes, credit migration, and contractual restrictions. They also assume the benchmark move reaches the coupon in full.
Make the assumptions visible
A floor can prevent an upward reference-rate move from increasing the customer's coupon until the reference clears the contractual threshold. A cap can limit the bank's participation later. Management must apply those terms before presenting an earnings benefit to directors.
The loan spread also requires separate scrutiny. If lenders concede spread on new production while the benchmark remains stable, weaker pricing can disappear inside a blended portfolio yield. Compare new originations with renewals and the back book rather than attributing every change to monetary policy.
Ask management for a compact exposure schedule:
- Prime exposure: Outstanding balances tied to prime, with floor status and reset eligibility.
- SOFR identification: Balances tied to a named average or term structure rather than an ambiguous label.
- Spread exceptions: Concessions approved at origination or renewal, with the commercial rationale.
- Funding offset: The liability costs expected to change over the same period.
A dollar of additional loan interest isn't a dollar of additional margin if the funding expense rises alongside it.
Our guide to cost of funds for banks provides the liability-side framework for that review. Use it to connect the loan sensitivity schedule with actual funding categories, not merely a blended expense ratio.
The recommendation is straightforward: approve a spread change only after treasury and lending reconcile gross interest sensitivity with funding exposure. A loan-pricing decision that excludes the liability side is incomplete.
Same Index and Different Cash Flows
A quarterly $200 million facility with a 75-basis-point difference between reference-rate conventions has an annualized cash-interest difference of approximately $1.5 million, using the scenario accompanying the New York Fed's guide to published SOFR averages. That isn't necessarily the amount payable for the quarter. It's the annualized scale of the convention gap.
In-advance structures use observations from before the interest period. In-arrears structures use observations during it. The borrower can receive greater payment predictability under the former, while the latter more closely reflects financing conditions experienced during the borrowing period.
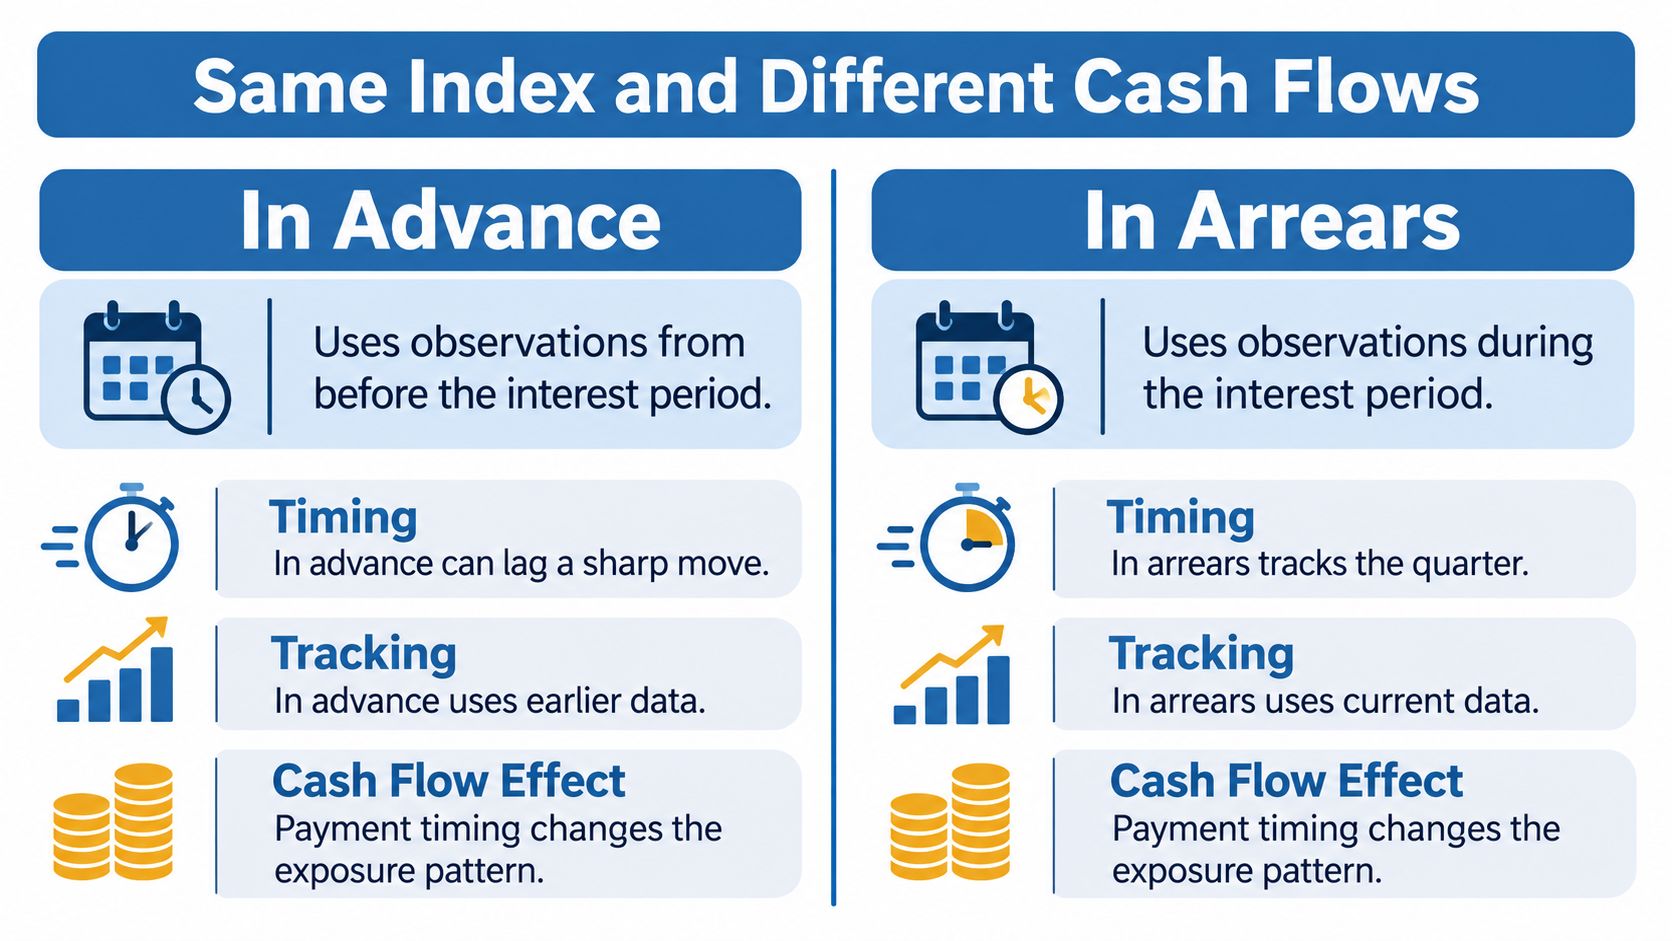
Lookbacks, lockouts, and payment delays can give borrowers more notice. They don't eliminate the economic distinction between using earlier observations and using observations from the current period. Relationship managers shouldn't describe the structures as equivalent merely because both reference SOFR.
Fallback language changes the invoice
An all-in USD IBOR fallback combines adjusted SOFR with a spread adjustment, and the adjusted component can use daily or term structures, as specified in LSEG's USD IBOR cash fallbacks methodology. Compounded and simple calculations can also produce different outcomes.
A customer comparing headline spreads may miss those distinctions. The bank should provide a convention-level comparison before representing competing offers as economically interchangeable.
- Observation mechanics: Identify the reference period, lag, lookback, and any lockout.
- Calculation method: Specify simple interest, compounding, or the applicable term reference.
- Payment mechanics: Establish when the amount becomes known and when payment falls due.
- Contract protections: Reconcile floors, credit spreads, adjustment spreads, and fallback triggers.
Fixed-rate lending introduces a separate allocation of risk. When legacy asset coupons don't change but funding costs do, the bank absorbs the immediate mismatch. Variable-rate lending transfers more of the coupon adjustment to borrowers, who may then face liquidity or debt-service pressure.
That distinction belongs in repricing-risk analysis, not just in legal documentation. Treasury should model funding exposure, operations should validate billing, and relationship managers should explain payment variability before execution.
Don't promise equivalent economics until the payment schedules reconcile under the same rate path.
Require scenario invoices, not just term-sheet comparisons. That gives credit officers something concrete to use in covenant monitoring and gives borrowers a realistic basis for liquidity planning.
Peer Gaps the Policy Rate Does Not Show
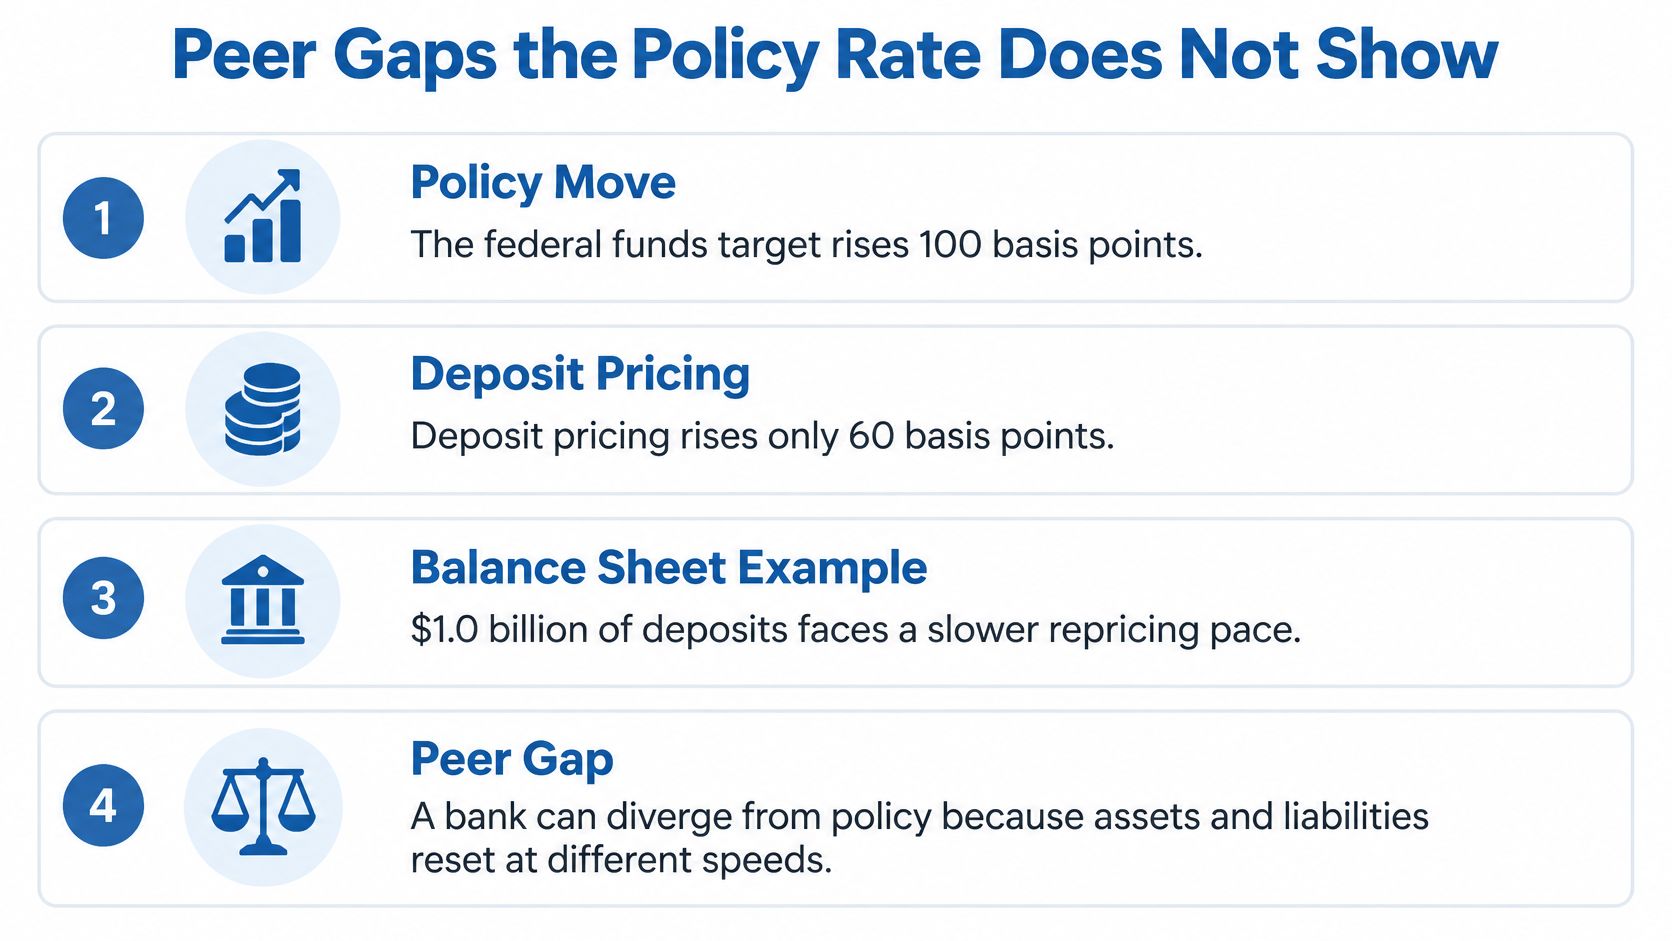
A 100-basis-point rise in the federal funds target does not automatically mean a bank's funding costs rise by the same amount. On $1.0 billion of interest-bearing deposits, full pass-through would add $10 million in annualized funding costs. If deposit pricing rises by 60 basis points, the added cost is $6 million, leaving about $4.0 million in annualized benefit compared with full pass-through. This is a hypothetical calculation, not an observed earnings result.
That benefit can fade. Customers may demand higher rates, move into more expensive products, or transfer balances elsewhere. Management should distinguish deliberate pricing discipline from a temporary repricing lag likely to reverse.
Compare the response, not the announcement
Peer analysis should show how institutions with comparable balance sheets responded to the same rate environment. A bank peer-group analysis can start with location and asset size, then account for differences in business model and funding structure. An industry average alone can hide which balance sheets absorb a basis-point shock and how pricing decisions affect cash flow.
Compare these measures across the cycle:
- Loan mix: Separate fixed-rate assets from floating-rate exposures and identify when each can reset.
- Funding mix: Distinguish operating deposits, rate-sensitive balances, time deposits, and wholesale borrowings.
- Asset yield against reference: Determine whether contractual pricing compensation improved or narrowed.
- Deposit beta: Measure how much of the policy movement reached deposit costs over a consistent period.
Deposit beta measures the change in deposit pricing relative to the change in the selected policy reference. It is useful only with a stated measurement window and a consistent definition of the deposit base. Product migration can shift the blended result even when individual offered rates barely change.
Read net interest margin alongside efficiency and asset quality. Higher interest earnings can temporarily offset rising operating costs or emerging borrower stress. An improved margin alone does not establish that the balance sheet is stronger.
The committee should ask: How much of the rate change reached loans, and how much reached deposits? Then quantify the expected reversal, the balances exposed, and the cost of retaining those balances. Before approving a deposit special or hedge, require management to explain the peer gap in terms of contractual timing, funding mix, and discretionary pricing. The decision is which balance sheet absorbs the basis-point shock, and how that changes cash flow.
Compare Your Bank Before You Reprice
Don't approve the next deposit offer or loan-spread change from a treasury screen alone. Put your bank's margin, deposit beta, loan yields, efficiency, and risk measures beside relevant peers before the pricing committee commits.
A market terminal can show the reference rate. It can't establish whether comparable institutions converted the same environment into better earnings without accepting greater liquidity or credit risk. That requires institution-level financial information and a consistent historical comparison.
Give the committee an actionable record
The decision packet should connect the proposed action to a measurable weakness or opportunity:
- Define the peer gap: Identify whether the issue is funding expense, asset pricing, operating efficiency, or risk.
- Reconcile the evidence: Separate filing-based performance measures from internal contract and customer information.
- Specify the action: Adjust the offer, change the hedge, or retain current pricing.
- Record the rationale: State the expected balance-sheet effect and the conditions that would prompt reconsideration.
Our Bank Performance app compares a bank's performance against 4,600+ institutions over the past decade, and customers can benchmark banks and credit unions side by side with a couple of clicks. We pull data directly from regulatory filings, including FDIC, NCUA, and FFIEC filings, and cross-check source data with multiple feeds.
Use that external evidence alongside your internal reset schedules and deposit records. Filing-based comparisons establish where the institution stands; contract-level analysis explains what management can change. Neither should substitute for the other.
Keep the final recommendation narrow enough to audit. Identify the portfolio or funding category involved, the reason for the proposed price, and the risk management accepts by acting or waiting. Record that judgment in the committee minutes.
The benchmark is an input. Your bank's relative performance and contractual exposure should determine the decision.
Visbanking offers regulatory-filing-based bank intelligence and side-by-side peer comparisons to help you evaluate margins, funding costs, loan yields, and risk. Visit Visbanking to compare your institution with relevant peers before your pricing committee locks the next deposit offer or lending spread.
Latest Articles
Brian's Banking Blog
Predictive Risk Analysis for Bank Decisions
Brian's Banking Blog
Data Pipelines with Apache Airflow for Banks
Brian's Banking Blog
Bank Shares Performance: Metrics That Drive Returns

Brian's Banking Blog
Help to Identify Bank Prospects and Risk Signals

Brian's Banking Blog
API Security Testing Tools: 10 Options for Banks in 2026
Brian's Banking Blog