
Predictive Risk Analysis for Bank Decisions
Brian's Banking Blog
An early-warning model at a large international bank in the Netherlands helped prevent 67.6% of cases that otherwise would have resulted in financial losses, according to the University of Twente study of that system. That number changes the board conversation. Predictive risk analysis isn't valuable because a model scores well in testing. It's valuable when a signal reaches an owner early enough to change outreach, pricing, limits, or origination.
What Predictive Risk Analysis Changes for Bank Decisions
Many credit committees still meet deterioration in last quarter's filing. The nonperforming loan ratio has risen, charge-offs are booked, and management explains a past the bank can no longer influence. That is reporting. It has a compliance purpose, and it does not create an intervention window.
Predictive risk analysis asks a different question: is a harmful transition likely inside a stated horizon, and which balance-sheet channel would carry it into earnings, capital, or funding? The horizon matters. A risk expected in two quarters demands a different action than one that might emerge over three years.
A decision needs a horizon and a channel
Say a $5 billion bank carries a heavy commercial real estate share of capital. Its filed nonperforming loan level is a fact from the last call report. The predictive question is whether weaker rents and higher funding costs will push charge-offs through the bank's concentration limit within the next two to four quarters, before the next capital plan is approved.
That framing forces specificity. Management must state the exposure, the time window, the loss channel, and the limit at risk. If rents soften, debt-service coverage falls. If refinancing rates stay high, maturing loans may not clear underwriting at current values. If both happen together, a performing loan can become a criticized asset well before it becomes a charge-off.
Board rule: A number without a horizon, a driver, and an owner is a report, not a risk decision.
Directors should test every forecast against that rule. Who owns the response if the signal strengthens? What action is authorized before the limit is breached? What evidence would cause the committee to reverse course? A committee that cannot answer those questions has purchased analytics rather than foresight.
Three domains that shouldn't blur together
Predictive work in a bank falls into three domains, and each needs its own drivers, limits, and owners.
- Credit risk: Will borrowers migrate toward delinquency, downgrade, or default, and will losses breach concentration, allowance, or capital limits?
- Liquidity risk: Will deposits reprice or leave faster than assets mature, forcing the bank into wholesale funding at a price its margin can't support?
- Operational risk: Are fraud losses, vendor failures, processing errors, or control breakdowns clustering in a pattern that points to a larger loss?
Those questions share a method but demand different responses. A credit signal may lead to tighter exceptions or borrower outreach. A liquidity signal belongs with treasury and may change funding mix. An operational signal may require a control fix, a vendor review, or a channel shutdown. A single blended score that hides the domain leaves the committee debating a color instead of authorizing an action.
The same discipline applies outside the loan book. Treasury and procurement teams that anticipate vendor risks in procurement face a familiar problem. A vendor's weakening finances or repeated service failures matter only if the bank identifies the exposure, the likely disruption window, and the person authorized to invoke an alternative provider.
Put the result before the method
The University of Twente study of the Netherlands bank's early-warning system is useful because it measured an operational outcome, not only model accuracy. The system combined internal banking records with external financial information, then compared logistic regression, decision trees, support-vector machines, random forests, gradient boosting, extreme gradient boosting, and neural networks. Explainability techniques identified which predictors drove the scores. Random forest produced the strongest reported performance among the tested models.
The takeaway for a board is procedural: model selection matters less than whether advance identification lets staff intervene before losses occur.
Early warning versus a backward-looking report
| Result | Reported figure | What leadership does |
|---|---|---|
| Negative client transitions anticipated before the move | A minority of cases | Prioritize outreach while the relationship can still be saved |
| Cases prevented among those that would have produced losses | 67.6% | Escalate, reprice, or cut exposure before the loss is booked |
| Dashboard of past weakness | Deterioration already on the books | Document history; the intervention window may already be closed |
Read the first two rows together. Catching a minority of transitions can still prevent a majority of loss cases if the bank acts on the right exposures. The committee question is which dollar exposures a model catches, how much lead time it gives, and whether staff have a playbook that converts that lead time into a changed outcome.
A dashboard shows that a customer or institution has already weakened. An early-warning model attempts to identify the transition while intervention remains possible. That distinction should drive investment. More charts will not improve a decision if the underlying information still arrives after the loss path is set.
The committee question
Before approving another model, dashboard, or data feed, name the committee decision each future signal must change. It might be a commercial real estate limit, a deposit pricing decision, a vendor renewal, or a relationship manager's outreach list. A signal that alters none of those decisions is background information.
That is the operating test. A predictive system earns its place when it identifies a transition, explains the channel, quantifies the exposure against a limit, and routes the case to a person who can act inside the forecast horizon. Anything less is a more elaborate way to describe the past.
Data and Models Behind a Usable Signal
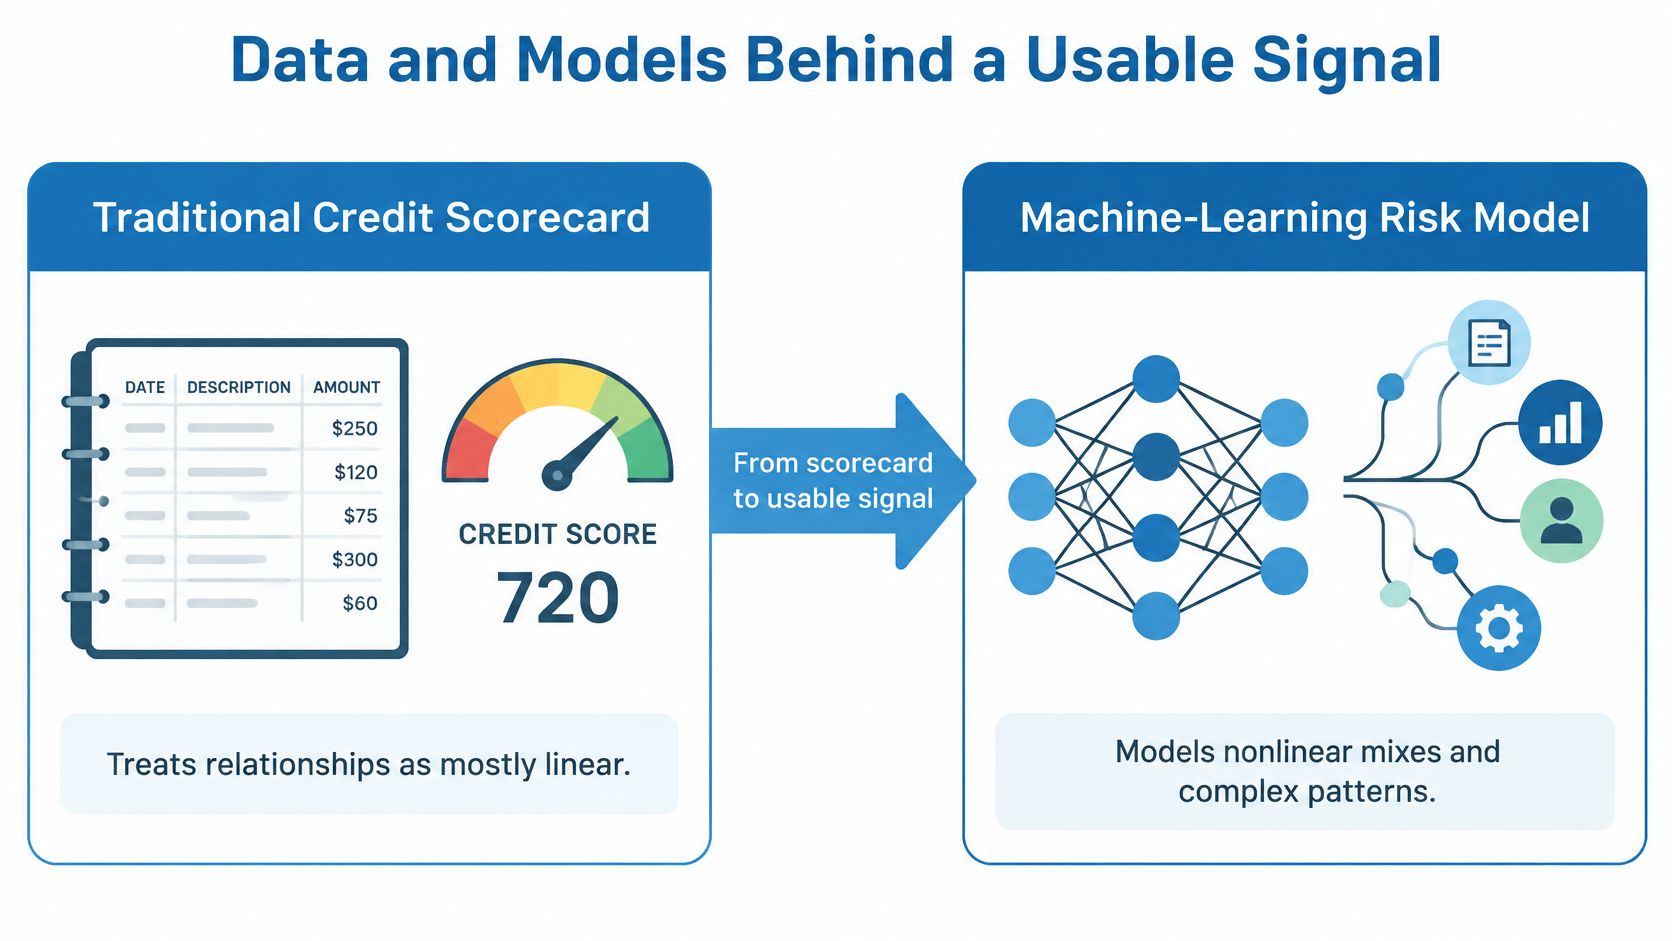
Executives already know the traditional scorecard. It assigns points to borrower characteristics and treats most relationships as linear. A little more debt adds a predictable amount of risk, and a little more income offsets it. That simplicity makes the score easy to explain, but bank risk rarely moves in straight lines.
Machine-learning systems can model nonlinear relationships among borrower, financial, behavioral, and macroeconomic variables. Debt may be manageable until rates rise, collateral values fall, and deposit costs increase at the same time. A usable model has to capture that interaction without becoming impossible for a director to challenge.
What the model comparison actually says
A 2022 systematic review in Neural Computing and Applications examined 76 research papers published over the preceding eight years, covering statistical, machine-learning, and deep-learning approaches to credit-risk estimation. Deep-learning models generally outperformed classic statistical and conventional machine-learning algorithms in the studies assessed. Ensemble methods, which combine multiple models rather than relying on one classifier, typically delivered higher accuracy than standalone methods.
Don't turn that finding into a purchasing rule. The same review identified three persistent production obstacles: imbalanced datasets, inconsistent data across studies and institutions, and limited model transparency. A model can win a research comparison and still fail in a bank if defaults are rare, definitions shift between systems, or nobody can explain why the score moved.
Model families a risk committee can compare
| Family | What it captures | Where it fails |
|---|---|---|
| Scorecards and logistic regression | Mostly linear effects that examiners and directors can challenge | Misses nonlinear mixes of borrower, behavior, and macro variables |
| Ensembles such as random forest and gradient boosting | Interactions across features; ensembles beat single classifiers in the 76-paper review | Unstable features can hide inside the blend |
| Deep learning | Generally outperformed classic statistical and conventional machine-learning methods in that review | Imbalance, inconsistent inputs, and weak transparency |
Standardize the inputs before debating algorithms
A U.S. bank can build a disciplined feature set from sources it already understands. FDIC call reports and UBPR peer ratios show institution-level trends. Loan-level performance reveals migration inside portfolios. Deposit and funding behavior shows repricing and runoff pressure. Macroeconomic series such as unemployment and interest rates connect bank outcomes to the environment borrowers face.
Each source needs a stable definition, a known reporting lag, and a history that survives system conversions. That's where sound credit risk modeling begins. If noncurrent loans, criticized assets, or deposit categories change meaning across periods, the model may learn an accounting break rather than a risk pattern.
Other financial sectors face the same tradeoff between automation and challenge. Tools built for risk assessment automation for DeFi investors show how automated scoring can process many signals quickly, but a regulated bank still needs standardized inputs and a person who can defend the output. Speed doesn't remove accountability.
A model enters production only if the feature set is standardized and a risk manager can say why the score moved.
Scorecards remain useful when transparency matters more than capturing complex interactions. Tree ensembles are stronger when risk emerges from combinations of variables. Deep learning may lift accuracy, but it's the hardest family to explain to a director, an examiner, or a borrower affected by a decision.
Choose the least complex model that captures the risk channel and passes validation. Accuracy matters. It doesn't settle whether the signal is usable.
Credit Liquidity and Operational Cases
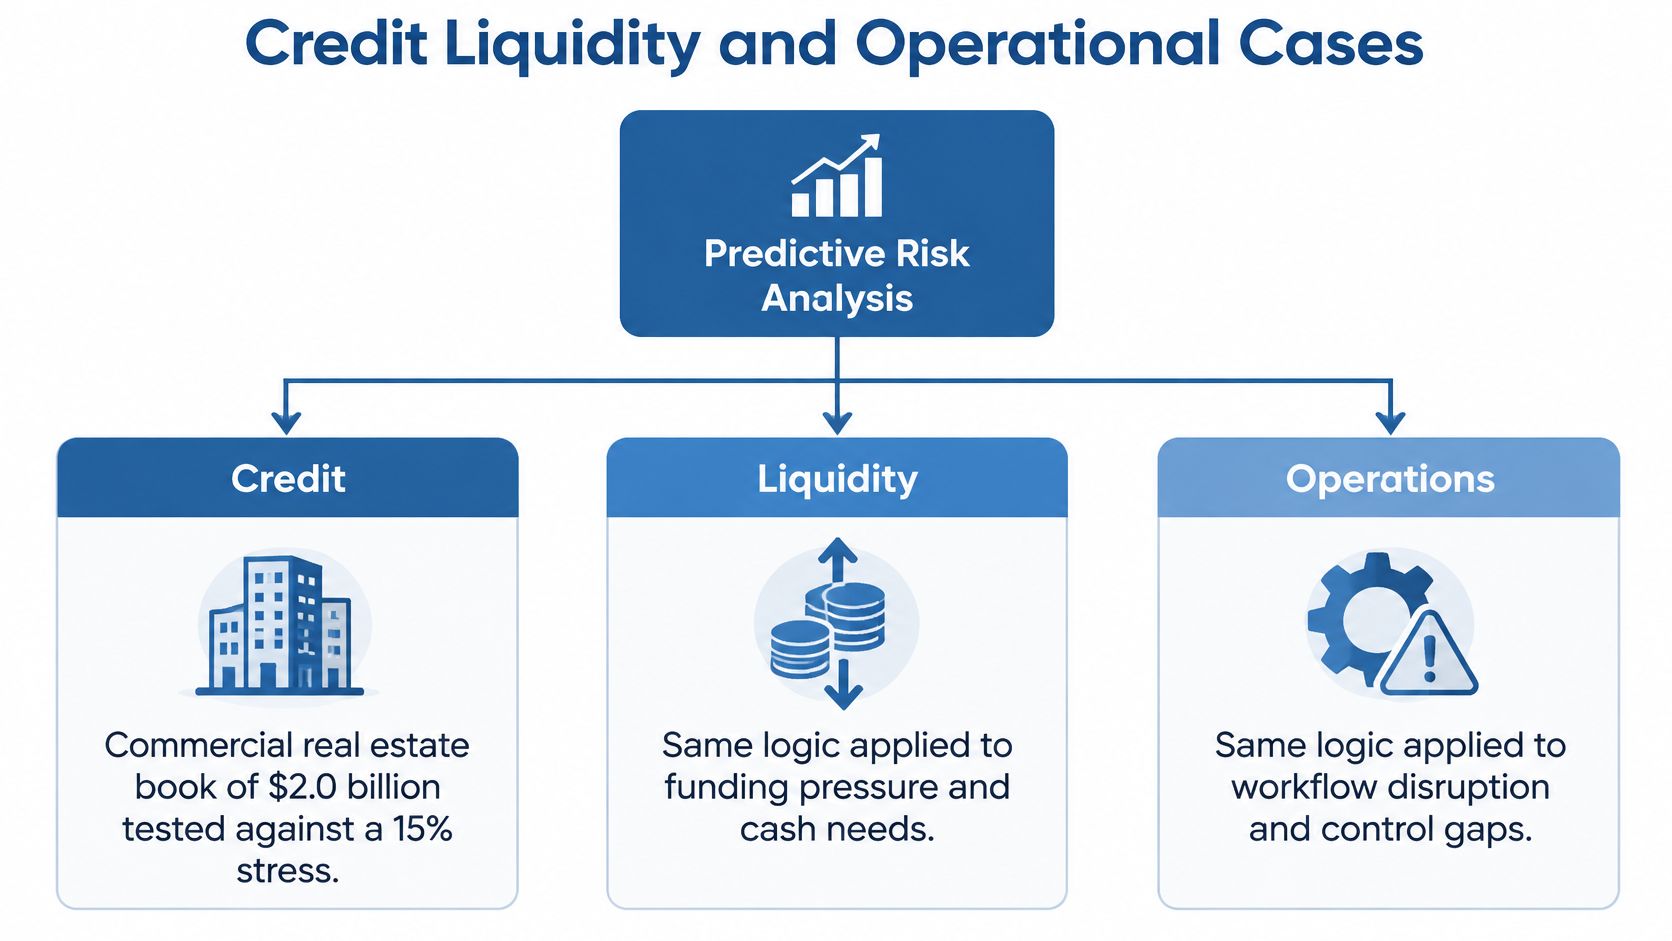
Start with credit, where the dollars are easiest to trace. Suppose a bank holds a $2.0 billion commercial real estate portfolio. Management tests that book against a 15% property-value decline, a 300-basis-point rate increase, and a 2.5-percentage-point rise in unemployment.
The output isn't a label that says the portfolio is risky. It's a loss estimate under a defined path. Management compares that estimate with concentration limits, capital buffers, liquidity capacity, and underwriting standards. If the severe case consumes too much capital, the committee can tighten exceptions, change pricing, slow origination in a vulnerable segment, or require more equity from borrowers.
Credit stress has to reach a limit
The FDIC stress testing guidance for banking organizations with more than $10 billion in consolidated assets requires scenarios that reflect serious macroeconomic and financial-system strain, while also requiring independent modeling to challenge assumptions and sensitivities. Earlier interagency guidance specifies that stress testing should cover material on- and off-balance-sheet exposures at relevant levels such as the business line, portfolio, and risk type, with results that are clear, actionable, documented, and used in decision-making.
Smaller banks shouldn't copy every large-bank procedure, but they should copy the logic. Run baseline, adverse, and severe paths. Identify which properties, sponsors, markets, and maturity cohorts drive the loss. Then state which limit the result is allowed to approach and which action follows if it does.
A portfolio average can conceal the problem. Office loans maturing within a year may behave very differently from amortizing industrial loans with strong sponsors. The predictive value comes from ranking the segments where cash flow, collateral, and refinancing risk deteriorate together.
Liquidity is behavior under pressure
A static loan-to-deposit ratio won't tell treasury what happens when rates move. The signal is deposit-beta behavior, runoff under the same rate shock, and whether wholesale funding can fill the gap at a price the margin can stand.
Say a hypothetical $5 billion bank holds $1.2 billion of uninsured deposits. A 200-basis-point rate shock lifts its deposit beta from 40% to 65%, and 10% of uninsured balances run off. The bank loses $120 million of funding that must be replaced in wholesale markets at a higher price. The margin test then asks a direct question. Does the spread survive after replacement funding, or does the bank need to slow asset growth, sell securities, or reprice deposits earlier?
Treasury takeaway: Forecast the customer's behavior, not only the balance on the reporting date.
Segment deposits by insurance status, customer type, rate sensitivity, and operational importance. A municipal account, a rate-seeking retail balance, and a business operating account won't respond to stress in the same way. The model should show which segments drive the outflow and how much time treasury has before funding costs reset.
Operational risk needs a dollar estimate
Operational signals often arrive as anecdotes. Fraud feels higher. A vendor seems less reliable. Processing errors appear more often. Predictive analysis turns that impression into a cluster test. Is frequency diverging from the bank's own history and from peer experience, and what's the expected loss if the pattern continues?
Say fraud losses rise from a three-year average of $1.2 million a year to $3.0 million, a 150% increase. That change should trip a cluster alert with a dollar estimate attached and route the case to the operational-risk owner before the pattern spreads to other channels. The response might be stronger authentication, lower transaction limits, vendor escalation, or a temporary control on a vulnerable product.
Keep the three cases separate. Credit asks which exposure will produce losses. Liquidity asks whether funding remains available at a workable price. Operations asks whether a control or process is failing. For each one, directors should demand the same three answers: which exposure, which scenario, and which limit the result is allowed to breach.
Tests That Separate Signal from Drift
Aggregate accuracy isn't validation. A model can perform well on average and still fail for the portfolio, customer segment, or economic path the bank now faces. Directors need tests that show whether the model understands a real risk channel and whether its recent predictions matched outcomes.
The Federal Reserve's SR 11-7 model risk guidance requires institutions to assess conceptual soundness, implementation integrity, data quality, model limitations, and performance against realized outcomes. That framework gives a risk committee a practical checklist. It also prevents a vendor demonstration or a strong back-test from substituting for governance.
Match the test to the forecast horizon
Use horizon-matched back-testing. Compare predicted defaults, losses, liquidity events, or other risk outcomes with actual results over a period excluded from model development and aligned to the forecast window. A model that predicts deterioration over four quarters shouldn't be judged only on next month's delinquencies.
Benchmark the model against an alternative internal or external model. A challenger can reveal whether apparent predictive power comes from unstable assumptions, data leakage, or a narrow sample. If a simple model performs just as well after leakage is removed, the complex model hasn't earned its opacity.
Ongoing monitoring matters because products, exposures, customers, data relevance, and market conditions change. The code can remain unchanged while the world underneath it moves. That's drift, and it can make a formerly sound score misleading.
Validation tests before a signal is used
| Control | Question it answers | Pull the signal when |
|---|---|---|
| Conceptual soundness | Does the theory match a real risk channel? | The score moves with a variable that has no credit, funding, or loss path |
| Horizon-matched back-test | Did predictions match a holdout window of the same length? | Predicted and realized outcomes diverge beyond the expected range |
| Challenger model | Is the lift real, or leakage and a narrow sample? | A simpler model matches it once leakage is removed |
| Ongoing monitoring | Have products, customers, or markets moved? | Performance slips after a product or macro change |
| Lineage on the alert | Which model version and data vintage produced this score? | Horizon, drivers, cutoff, or validation status are missing |
Scale controls to the bank and the model
Proportionality matters. A hypothetical $5 billion bank using a simple deposit-beta forecast may reasonably back-test quarterly and review results with management. A larger institution linking probability of default, loss given default, liquidity, and capital models needs formal independent validation, scenario analysis, and documented model inventory controls.
The objective doesn't change with size. Decision-makers need reliable evidence under changing conditions. What changes is the depth of review, the independence of the challenger, and the frequency of monitoring. Strong machine learning model validation makes those choices explicit rather than treating every model as either unregulated software or a capital model.
Monitor calibration and discrimination by institution, portfolio, and peer group. Calibration asks whether predicted event rates resemble realized rates. Discrimination asks whether the model ranks weaker exposures above stronger ones. A model can do one well and fail at the other, and each failure leads management toward a different mistake.
Refuse an alert without lineage
Every explainable alert should carry more than a score. It should show the forecast horizon, key drivers, training-period cutoff, data vintage, model version, validation status, and evidence of recent performance. Maintain feature-and-outcome lineage so an auditor can reconstruct why the alert appeared.
Trigger review when observed outcomes move materially outside expected ranges. Don't wait for a calendar date if the portfolio has changed. A director who can't see those fields can't distinguish genuine deterioration from model drift or a temporary data anomaly.
That's the standard. If the alert can't show its horizon, drivers, cutoff, and validation status, pull it from committee use until it can.
Turning an Alert into an Owner and a Step
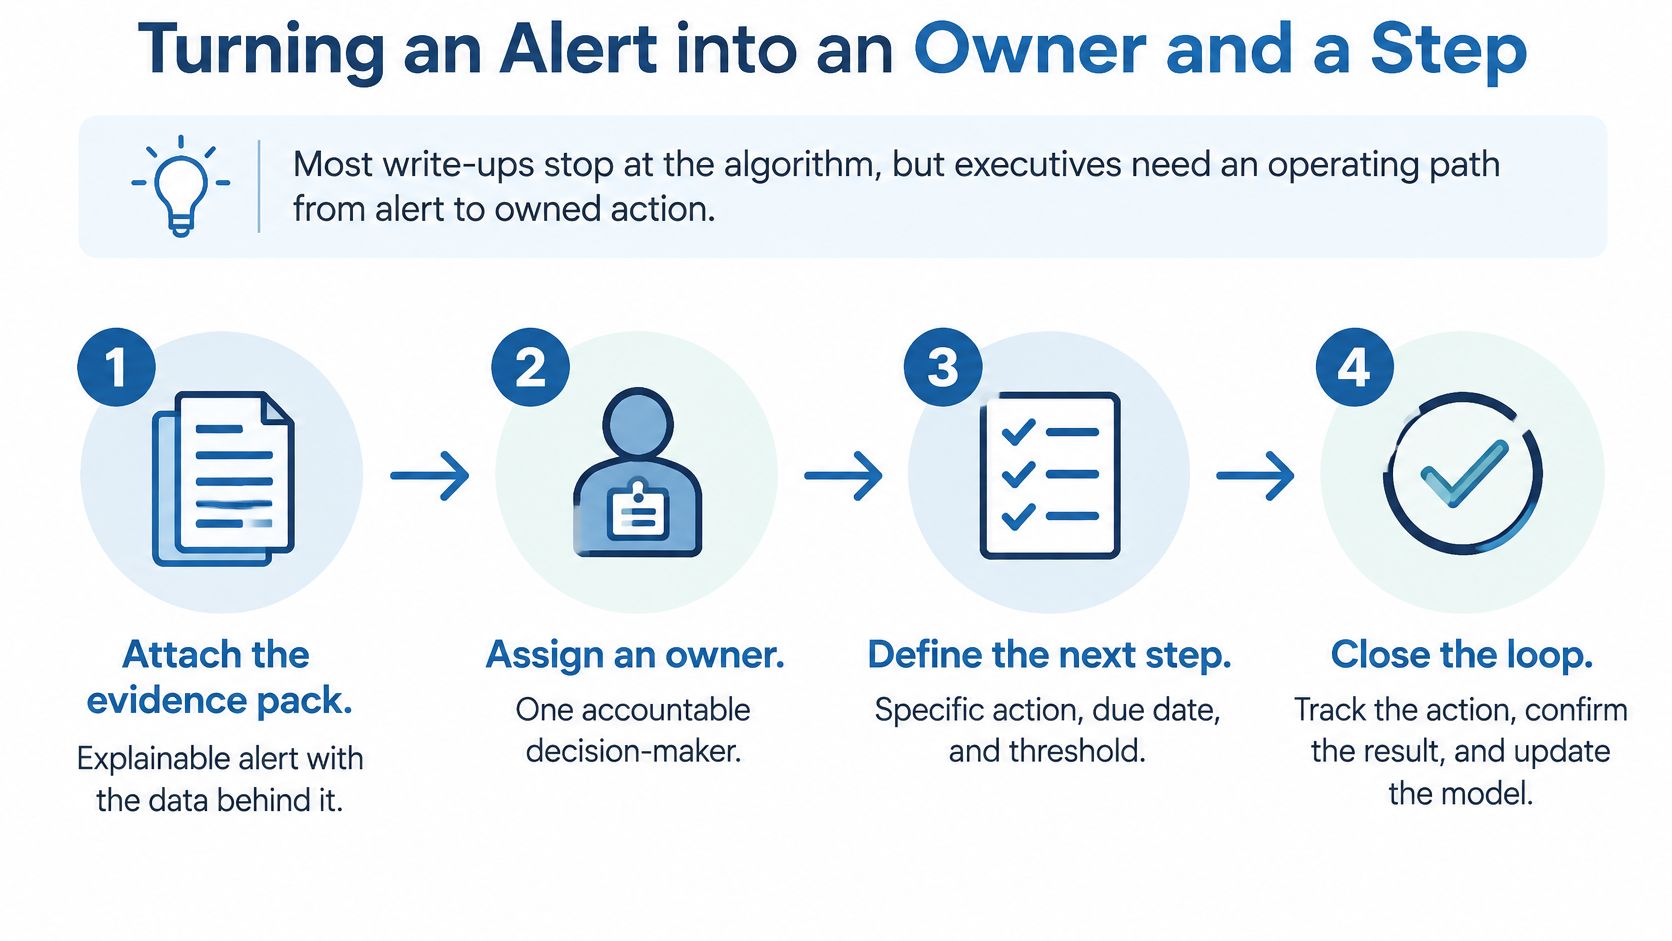
Most model discussions stop at the algorithm. Executives need an operating path that takes an alert to a named owner, a deadline, and a recorded action. Without that path, the bank creates a queue of warnings that everyone sees and nobody owns.
Model governance guidance expects banks to establish limits on model use, monitor performance, revise models over time, and supplement outputs with other analysis and information. The Federal Reserve's SR 11-7 attachment on model risk management makes that expectation explicit. A prediction is an input to judgment, not a substitute for it.
The minimum operating path
- Attach the evidence pack: Include the alert drivers, peer comparison, data freshness, confidence, recent performance, and one recommended next step.
- Label the output correctly: Call it an early warning, not a credit decision. A person still approves any limit change, price change, decline, or exit.
- Set investigation triggers: Define the observed changes that require review before the next scheduled validation.
- Name the owner and deadline: Assign credit, treasury, operations, or the relationship manager, and state when the committee expects an answer.
- Keep the audit trail: Record the model version, data vintage, who saw the alert, what analysis supplemented it, and what action followed.
That sequence protects both speed and accountability. The owner doesn't receive a bare score and improvise. The committee doesn't receive a technical appendix with no recommendation. Each alert arrives with enough evidence to challenge it and a step specific enough to complete.
Drift can hide behind a stable approval rate
Consider a small-business lending model whose approval rate remains stable at 70% while the applicant mix shifts toward newer firms, weaker cash flows, or industries affected by a regional slowdown. Subsequent 90-day delinquencies rise from 2.0% to 3.5%. The implementation hasn't changed, but the data has moved underneath it.
Management needs observable triggers rather than patience. Act on a 50-basis-point increase in delinquency, a 10% deterioration in a key feature's distribution, or a statistically significant gap between predicted and realized losses. Those thresholds should start an investigation, not automatically change underwriting. The owner first determines whether the shift reflects borrower deterioration, a product change, a data error, or model drift.
An early warning authorizes investigation. It doesn't authorize an automatic credit decision.
European banking supervision draws the same accountability line in practical terms. Decision-makers must understand output drivers, risk managers must be able to challenge them, auditors must review them independently, and executives remain accountable for the decision. A bank that can't assign those roles shouldn't scale the model.
Actions a committee can adopt this quarter
Keep the action menu short and concrete. For a weakening borrower segment, the owner can complete a peer review, escalate the portfolio, begin borrower outreach, reprice new originations, or stop exceptions until underwriting evidence improves. For a funding alert, treasury can test replacement sources and revise deposit pricing. For an operational cluster, the owner can tighten controls or suspend the affected workflow.
Close the loop at the next review. Record whether the exposure improved, deteriorated, or produced a loss, and feed that outcome back into monitoring. An alert system that never grades its own interventions will keep generating activity without proving value.
Benchmark the Bank Before the Next Review
Pick one portfolio before the next committee. It could be commercial real estate, core deposits, or a recurring loss-event class. Write down the horizon, the limit, and the owner before anyone presents a score.
Then benchmark the bank against a relevant peer set. Sound peer analysis prevents a common error. Say a community bank reports a hypothetical 0.4% annualized return on assets. Management should first test whether similar peers show the same compression before treating the result as a company-specific problem requiring company-specific surgery.
Our Bank Performance app compares a bank's performance against 4,600+ institutions over the past decade, which helps a community or regional bank see beyond its own data warehouse. Our Bank Intelligence app provides early warnings, including bankruptcy probability and stress markers. The Watch Panel shows active Watch signals across growth, allowance, nonperforming, and charge-off portfolios.
Use threshold flags on call-report ratios as a first screen, not a model substitute. Benchmark the institution, inspect the drivers, and assign the next step before the next risk review. Stop collecting ratios. Make the signal change a decision.
Benchmark your institution against peers, inspect early-warning drivers across credit, liquidity, and operational exposures, and turn the next risk signal into an owned action with Visbanking. Explore the data before your next committee review so directors can see the horizon, the limit at risk, and the person accountable for responding.
Latest Articles
Brian's Banking Blog
Data Pipelines with Apache Airflow for Banks
Brian's Banking Blog
Bank Shares Performance: Metrics That Drive Returns
Brian's Banking Blog
Help to Identify Bank Prospects and Risk Signals
Brian's Banking Blog
API Security Testing Tools: 10 Options for Banks in 2026
Brian's Banking Blog
HMDA Data Reporting: How to File Without Costly Errors
Brian's Banking Blog