
Understanding Statistical Significance in Banking
Brian's Banking Blog
The familiar advice to act when a result is statistically significant is incomplete. A bank can identify a statistically detectable difference and still make the wrong decision by overlooking its size, the quality of the comparison, or the cost of acting. Understanding statistical significance means knowing what the evidence permits you to conclude, and where executive judgment must take over.
Why Statistical Significance Is Not a Decision
A digital acquisition team reports that its new campaign produced a statistically significant improvement. The dashboard marks the result in green, and management is asked to approve a broader rollout. Before approving the expenditure, directors should ask what changed, how customers entered the comparison, and whether the improvement justifies implementation costs.
The statistical label answers a narrower question than the business proposal. It concerns how incompatible the observed data are with a specified statistical model. It doesn't establish that the campaign caused the improvement or that customers acquired through it will produce attractive relationships.
Separate the finding from the approval
A useful executive discussion distinguishes the analyst's finding from management's decision. The analyst should explain the comparison, uncertainty, and limitations. Management must assess whether the expected benefit warrants the expense, disruption, and risk.
The American Statistical Association's guidance on interpreting statistical evidence cautions against treating statistical significance as a substitute for scientific reasoning and context. In banking terms, a detectable movement in deposit growth or loan performance isn't automatically a strategic opportunity.
Executive standard: Approve an action because the evidence supports a worthwhile decision, not because a dashboard displays a significance label.
Require the proposal to address:
- Magnitude: Is the estimated change large enough to matter?
- Credibility: Does the comparison support the conclusion management wants to draw?
- Exposure: Which balances, customers, or operating processes would be affected?
- Reversibility: Can the bank validate the finding before making an expensive commitment?
A quarterly peer comparison deserves the same discipline. An unusual result might justify investigation without justifying a pricing change, portfolio reallocation, or revised growth target. The accountable decision is sometimes to act, sometimes to test, and sometimes to improve the information available.
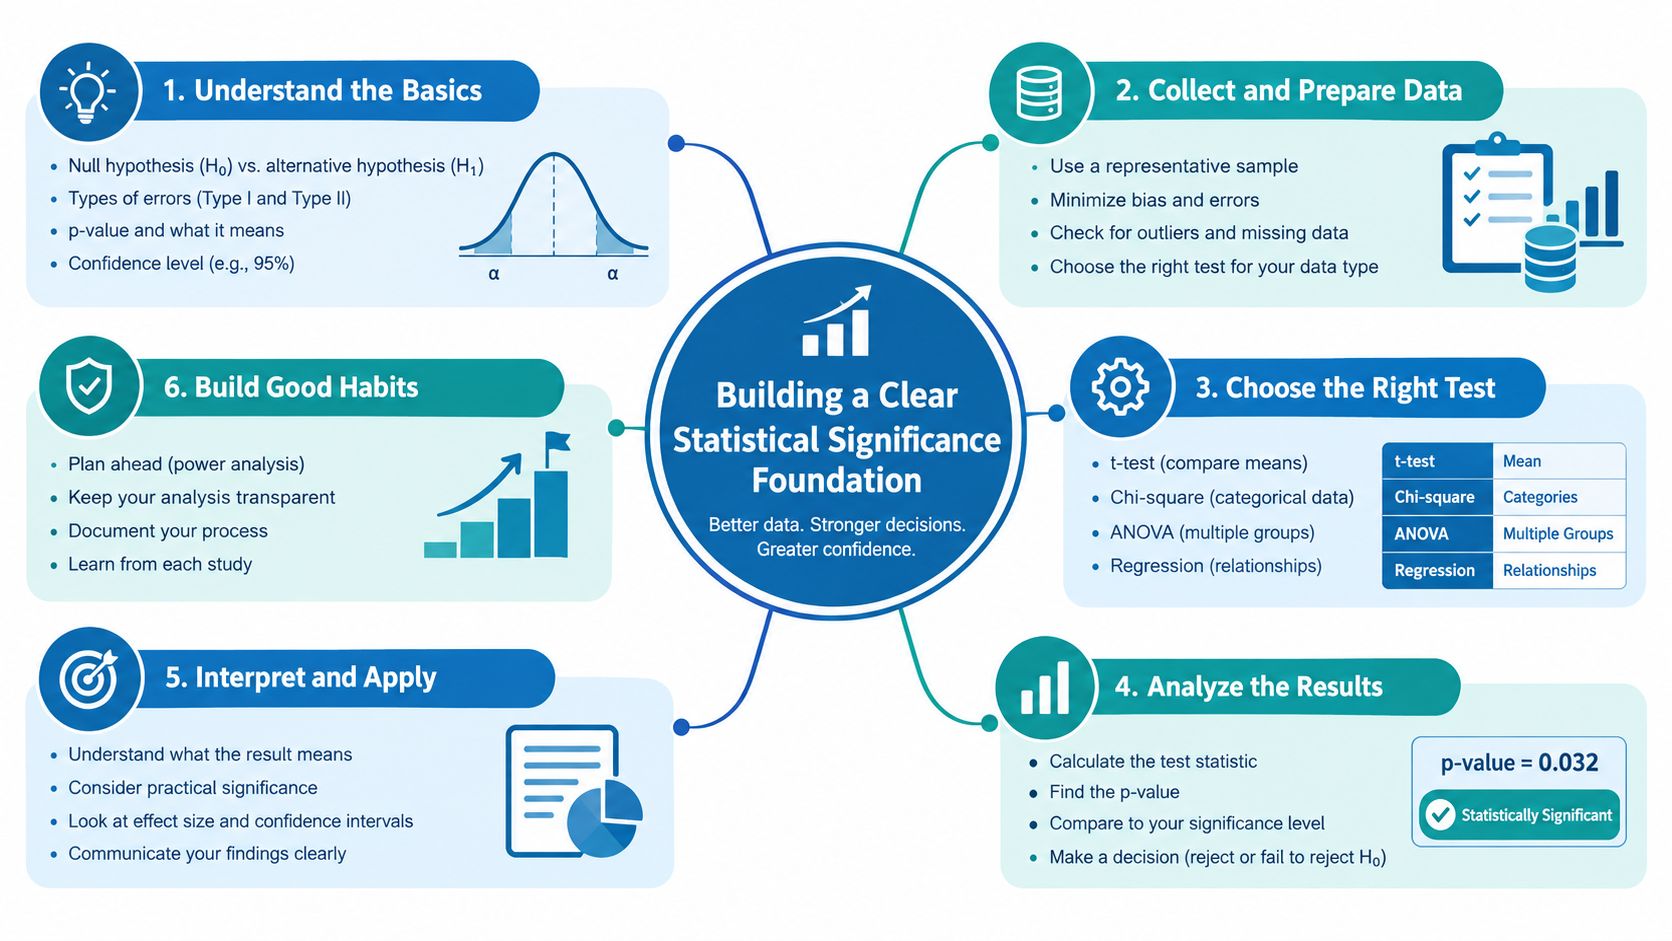
Building a Clear Statistical Significance Foundation
Think of a smoke detector. Its alarm prompts investigation, but it doesn't establish the location, severity, or cause of a fire. Statistical testing serves a similarly bounded purpose: it evaluates evidence against a starting model rather than delivering a complete explanation.
That starting point typically includes a null hypothesis, such as no difference in onboarding completion between the existing journey and a proposed alternative. Analysts ask how surprising the observed comparison would be if that model and its assumptions were correct.
Read the probability in the right direction
A p-value is the probability, assuming the specified model is correct, of obtaining a test statistic at least as extreme as the observed one. For a hypothetical result of p = 0.03, that means results this extreme would occur about 3% of the time under the model, not that the alternative hypothesis has a 97% probability of being true or that chance alone has a 3% probability of explaining the result, as the ASA statement on p-values explains.
The direction of that reasoning matters. Analysts assume a model and assess the data against it. They aren't calculating the probability that management's preferred explanation is correct.
Treat the threshold as a rule
The conventional 0.05 cutoff is a decision rule rather than a law of nature, as the ASA statement above emphasizes. Crossing it supports rejecting the null hypothesis under the chosen testing procedure. It doesn't prove a particular explanation.
- Below the chosen threshold: Assess the evidence against the specified null model, then examine competing explanations.
- Above the chosen threshold: Recognize that the analysis hasn't supplied sufficient evidence to reject that model.
- Under either outcome: Ask whether the assumptions and comparison fit the banking decision.
Before accepting the label, ask the analyst to describe the model in ordinary language. If the explanation requires treating dissimilar borrowers as comparable or ignoring changes in underwriting, the mathematical calculation may answer the wrong question accurately.
Connecting P-Values to Business Meaning
Suppose a bank evaluates a revised small-business lending process and observes lower delinquency among participating loans. The executive question isn't whether the difference is detectable. It's whether the process produced a worthwhile improvement that the bank can reproduce without unacceptable costs or unintended consequences.
Keep the measurements separate. Statistical significance concerns evidence against the specified model. Effect size describes the estimated difference in the lending outcome. A confidence interval describes uncertainty around that estimate under the analysis assumptions. Economic importance concerns what the difference would mean for the bank.
Translate the estimate into a decision
The effect size is the distance traveled; the confidence interval describes how precisely the analysis locates that distance. Neither tells management whether the destination is worth the cost.
For the lending example, a narrowly estimated improvement could still fall below the bank's action threshold after accounting for processing expense and portfolio exposure. A promising estimate with a wide interval could justify further validation rather than immediate rollout. If the interval spans both harmful and beneficial outcomes, management should acknowledge that unresolved uncertainty.
From Statistical Evidence to Executive Action
| Evidence Pattern | What It Supports | Recommended Response |
|---|---|---|
| Estimated benefit clears the business threshold, with limited uncertainty | A potentially worthwhile operational improvement | Validate implementation assumptions and consider a controlled rollout |
| Detectable difference remains below the action threshold | A measurable but commercially insufficient change | Avoid a costly response unless other benefits justify it |
| Interval includes both adverse and worthwhile outcomes | An inconclusive business case | Collect better evidence or extend controlled validation |
| Interval rules out the improvement needed to justify investment | A weak case for the proposed action | Reassess the proposal or redirect resources |
Specify value before seeing results
Define the minimum economically meaningful effect before reviewing the analysis. For lending, that requires considering affected balances, expected losses, operating costs, and the durability of the improvement. Don't substitute the number of accounts for the dollars at risk.
The same management discipline applies beyond credit. For teams connecting pipeline analytics with planning, Yalc's resource on how to measure and diagnose sales forecasting offers a related operational topic to examine. Keep the central question consistent: does the measurement help someone make a better decision?
The board should receive the estimated outcome and its business implications together, not a statistical appendix disconnected from the investment request.
Managing Sample Size and Statistical Power
A non-significant result can reflect limited information rather than an absent effect. Before dismissing a lending pilot or peer difference, executives need to know what the analysis was capable of detecting.
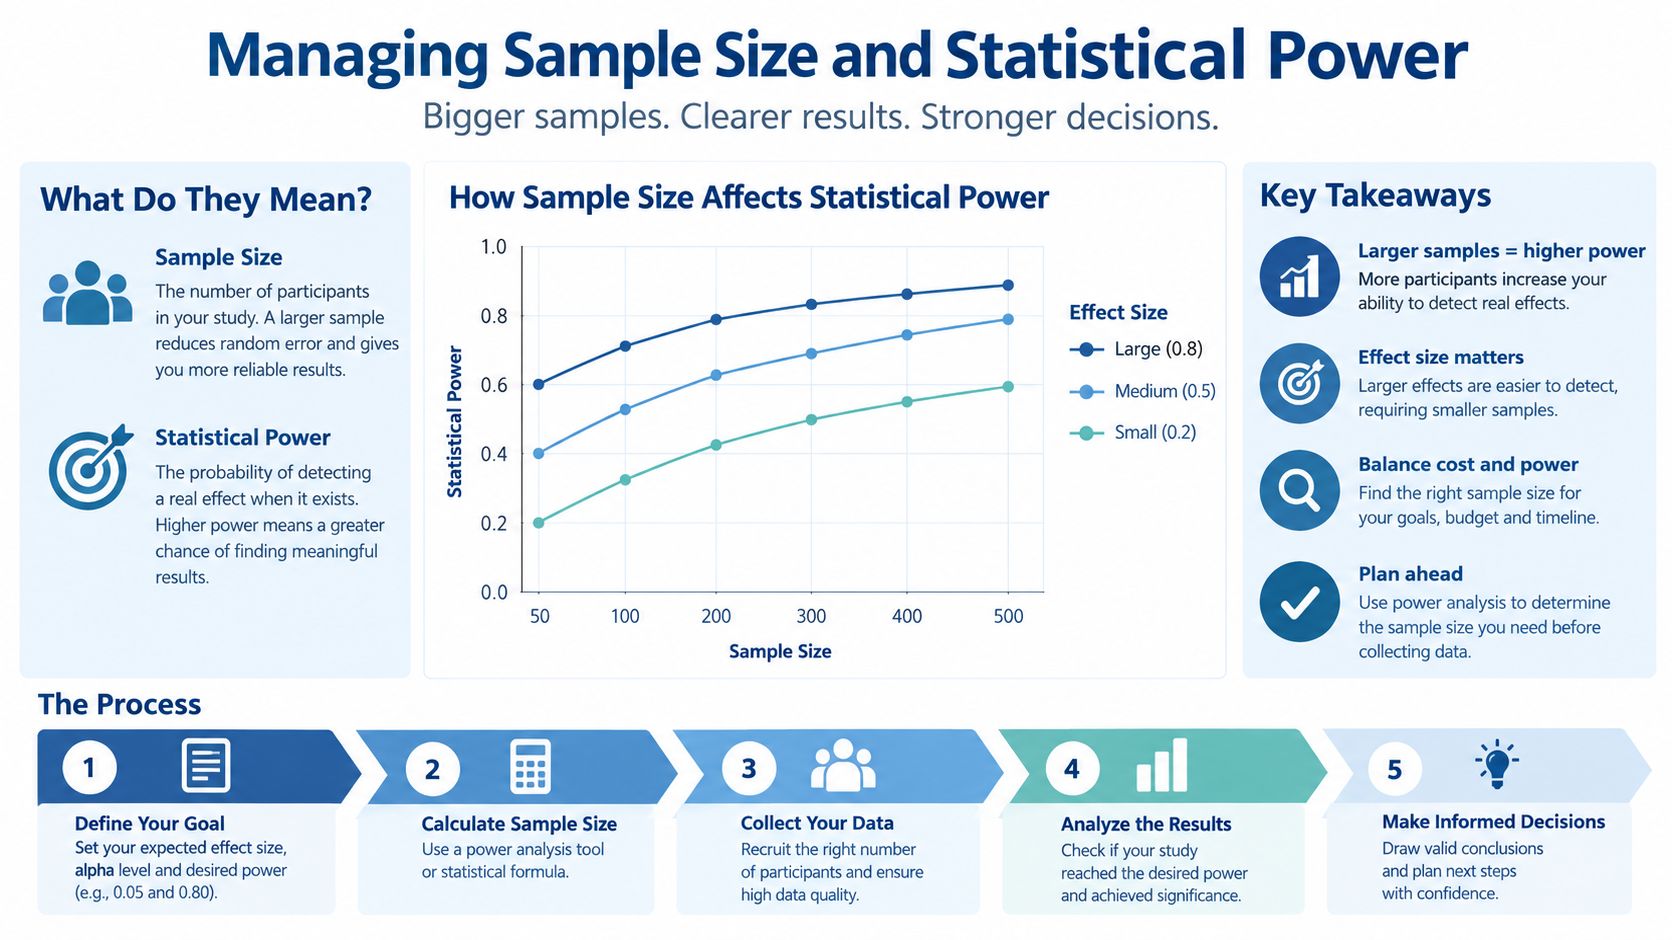
Statistical power is the probability of rejecting the null hypothesis when a specified true effect exists. It depends jointly on effect size, sample size, outcome variability, and the chosen significance level; a conventional planning benchmark of 80% power corresponds to a 20% Type II error probability for the targeted effect under the assumed design, as explained in Wharton's power and sample-size guidelines.
Hold the difference constant
Consider an explicitly hypothetical comparison: both analyses estimate a 1.5-percentage-point difference in small-business loan delinquency, but an analysis of 200 loans with substantial variation might yield p = 0.18, while an otherwise comparable analysis of 20,000 loans might yield p < 0.01; this illustration reflects the relationship between sample size and significance discussed in this methodological explanation of sample-size effects.
The larger analysis supplies stronger statistical evidence. It doesn't, by itself, settle whether the difference warrants changing underwriting, pricing, or portfolio limits. Those decisions still require the economic assessment described earlier.
Plan for a useful answer
Don't begin with the available dataset and assume it can resolve the question. Start with the improvement management would consider worth acting on, then ask an analyst to calculate the required sample size or minimum detectable effect.
- Specify the target effect: Connect the planned test to an economic threshold.
- Assess variability: Use assumptions that reflect the borrowers, institutions, or periods being compared.
- Document the design: State the significance level, planned power, and treatment of repeated comparisons.
- Check measurement quality: More records won't repair inconsistent delinquency definitions or missing outcomes.
For an additional planning resource, consult the LLMrefs sample size guide, while keeping the bank's own sampling structure and decision requirements explicit.
A large dataset isn't automatically an informative one. Require the analyst to distinguish the number of records from the amount of independent, relevant information those records provide.
Applying Statistical Evidence to Bank Intelligence
A bank's analytics committee may review a digital experiment, a performance benchmark, and a credit warning in the same meeting. Each requires a different interpretation because each supports a different kind of decision.
Digital onboarding and peer performance
In an A/B test of digital onboarding journeys, ask whether customers were assigned comparably and whether completion was defined consistently. Review the estimated improvement, uncertainty, sample adequacy, and results across relevant customer segments. If only a narrow segment appears to benefit, require validation rather than retroactively declaring that segment the intended target.
A credible onboarding winner must also survive operational review. Faster completion isn't sufficient if the revised journey creates downstream verification problems or attracts relationships the bank can't serve profitably. Keep those additional outcomes distinct from the primary test rather than searching among them for a favorable result.

A net interest margin comparison asks a different question. A gap against peers isn't an experiment, and the peer average isn't a counterfactual showing what the bank would have earned under another strategy.
Before recommending a response:
- Review the peer group: Compare institutions with relevant funding models, asset mixes, and market conditions.
- Align the measurements: Verify reporting periods, metric definitions, and denominators.
- Translate the exposure: Explain which balance-sheet positions contribute to the gap and what changing them would involve.
A disciplined business intelligence analytics approach should make those comparisons inspectable rather than hiding them behind a ranking.
Risk surveillance requires an escalation judgment
For a rising-delinquency signal, the immediate decision may be whether to investigate, not whether to change credit policy. An inconclusive statistical result shouldn't automatically close the alert when the available observations leave material deterioration plausible.
Ask the credit team to review borrower concentrations, reporting changes, and supporting portfolio information. Distinguish a preliminary warning from evidence sufficient for a restrictive action. The power considerations described earlier are especially relevant when adverse events are sparse or institution-level comparisons are limited.
Financial, regulatory, market, and people data should provide context for these judgments, with traceable definitions and sources. For a separate application of predictive scrutiny, Synopsix's resource on how to evaluate predictive models in talent decisions is a useful adjacent topic. Across workflows, predictive association and statistical detection must remain distinct from causal explanation.
Balancing Type I and Type II Errors
Every testing policy exposes the bank to different kinds of mistakes. Executives should name those mistakes before deciding how much evidence an action requires.
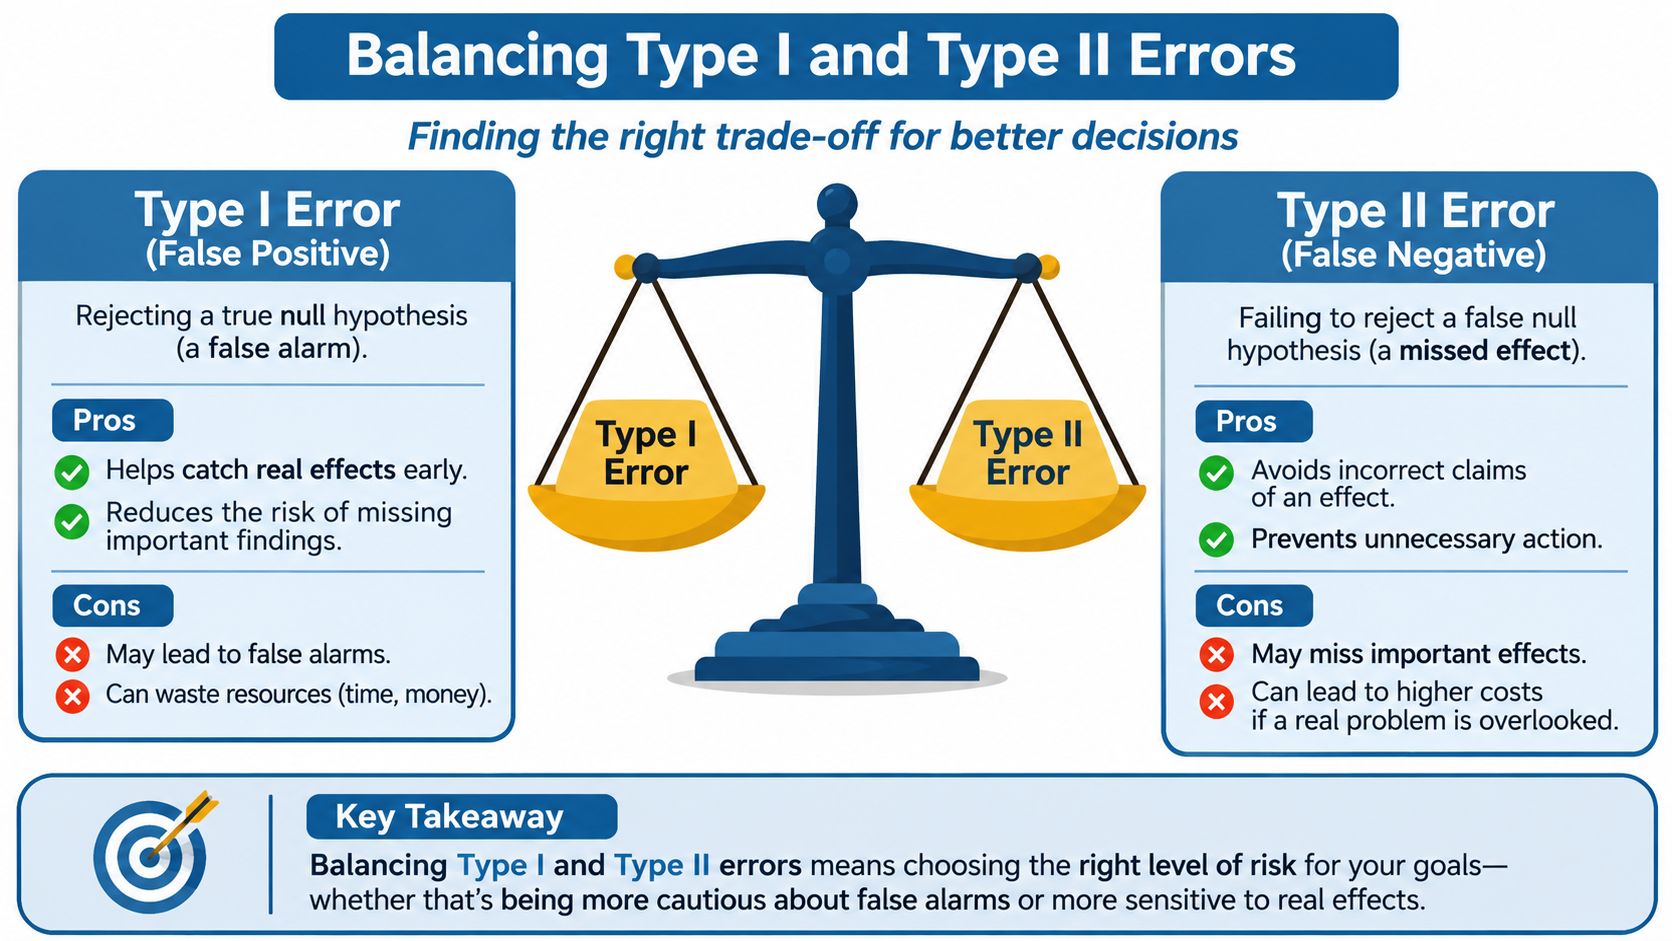
A Type I error occurs when an analyst rejects a true null hypothesis. In a delinquency-monitoring example, the bank might respond to an apparent deterioration that is noise. A Type II error occurs when the analyst fails to reject a false null hypothesis, potentially missing genuine deterioration.
Match the error balance to the action
A preventive fraud alert and a capital decision shouldn't necessarily require the same evidence. Management might tolerate more preliminary fraud alerts when investigation is relatively inexpensive and missed fraud is costly. A consequential capital action may require stronger corroboration because an unnecessary intervention could be difficult to reverse.
| Decision Context | False-Alarm Concern | Missed-Signal Concern |
|---|---|---|
| Preliminary fraud review | Investigation workload and customer friction | Failure to investigate harmful activity |
| Credit deterioration surveillance | Unnecessary escalation or restrictive treatment | Delayed recognition of emerging losses |
| Major balance-sheet action | Costly response to an unsupported finding | Failure to address a genuine vulnerability |
The practical distinction is between detecting a concern and authorizing a response. A bank can use an alert to initiate a low-cost review while reserving a higher evidentiary standard for a customer restriction, portfolio exit, or major expenditure.
The evidence needed to ask another question needn't be the evidence needed to commit capital.
Make the trade-off explicit
Before setting an alert threshold or significance level, ask the responsible executive to describe both error costs. Include operational capacity, customer consequences, delayed action, and reversibility.
Don't describe a conservative test as universally safer. Demanding stronger evidence against a false alarm can leave the bank exposed to missed problems. The appropriate balance depends on the decision, the available information, and what management can do after receiving the signal.
Applying a Rigorous Review Protocol
The strongest safeguard is a review process that analysts and executives follow before they know whether a result favors the proposed action. That process should produce a decision record, not merely a completed statistical test.
Establish the decision contract
Define what management is deciding, the minimum worthwhile effect, and the available responses. Specify whether the analysis can authorize implementation, support a limited pilot, or only trigger investigation.
Then verify the analytical foundation:
- Hypothesis and model: State the comparison and assumptions in language a business owner can challenge.
- Data provenance: Identify the reporting systems, transformations, exclusions, and unresolved quality issues.
- Sample composition: Review eligibility, selection, missing records, and whether observations are meaningfully independent.
- Measurement alignment: Confirm time windows, denominators, and segment definitions.
- Sensitivity: Determine whether reasonable alternative peer groups or control selections change the conclusion.
Require the effect estimate, confidence interval, exact p-value, and planned power or minimum detectable effect, where applicable. Explain any missing element rather than allowing the significance label to substitute for it.
Challenge the predictable failure modes
A short pitfall-and-response checklist makes the review repeatable.
| Pitfall | Required Response |
|---|---|
| Threshold worship | Explain the decision without relying on the significance label |
| Causal overreach | Identify the design features that support attribution and the alternatives that remain |
| Small-sample certainty | Assess which meaningful effects the analysis could detect |
| Post-hoc segmentation | Disclose exploratory searches and validate promising segments separately |
| Reporting only the p-value | Provide magnitude, uncertainty, and economic interpretation |
| Treating repeated observations as independent | Review correlations across borrowers, institutions, and reporting periods |
Repeated quarterly observations, selection bias, and multiple testing deserve explicit analyst review. Don't assume that a longer spreadsheet supplies proportionally stronger evidence.
For predictive applications, connect this review to the bank's machine learning model validation process. Ask whether performance holds in the population and conditions where management intends to use the model.
Approval discipline: Record what would change the decision, who will monitor it, and when the finding must be reconsidered.
Conclude with a named owner and a documented disposition: approve, validate, monitor, or reject. Include the reason, unresolved limitations, and conditions for escalation. That gives directors a defensible explanation for both action and restraint.
Making Better Decisions With Bank Intelligence
Understanding statistical significance is a management capability, not just an analytical skill. Executives don't need to reproduce every calculation, but they do need to distinguish an informative result from an unsupported recommendation.
The decision rule is straightforward: assess the statistical evidence alongside magnitude, uncertainty, data quality, economic thresholds, and the consequences of being wrong. None of those elements should disappear as a finding moves from an analyst's notebook to a board presentation.
Require intelligence that can be inspected
Decision-ready reporting should let leaders trace a comparison back to its institutions, periods, definitions, and source records. It should also distinguish observed performance from modeled predictions and preliminary warnings from validated findings.
- For benchmarking: Retain the rationale for selecting peers and explain material differences.
- For performance analysis: Connect estimated changes to the balances and processes management can influence.
- For predictive surveillance: Preserve the evidence behind an alert and document the response it warrants.
Embed those expectations in the bank's strategic decision-making process. The objective isn't universal certainty. It's a consistent standard for deciding when the evidence supports commitment, when a controlled test is preferable, and when monitoring is the responsible choice.
A useful next step is to select an upcoming peer review or investment proposal and apply that standard before approval. Ask whether the executive team can inspect the evidence, explain the uncertainty, and defend the proposed action without leaning on a statistical label.
Visbanking's Bank Intelligence and Action System brings financial, regulatory, market, and people data together to support peer benchmarking, performance analysis, and explainable risk signals. Visit Visbanking to benchmark your institution or explore data that can help your team turn statistical findings into decisions it can inspect, explain, and act on.
Latest Articles
Brian's Banking Blog
Option Adjusted Spread: A Banker's Practical Framework

Brian's Banking Blog
How to Improve Margins: A Bank Leader's Playbook

Brian's Banking Blog
Automated Alerts and Notifications for Banks
Brian's Banking Blog
Customer Feedback Loop for Banks: A Practical Playbook

Brian's Banking Blog
Commercial Lending Trends: What Bank Executives Must Know

Brian's Banking Blog