
Option Adjusted Spread: A Banker's Practical Framework
Brian's Banking Blog
A treasurer presents two securities to ALCO. Their coupons and stated maturities appear similar, but one has a callable feature and the other carries prepayment risk. The yield spreads look close enough to support either purchase. Yet that comparison leaves out a key question: how much of each security's spread compensates the bank for credit and liquidity risk, and how much reflects cash flows that can change when rates move?

That's the kind of decision an ALCO discussion should frame before a security reaches the agenda. Option-adjusted spread (OAS) gives the committee a way to compare securities after accounting for modeled embedded-option effects, rather than relying on an unadjusted yield spread.
OAS is a bond valuation measure expressed in basis points. It's the parallel shift applied to a government spot-yield curve that makes the present value of a security's modeled cash flows equal its market price, separating compensation for credit and liquidity from the value of any embedded option, as defined in ICE's bond-index methodology. In practical terms, 100 basis points equals 1 percentage point, so an OAS of 150 basis points means a modeled spread of 1.50 percentage points over the relevant government curve after option effects are accounted for.
For executives, the useful point is not that OAS produces a perfect answer. It doesn't. It creates a more relevant starting point for portfolio and pricing decisions when contractual options can alter cash flows. Used consistently, it becomes a daily operating signal: a way to ask whether a security's modeled compensation still justifies its risks and how that compensation compares with peers and market conditions.
How Embedded Options Break Conventional Yield Spreads
A conventional yield spread compares a security's yield with a benchmark yield. That comparison assumes the security's cash flows are sufficiently stable to interpret the difference meaningfully. Embedded options break that assumption: the issuer or borrower can change when, and sometimes how much, the investor receives.
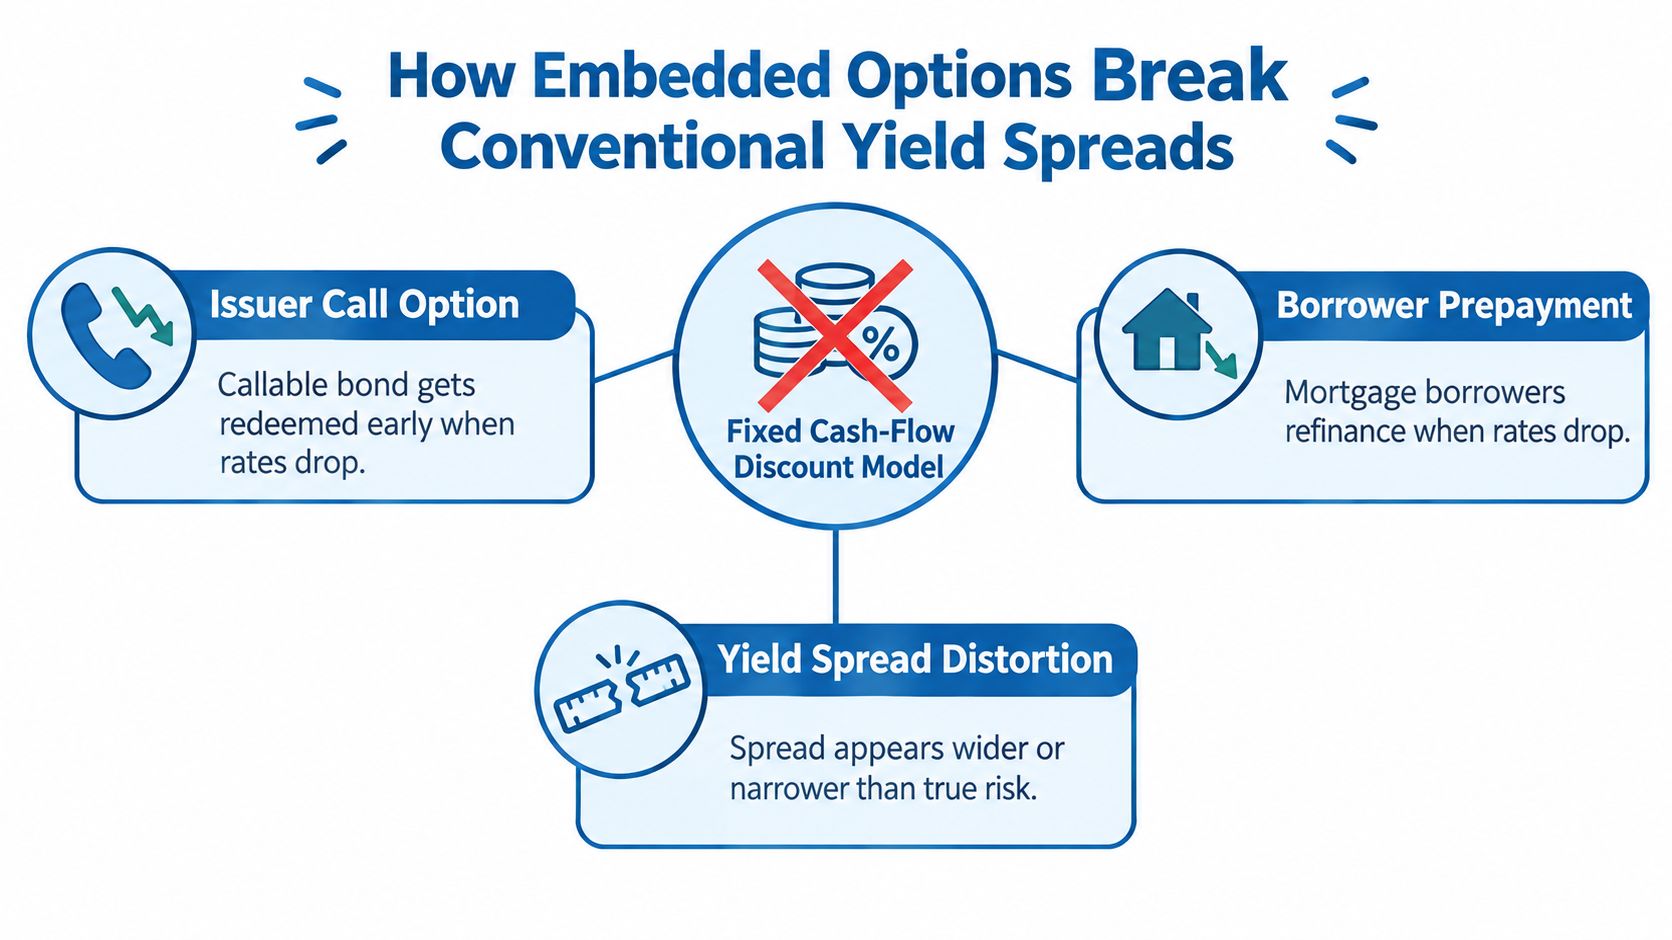
Consider a callable corporate bond. If rates fall, the issuer may refinance and redeem the bond early. The investor can lose the higher-coupon payments they expected to receive over the remaining term, then face the challenge of reinvesting the proceeds at lower rates. A yield spread calculated from a fixed schedule won't fully reflect that possibility.
Mortgage-backed securities introduce a related problem. When rates fall, borrowers may refinance and prepay their mortgages faster. The investor receives principal sooner than expected, changing the security's cash-flow timing and reducing the period over which the original coupon is earned. Conversely, rate changes can affect prepayments and extend the expected life of the investment. The bank isn't holding a fixed calendar of payments; it's holding cash flows shaped by borrower decisions and interest-rate paths.
OAS addresses that uncertainty by fitting a constant spread to modeled, option-adjusted cash flows. The calculation uses an interest-rate tree or Monte Carlo framework, rather than a static discount applied to a fixed payment schedule, as described in this California State Treasurer's discussion of OAS.
Think of a conventional spread as measuring a bond against a fixed map. OAS redraws the route for the different rate paths that could trigger a call, put, or prepayment, then solves for the spread that makes the modeled value match the market price.
That distinction matters in committee. OAS isn't another name for yield, and it doesn't eliminate the need to scrutinize credit or liquidity. It's a model-fitted spread over cash flows that may change, with results shaped by assumptions about rates, volatility, and exercise behavior.
OAS Against Nominal Spread, Z-Spread, and Yield to Worst
The right spread measure depends on the security's cash-flow uncertainty. No single number answers every portfolio question, and treating these measures as interchangeable can make an executive report look precise while obscuring the actual risk.
| Measure | What it tells the committee | Where it fits |
|---|---|---|
| Nominal spread | The difference between a security's yield and a benchmark yield, without adjusting for embedded options. | A quick screen, but an incomplete comparison for callable bonds and MBS. |
| Z-spread | The constant spread added to each point on a spot curve to match the price of modeled fixed cash flows. | Useful for option-free bonds, where the cash-flow schedule is known. |
| Yield to worst | A yield calculation based on the least favorable contractual redemption outcome for the investor. | A useful contractual scenario for callable bonds, but not a probabilistic model of rate paths. |
| OAS | The spread that matches price after the model accounts for option-sensitive cash flows. | A more decision-relevant comparison when embedded options materially affect cash flows. |
Z-spread is a sound tool when the cash flows are fixed. It becomes less informative when the issuer can call the bond or mortgage borrowers can prepay, because the fixed-cash-flow assumption no longer represents the instrument's behavior. OAS explicitly incorporates those option effects, but its output is model-dependent.
Yield to worst helps answer a different question: what yield results under the least favorable contractual redemption outcome? It doesn't replace OAS, because it doesn't model the range of possible interest-rate paths and the resulting timing of cash flows. A committee can use it as a contractual downside check alongside an OAS view.
Use the measure that matches the decision. For a plain fixed-rate security, nominal and Z-spread measures may be sufficient. For an option-bearing security, put OAS in the primary comparison, then show the other measures as context rather than as competing answers.
Worked Examples for a Callable Bond and an MBS Pair
A worked calculation is useful only if the committee can see what's observed, what's assumed, and what the model is solving for. The following examples show how to read the output, not how to treat a modeled spread as a guaranteed return.
Callable corporate bond. Assume a callable corporate bond has a market price of $98.50 per $100 of par and a 5.00% coupon. The rate model generates possible future paths, and the call rule determines whether the issuer redeems the bond on each path. The model then solves for the constant spread that makes the average discounted value of those cash flows match the observed price.
If the resulting OAS is 150 basis points, the model says the bond's price is consistent with that spread after accounting for the call option under the selected assumptions. The number isn't a promise that the bank will earn that spread. It's a model output tied to the benchmark curve, volatility, and call behavior used.
A volatility shock can change the result. If the same bond's modeled OAS moves to 175 basis points after a revised volatility assumption, the committee should ask whether the change reflects a genuine shift in required compensation, changed option value, or both. The OAS alone can't separate those explanations without the model inputs and price context.
Mortgage-backed security pair. Compare two MBS passthroughs with identical 5.00% coupons. After prepayment modeling, one has an OAS of 125 basis points, and the other has 95 basis points. Their nominal yield spreads may look similar, but the modeled option-adjusted compensation differs by 30 basis points. This example of matched-coupon securities and their different OAS values is also described in the Federal Reserve Bank of San Francisco's OAS material.
The higher OAS may look more attractive, but the committee shouldn't buy on that number alone. It should verify whether the securities' credit, liquidity, structure, and prepayment assumptions are comparable. A spread gap is a reason to investigate the trade, not proof that the higher-spread security is mispriced.
Committee test: Ask what changed in the price, benchmark curve, volatility, and cash-flow assumptions before treating an OAS move as a change in expected compensation.
Inputs, Models, and the Mechanics of an OAS Calculation
An OAS figure is only as useful as the model that produced it. Four inputs deserve a clear place in the bank's documentation: interest-rate model, volatility assumption, cash-flow decision rules, and benchmark curve. Each can influence the result, so a report that shows the spread but hides these choices gives the committee an incomplete view.
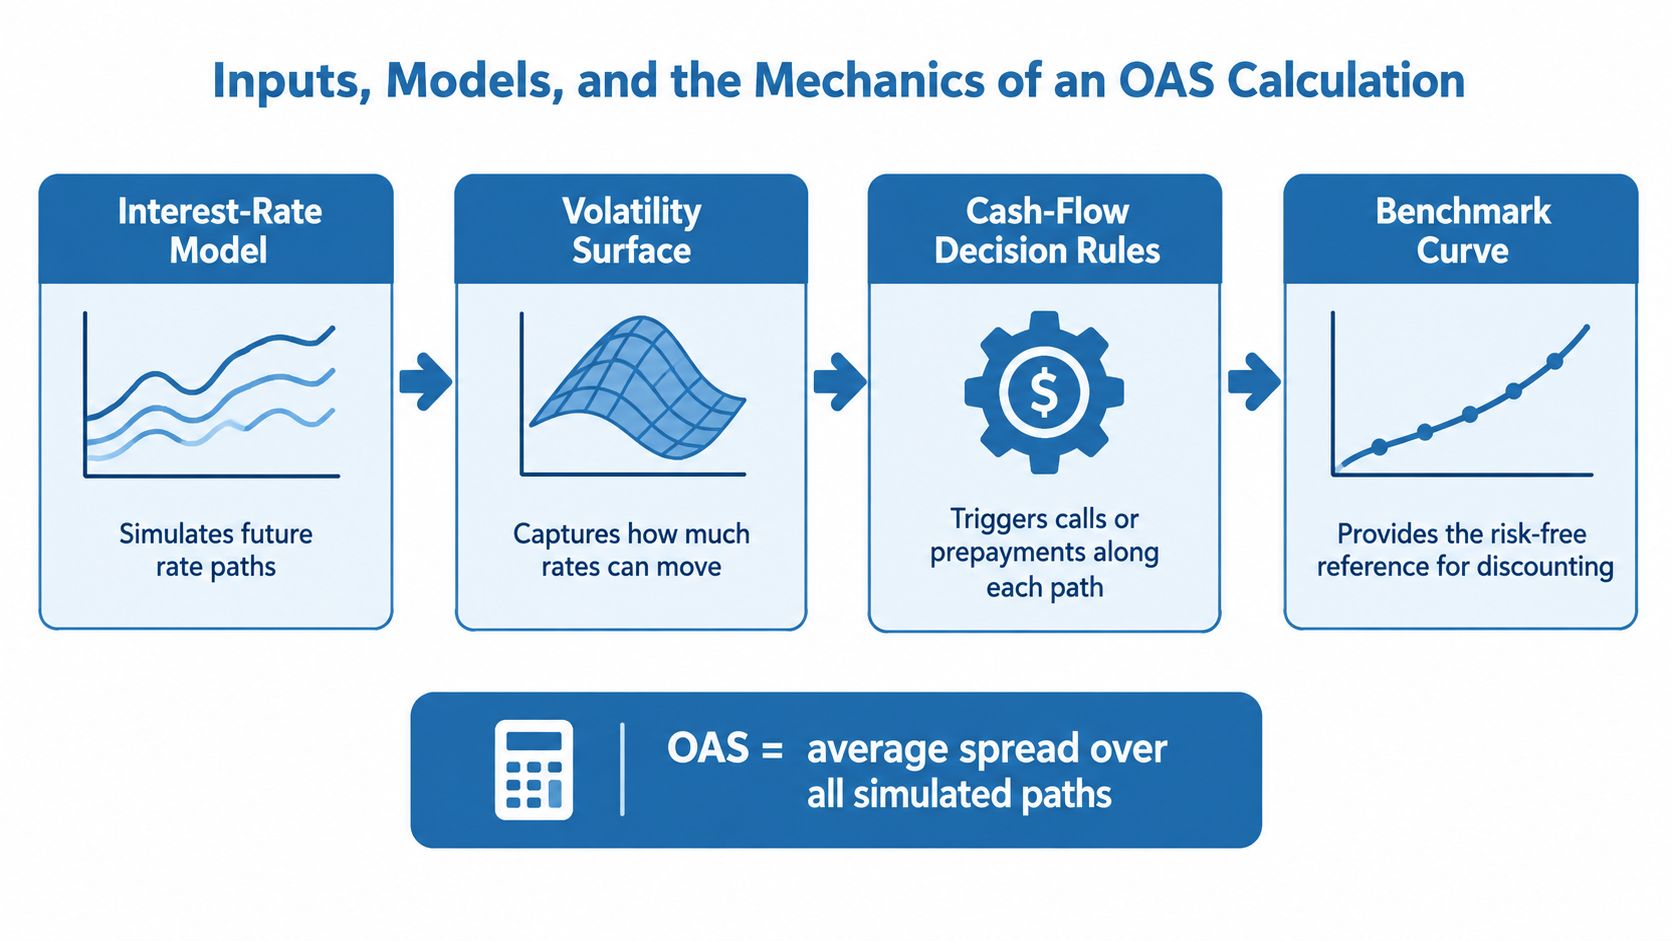
The interest-rate model generates future paths. The volatility assumption influences the range of those paths. Decision rules apply the contract to each path, such as calling a bond or modeling mortgage prepayments. The benchmark curve supplies the reference rates used for discounting. Change an input and the resulting OAS may change, even if the security and its market price do not.
How the Monte Carlo loop solves for OAS
Monte Carlo simulation makes the calculation intuitive. The model generates multiple interest-rate paths, applies the contractual call or prepayment behavior on each one, and calculates the present value of the resulting cash flows using a trial spread. It then averages those present values and adjusts the spread until the average matches the market price. The converged spread is the OAS, as outlined in this Monte Carlo OAS calculation reference.
For example, a model could price a callable bond at $98.50 per $100 of par, test a 140-basis-point spread, and produce a simulated value of $99.10. Because that value is above the market price, the model increases the trial spread and repeats the calculation until the simulated value converges on $98.50. The spread at convergence is the OAS.
These figures illustrate the mechanics, not a universal model setting. Banks should document their own path-generation method, volatility assumptions, exercise rules, benchmark curve, and validation controls. A higher assumed interest-rate volatility generally increases the value of a callable issuer's option. That can change the bond's option-adjusted value and the spread required to reconcile the model with the market price.
Audit requirement: Preserve the assumptions alongside the output. Without them, a reviewer can't tell whether a spread change reflects market repricing or a change in model setup.
How to Act on OAS Signals Across the Bank
OAS earns a place in executive reporting when a movement prompts a decision. The bank should connect the signal to its securities book, purchase pipeline, risk limits, and market monitoring rather than treating the spread as a stand-alone market statistic.
Reassess the callable book when peer-relative spreads tighten. A tightening OAS generally indicates improved market pricing or risk sentiment. If the bank's callable holdings look rich relative to comparable securities, review whether the expected compensation still supports the position. A peer-relative move of more than 15 basis points can serve as an internal review trigger, but it should be a policy threshold chosen and tested by the bank, not mistaken for a universal market rule.
Review agency MBS convexity exposure when spreads compress under volatile rates. A tighter OAS may coincide with a less attractive entry point, while borrower prepayments can change the timing and duration of cash flows. The practical response is to examine the portfolio's exposure and hedge design under the bank's rate scenarios, not to hedge mechanically on the basis of one spread print.
Make corporate bidding conditional on relative value. Compare a prospective purchase's OAS with the bank's chosen historical range and peer set. A security outside that range deserves an explanation before the bank raises a bid or adds exposure.
Treat broad spread widening as an early warning, not a diagnosis. Widening OAS generally indicates that investors require more compensation. Compare the bank's instrument-level readings with broad market measures to determine whether repricing appears concentrated or more widespread.
Put option-adjusted reporting into investment policy. Require OAS for option-bearing securities alongside the model assumptions and relevant conventional spread measures. That makes committee review more consistent and helps the bank trace why a position appears attractive.
Market context matters because an aggregate index isn't a simple average of issuer spreads. The ICE BofA US Corporate Index OAS, distributed through FRED's corporate spread series, is capitalization-weighted by bonds' current amounts outstanding, so larger issues have greater influence on its aggregate reading. Executives can use peer comparisons and trend analytics to interpret the bank's own signal within that broader market context. For a wider look at portfolio exposure and operating choices, banks can also review their interest-rate risk management approach.
Limitations and Failure Modes Every ALM Report Should Flag
OAS is not a clean, model-free measure of credit risk. It attempts to separate compensation for credit, liquidity, and other non-government risks from embedded-option value, but the result depends on how the model represents rates and cash flows. Executives should treat a single OAS print as a question to investigate, not a complete explanation of value.
Four reasons the number can mislead
Model dependence. Different interest-rate models or exercise assumptions can produce different spreads for the same security. If two portfolios use different methods, a direct comparison may not be meaningful until the assumptions are reconciled.
Volatility changes. A shift in implied volatility can alter modeled option value and OAS even when the issuer's credit position hasn't changed. Separate changes in model inputs from changes in the bank's assessment of credit or liquidity.
Benchmark drift. A historical comparison can become misleading if the reference curve or construction method changes. Keep benchmark choices consistent, or explain the break in comparability.
Liquidity effects. A dislocated corporate bond or an unusual benchmark security can complicate interpretation. OAS doesn't make liquidity differences disappear; it still depends on the price and benchmark used.
The Federal Reserve Bank of San Francisco describes OAS as relying on risk-neutral interest-rate evolution and notes that the calculation excludes some non-interest-rate risks. That's a reminder not to treat the number as a complete measure of every risk the bank bears.
A defensible ALM report shows the spread, the assumptions, and the relevant comparison. If the model changes, the report should make that visible.
The bank's model-risk management framework should govern how teams validate, document, and challenge OAS outputs. Without an audit trail, the committee may mistake a change in assumptions for a change in market risk, or compare securities whose reported spreads were built on different foundations.
Benchmarking Your OAS View Against Peers and Markets
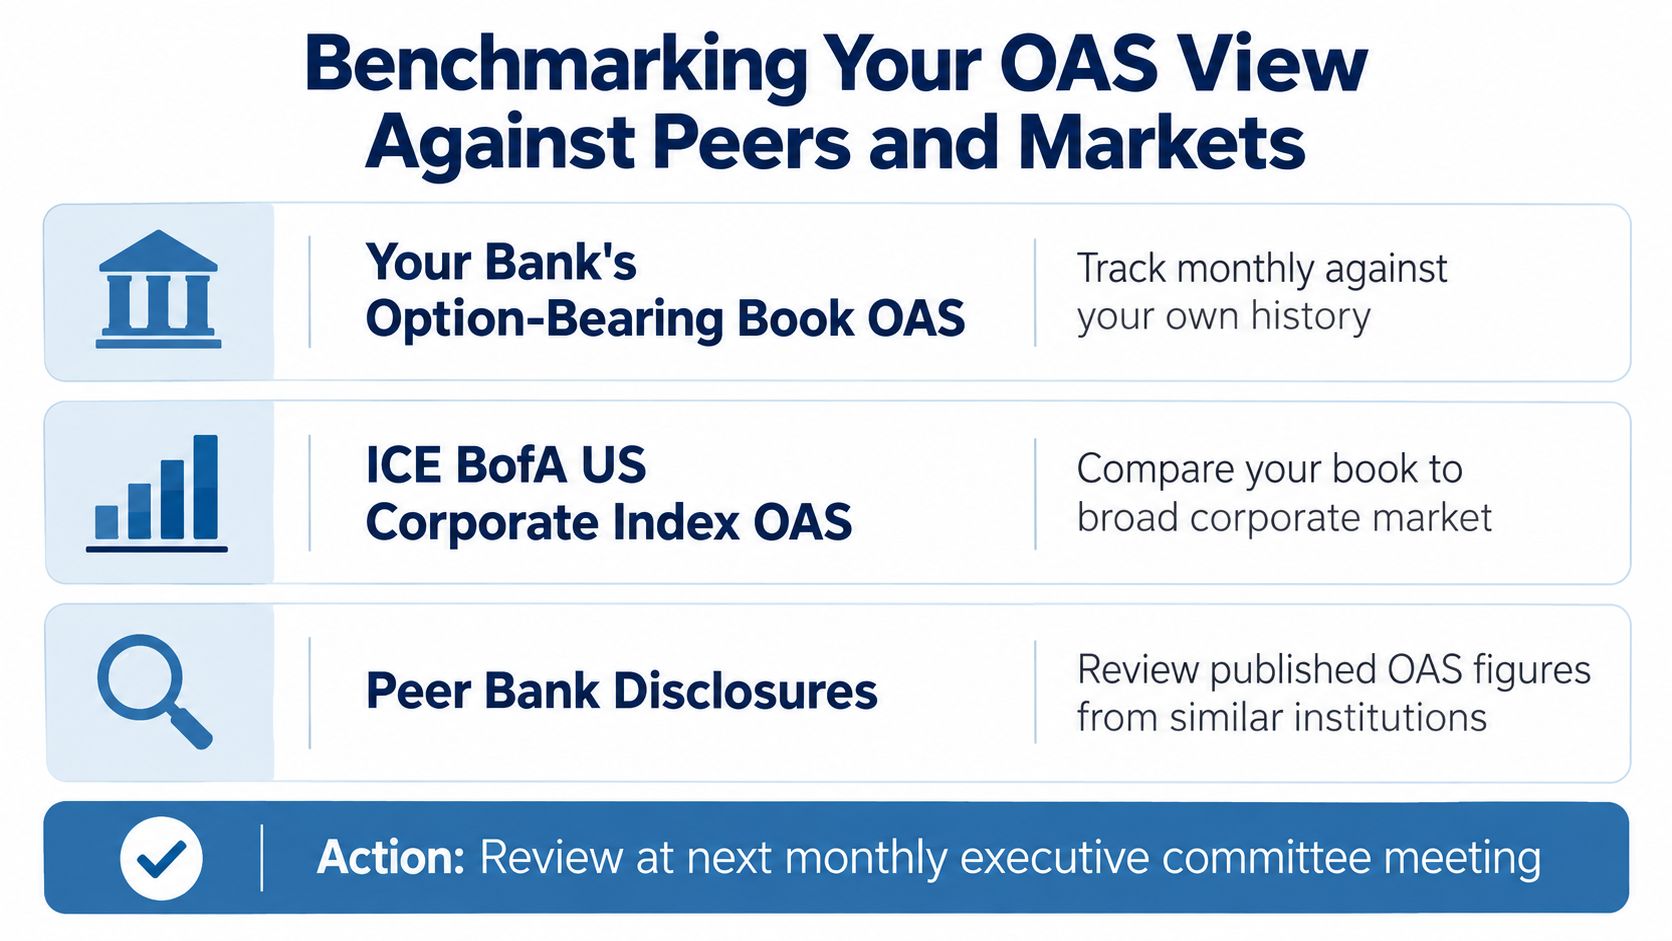
A monthly executive review can keep the comparison focused with a three-line dashboard:
- The bank's option-bearing book OAS, tracked against the institution's own history and portfolio composition.
- ICE BofA US Corporate Index OAS, used as a broad investment-grade corporate market reference.
- ICE BofA High Yield Master II OAS, used to monitor lower-rated corporate credit alongside investment-grade repricing.
The two market series provide useful context, but they don't describe the same risk segment. The investment-grade index covers qualifying US-dollar-denominated public corporate debt, while the high-yield series covers bonds rated below investment grade. Comparing them can help executives assess whether stress is more concentrated among lower-rated borrowers or spreading across corporate credit. The bank should also remember that index composition and weighting influence what each aggregate number represents.
Review the bank's deviation from these benchmarks quarterly and connect material gaps to a portfolio or policy discussion. The objective isn't to match a market index; it's to understand why the institution differs and whether that difference is deliberate. Internal modeling, market benchmarks, and peer context together turn OAS from a slide decoration into a decision input.
Use Visbanking's Bank Performance to benchmark peer trends and historical data, and explore Bank Intelligence (beta) for predictive risk and performance signals. Visit Visbanking to see how its bank intelligence tools can add peer and market context to your institution's OAS decisions.
Latest Articles

Brian's Banking Blog
How to Improve Margins: A Bank Leader's Playbook

Brian's Banking Blog
Automated Alerts and Notifications for Banks

Brian's Banking Blog
Customer Feedback Loop for Banks: A Practical Playbook

Brian's Banking Blog
Commercial Lending Trends: What Bank Executives Must Know

Brian's Banking Blog
Bank Marketing Dataset Analysis Strategy

Brian's Banking Blog