
How to Improve Margins: A Bank Leader's Playbook
Brian's Banking Blog
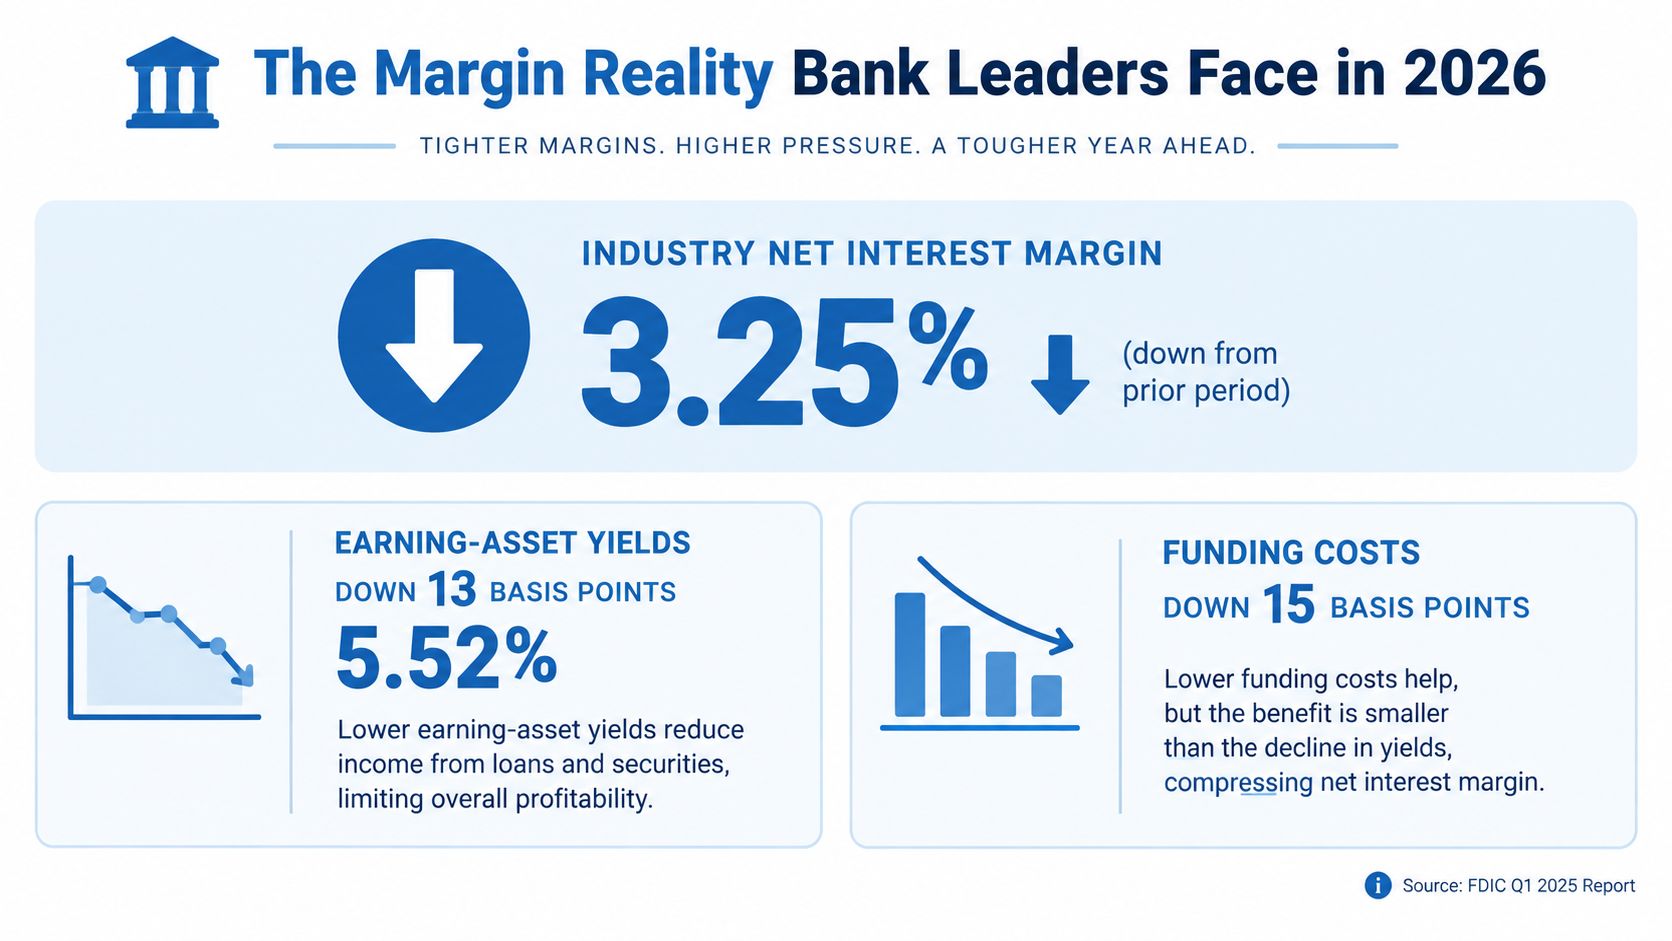
Improve margins by tightening pricing and funding discipline: a 10-basis-point NIM improvement equals roughly $1 million of annual net interest income for every $1 billion of average earning assets. U.S. industry NIM fell to 3.25% in Q1 2025 as earning-asset yields dropped 13 basis points, despite funding costs falling 15 basis points.
That's a better starting point than another loan-growth target. Executives asking how to improve margins should examine the economics of individual activities: which deposit cohort needs repricing, which lending relationship earns its capital allocation, and which operating workflow consumes more resources than it contributes.
NIM and efficiency belong in the same earnings bridge, not separate management presentations. Funding decisions affect relationship profitability. Service decisions affect deposit retention. Loan growth affects processing capacity and credit exposure. Manage those connections, and you can improve earnings without making the balance sheet larger to make the income statement look better.
The Margin Reality Bank Leaders Face in 2026
The FDIC's Q1 2025 baseline is explicit: industry NIM declined 2 basis points to 3.25%, earning-asset yields fell 13 basis points to 5.52%, and funding costs declined 15 basis points to 2.07%, according to its Quarterly Banking Profile. Those figures establish the starting point for planning, not a claim about current-quarter conditions in 2026.
Don't subtract the reported funding-cost change from the asset-yield change and assume you've explained NIM. Management must reconcile the balances, denominators, and composition behind those averages. Funding relief doesn't automatically translate into a wider reported margin.
Separate the rate cycle from your operating choices
Treat market rates as an external condition. Treat deposit exceptions, asset duration, funding concentration, and relationship pricing as management decisions. Confusing the two gives executives an excuse for underperformance without identifying an action.
A floating-rate loan book may reprice promptly while deposit rates remain constrained by customer expectations. A longer-duration asset portfolio may preserve income temporarily but limit flexibility later. Neither position is superior. The question is whether the institution understands the exposure and has priced it deliberately.
| Driver | Board-level question |
|---|---|
| Asset repricing | When will contractual yields reset, and under what terms? |
| Deposit behavior | Which customers require competitive rates to remain? |
| Funding composition | What would replacement liquidity actually cost? |
| Operating capacity | Does serving the balance sheet generate profitable activity? |
Don't turn an industry average into a target
Directors should resist calling the post-pandemic margin environment permanently tighter based on a historical snapshot. Rate-cycle sensitivity and structural weaknesses require different remedies. The first calls for scenario planning; the second calls for changes in pricing, product design, funding strategy, or execution.
Board discipline: Ask management which part of the margin outcome it controlled, which part reflected market conditions, and what it will change.
Loan growth is justified when it improves risk-adjusted earnings after funding and operating costs. Growth that merely replaces lost spread with more volume deserves a harder conversation.
Diagnose Margin Drivers Before You Spend a Dollar
Before approving a pricing campaign or expense initiative, demand a reconciled explanation of the earnings gap. A bank can have a weak headline margin because of low asset yields, expensive funding, an unfavorable balance-sheet mix, or some combination. Each diagnosis requires a different intervention.
The economic scale matters: a 10-basis-point NIM improvement produces roughly $1 million of additional annual net interest income per $1 billion of average earning assets, before taxes, provisions, or related funding costs, as illustrated by the FDIC's historical NIM data. That's a sensitivity calculation, not a promised return from any particular initiative.
Build a bridge that reconciles to the ledger
Start with reported net interest income and average earning assets. Then isolate changes attributable to asset pricing, liability pricing, volume, and composition. Keep operating-expense savings and fee improvements in the broader earnings bridge rather than labeling them NIM improvements.
Use this diagnostic checklist:
- Establish comparable peers. Begin with asset size and geography, then refine for lending concentrations, funding structure, and business model. A geographically convenient peer isn't necessarily an economically useful one.
- Inspect repricing exposure. Pull the relevant FFIEC/UBPR information and reconcile it with internal loan schedules, contractual resets, floors, and maturities.
- Separate deposit behavior. Examine non-maturity balances by customer cohort instead of assuming an account label describes its stability.
- Stress funding concentration. Identify what happens if large relationships leave and replacement funding becomes necessary.
- Validate the explanation. Reconcile management's driver analysis to the financial statements before attaching targets or compensation.
Make the diagnosis an ALCO responsibility
The asset-liability committee should own assumptions about repricing, liquidity, and balance-sheet positioning. Use a clear ALCO governance framework to establish who recommends actions, who approves exceptions, and who verifies results.
Peer intelligence is useful for finding the right questions. Internal account-level data is necessary to answer them. Public financial data can reveal that a bank's funding costs are unfavorable; it can't, by itself, establish which customer should receive a pricing exception.
Require each proposed action to include an owner, an expected earnings contribution, a measurement period, and a downside condition. Run the diagnostic quarterly, but monitor execution more frequently. If management can't connect an initiative to an identifiable driver, it isn't ready for approval.
Reprice Deposits With FTP, Not Gut Feel
Lakeland Financial provides a concrete funding-side example. Its Q1 2025 filing reported a 25-basis-point year-over-year NIM improvement to 3.40%, with interest expense falling 45 basis points, from 2.82% to 2.37% of average earning assets, and deposit interest expense declining $4.7 million, according to its SEC earnings filing.
That doesn't establish a universal repricing formula. It demonstrates why the CFO should examine funding economics before assuming more loans are the answer.
Give branches an economic decision rule
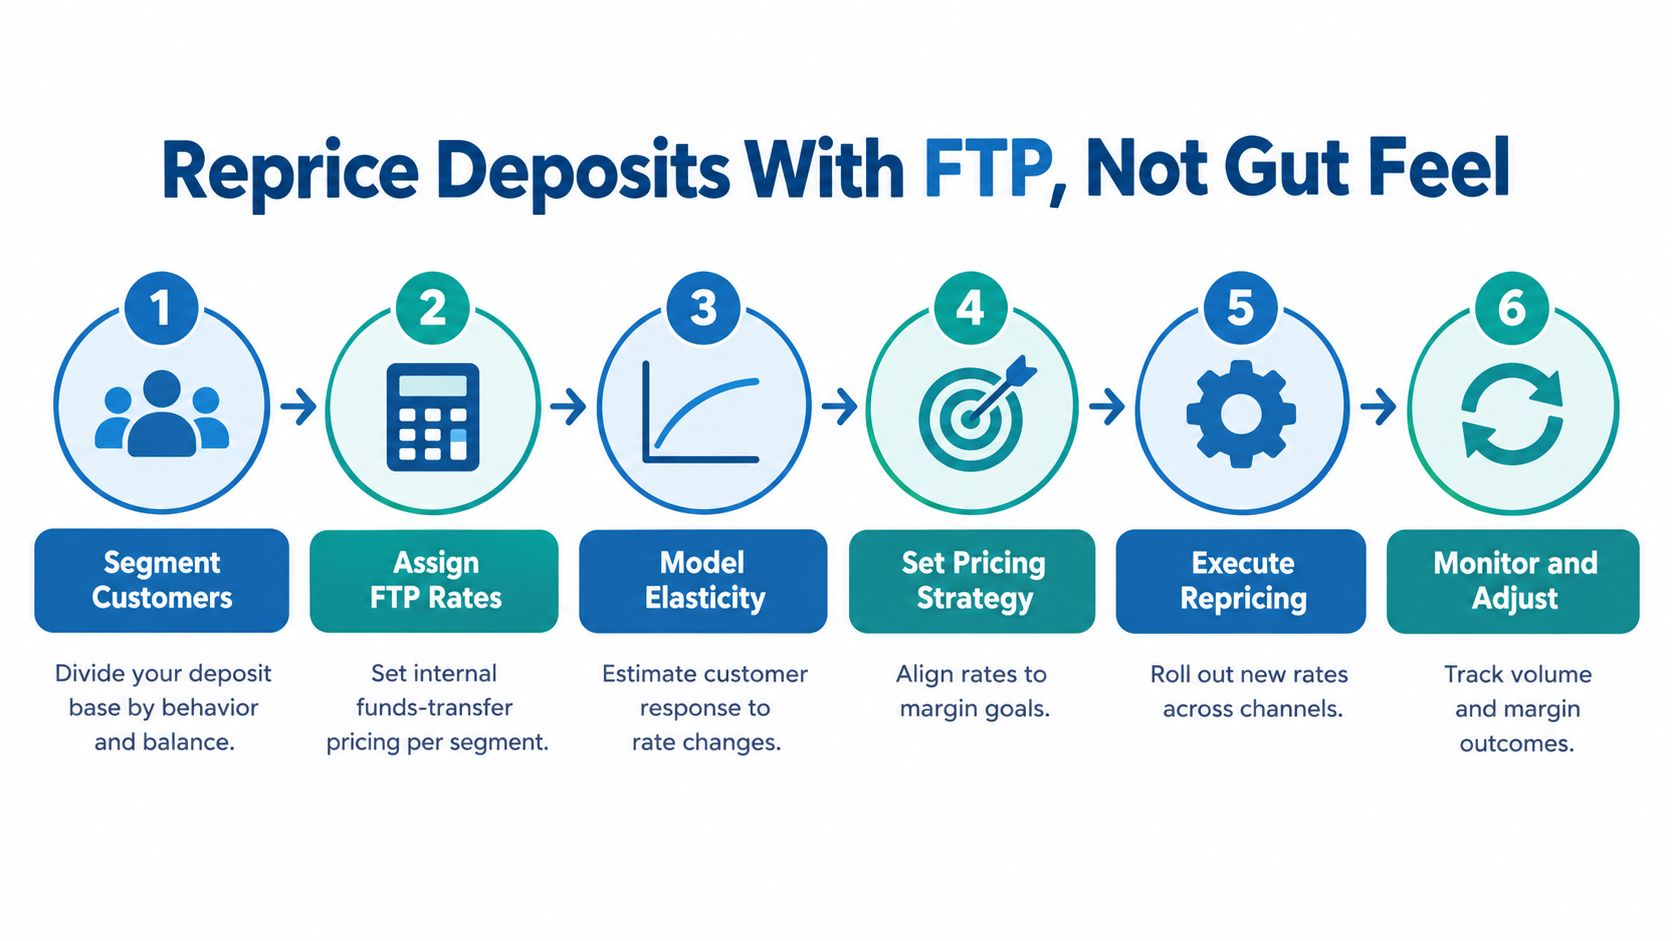
Funds-transfer pricing, or FTP, assigns an internal economic value to funding and assets. McKinsey describes its role in evaluating profitability and steering deposit portfolios toward desired products and tenors in its analysis of deposits as a retail-bank profitability lever.
Apply that discipline through a practical workflow:
- Segment the balances. Include product, stability, rate sensitivity, customer type, and tenor. Keep newly acquired promotional balances separate from established operating accounts.
- Assign marginal funding value. Use FTP rather than judging every deposit against the institution's average interest expense.
- Benchmark offered rates. Compare relevant market alternatives, not every advertised rate available nationally.
- Set economic hurdles. Acquisition, retention, and renewal decisions need distinct approval criteria.
- Monitor weekly. Track deposit beta, attrition, renewal behavior, and contribution margin together.
- Redirect incentives. Reward strategically useful funding and relationship earnings, not gross deposit production alone.
Control beta without losing sight of liquidity
Deposit beta is the percentage of a market-rate change passed through to deposit pricing. It's a useful control, but it isn't the entire decision. An attractive beta can coexist with damaging outflows or expensive replacement borrowing.
Measure the incremental spread after funding value, expected retention, and servicing expense. Keep the institution's cost-of-funds analysis consistent with the FTP assumptions branches use.
Don't approve a pricing exception because the customer is important. Approve it because the documented relationship economics justify it.
Promotional funding deserves particular scrutiny. Require an explicit renewal strategy before acquisition, not after the campaign closes. ALCO should see the projected cohort economics, the approved exceptions, and the actual outcome, with a clear explanation when customer behavior differs from the forecast.
Which Deposits You Reprice Matters More Than How Fast
Uniform rate cuts are easy to communicate and hard to defend economically. They assume customers are interchangeable when the CFO should be distinguishing stable operating balances, rate-shopping funds, and deposits attached to profitable credit relationships.
In one 2025 cohort, 65% of banks experienced margin contraction because they couldn't reduce deposit rates quickly enough; deposit costs were estimated near 2.03%, versus a prior five-year average of 0.9%, according to SouthState's banking-performance analysis. That's cohort evidence, not a finding about every bank.
The lesson isn't to cut faster. It's to decide faster using better customer economics.
Retain relationships, not just balances
Consider a hypothetical commercial depositor with predictable operating balances, limited servicing demands, and a profitable lending relationship. Paying somewhat more to retain that funding may be preferable to losing the deposits, buying replacement liquidity, and weakening the credit relationship.
Contrast that customer with a promotional depositor who moves whenever another institution offers a better rate and generates little other revenue. The same exception can be rational for the former and unattractive for the latter.
| Decision | Evidence management should require |
|---|---|
| Retain at a higher rate | Stable balances, positive relationship contribution, credible replacement-cost comparison |
| Reprice within standard terms | Demonstrated tolerance, suitable alternatives, limited relationship disruption |
| Allow runoff | Weak contribution, high servicing burden, acceptable liquidity impact |
Put a price on the exception
Build the retention decision around observed behavior, balance volatility, product profitability, and relationship depth. Include cross-sell potential only when the relationship manager can identify a credible opportunity. An unspecified future relationship shouldn't subsidize expensive funding indefinitely.
Every exception should have an expiration or review trigger. Otherwise, a decision that made sense under one set of conditions becomes a permanent entitlement.
Retention test: Would you still approve this rate if the customer's other business disappeared?
Directors should receive a distribution of outcomes, not just the average deposit rate. Ask how much funding management retained through exceptions, whether those relationships remained profitable, and whether runoff required more expensive substitutes.
There's a trade-off. Repricing can improve direct funding expense while reducing relationship earnings or liquidity flexibility. The right decision maximizes the bank's overall economics, not the appearance of discipline in a single cost-of-funds metric.
Build an Efficiency Program That Lifts Margin, Not Just Ratios
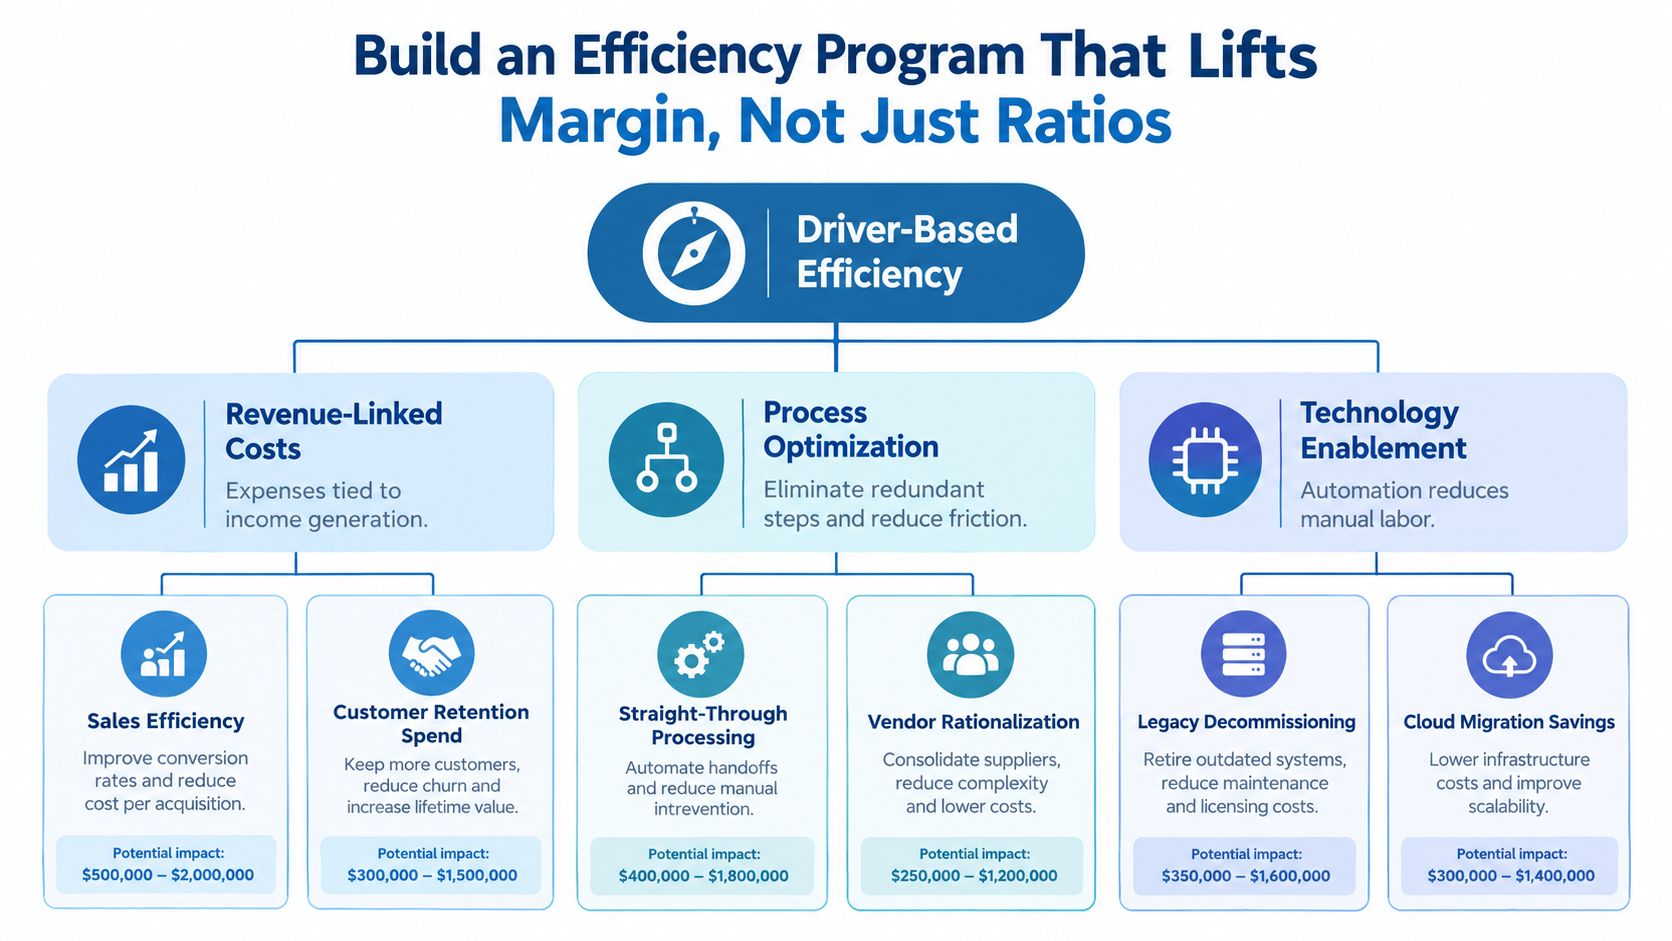
Start with the workflow, not the organization chart. Cutting a relationship manager's position may lower payroll while leaving the institution with slower renewals, weaker customer coverage, and less revenue. Eliminating repetitive reconciliation work can release capacity without removing the people who generate earnings.
Community-bank noninterest expense declined $423.2 million, or 2.3%, quarter over quarter in Q1 2025, while the efficiency ratio improved 39 basis points to 64.69%, as reported in BerryDunn's review of the FDIC profile. Those changes warrant investigation, not an automatic declaration of structural improvement.
Connect expense to the activity that creates it
The FDIC defines the efficiency ratio as noninterest expense, adjusted for amortization of intangibles, divided by net interest income plus noninterest income in its Q1 2025 data tables. Use a consistent banking efficiency-ratio methodology before comparing branches, products, or channels.
Build the operating analysis around cost drivers:
- Fixed infrastructure. Identify facilities, systems, and contracts that remain regardless of transaction volume.
- Personnel capacity. Separate customer-facing work, credit judgment, required controls, and avoidable administration.
- Third-party processing. Examine unit costs, minimum commitments, duplicate services, and contract exit conditions.
- Volume-sensitive expense. Track what changes as accounts, applications, or transactions increase.
Then select a workflow with excessive manual touches and limited revenue or risk value. Pilot the redesign in a contained process or market. Preserve necessary controls and measure turnaround time, errors, retention, and expense per account before expanding it.
Test whether savings reach earnings
A hypothetical 5% reduction in $100 million of annual noninterest expense represents $5 million in recurring savings, before implementation costs and taxes, using the expense arithmetic discussed in McKinsey's productivity analysis. Don't confuse an approved savings plan with realized expense reduction.
For technology-heavy work, assign an accountable architecture and vendor-governance owner. Executives considering outside support can evaluate the Nexus IT Group fractional CIO resource as an option, while keeping approval authority and earnings accountability inside the bank.
Measure absolute expenses alongside the ratio. Temporary revenue strength can improve the denominator without changing the cost base. The CFO should accept a claimed improvement only when management can explain the operational change, reconcile the financial effect, and demonstrate that service and risk controls held up.
Where Modernization Quietly Destroys Margin
A technology budget isn't an efficiency program. Buying software, migrating infrastructure, and automating tasks are activities. The financial outcome depends on what management removes, how employees adopt the changes, and whether customers receive better service.
Global bank technology spending rose 41.2% from 2019 to 2025, technology reached 22% of overall bank spending, and total operating costs still increased 7.7% in 2025, according to Coalition Greenwich's technology-spending analysis. Those figures don't prove technology caused the expense increase. They do undermine the assumption that spending more on technology automatically lowers operating costs.

Demand a workflow-level investment case
Take deposit onboarding as a hypothetical example. An automated process may reduce document handling, but the business case fails if employees keep parallel spreadsheets, customers abandon the application, or compliance staff must repair incomplete records manually.
Evaluate contribution after implementation, integration, vendor, compliance, and change-management costs. Also distinguish released capacity from cash savings. Employees spending less time on administration doesn't reduce payroll unless management changes staffing or avoids a planned expense.
Released capacity can still be valuable. Assign it to identifiable work, such as credit analysis, customer follow-up, or renewal preparation, and measure the resulting output. Don't book speculative revenue as though it has already been earned.
Require evidence before declaring success
Use an investment acceptance checklist:
- Baseline established. Document the existing cost, processing time, exception rate, and customer outcome.
- Full costs captured. Include parallel operations, integration maintenance, training, and vendor commitments.
- Adoption demonstrated. Confirm employees use the new process rather than retaining the old one.
- Legacy expense removed. Identify actual contract cancellations, system retirements, or avoided spending.
- Revenue protected. Check abandonment, customer complaints, retention, and service continuity.
- Results reconciled. Finance verifies realized expense and contribution against the approved case.
Stop projects that can't demonstrate a credible path to improved economics. Sunk implementation costs aren't a reason to keep funding a weak design.
The strongest modernization proposal isn't the most ambitious. It's the one where executives can name the workflow, the owner, the displaced activity, and the measurable earnings result.
Your 90-Day Margin Improvement Roadmap
Run a single execution program with separate attribution for pricing, funding, fees, credit effects, and expense. The McKinsey analysis cited earlier assigned 34% of banking outperformance to revenue growth, 34% to NIM management, 16% to fee growth, and 5% to cost efficiency. That supports a balanced management agenda, not a cost-only campaign.
Sequence action around verified economics
- Weeks 1–2, establish the baseline. Reconcile FDIC, FFIEC/UBPR, and SEC information with internal data. The deliverable is a fully explained peer gap and an approved earnings bridge, reviewed by finance and ALCO.
- Weeks 3–6, execute pricing decisions. Recalibrate FTP, authorize cohort-level deposit actions, and review eligible variable-rate loan repricing. Set bank-specific dollar targets and check funding contribution and retention weekly.
- Weeks 7–10, test operating changes. Pilot a contained workflow redesign. Require positive contribution after implementation costs, with weekly expense-per-account and revenue-per-employee monitoring.
- Weeks 11–13, tighten relationship economics. Review commercial pricing, justified fees, and credit-adjusted contribution. Reconcile realized fee income and relationship results to the bridge at the closing management review.
Don't allocate invented basis-point targets to satisfy a presentation template. Derive each target from actual balances, contracts, customer behavior, and execution costs. Assign an owner and a stop condition before implementation.
The board should receive a concise reconciliation: what management changed, what earnings it realized, what remains unproven, and what risks increased.
Visbanking's Bank Performance app supports benchmarking and historical analysis across 4,600+ institutions, while Bank Intelligence, currently in beta, surfaces predictive risk and performance signals. Visit Visbanking to explore the data, compare your bank's trajectory with relevant peers, and turn identified margin gaps into a monitored pricing, funding, and efficiency agenda.
Latest Articles
Brian's Banking Blog
Automated Alerts and Notifications for Banks
Brian's Banking Blog
Customer Feedback Loop for Banks: A Practical Playbook

Brian's Banking Blog
Commercial Lending Trends: What Bank Executives Must Know
Brian's Banking Blog
Bank Marketing Dataset Analysis Strategy

Brian's Banking Blog
ESG Peer Benchmarking for Bank Leaders
Brian's Banking Blog