Mastering The Banking Efficiency Ratio: A Guide for Bank Executives
Brian's Banking Blog
For measuring a bank's operational performance, the banking efficiency ratio is the metric that matters most. It is the definitive scorecard, showing precisely how much your institution spends to generate a single dollar of revenue. This ratio cuts through the noise of simple profit margins to provide a standardized, unvarnished view of your bank's financial health and strategic execution.
What The Efficiency Ratio Reveals About Your Bank

For any executive or board member, this ratio is more than a regulatory requirement; it is your most critical diagnostic tool. This single number contains the story of every operational decision—from technology investments and staffing levels to branch footprint and vendor contracts.
A low ratio signals a well-managed institution with disciplined cost controls and robust revenue streams. Conversely, a high or rising ratio is a clear warning sign. It can expose operational drag, underperforming assets, or a bloated cost structure that is eroding shareholder value.
The Core Calculation
The formula is straightforward: divide the bank's noninterest expenses by its total revenues (net interest income plus noninterest income). The resulting percentage represents the cost of generating each dollar of revenue.
Of course, the number is meaningless without context. Industry consolidation, shifting business models, and economic cycles continuously move the goalposts. For this reason, rigorous peer comparison is non-negotiable. For a broader view, the FDIC offers the full analysis on banking efficiency trends.
Mastering this ratio is a prerequisite for effective leadership, as it is a direct reflection of your bank's day-to-day strategic execution.
A rising efficiency ratio is often the first tremor before an earthquake. It serves as the earliest warning that expenses are outpacing revenue—a dangerous trend that, if unaddressed, will compress margins and limit strategic flexibility.
To act on this data, one must understand its components from an executive perspective.
Efficiency Ratio Components At A Glance
This table simplifies the calculation's inputs and their strategic implications for decision-making.
| Component | What It Measures | Executive Implication |
|---|---|---|
| Noninterest Expenses | All operational costs not directly tied to interest payments, including salaries, technology, occupancy, and marketing. | This is your operational overhead. Disciplined management of these costs provides the most direct path to improving efficiency. |
| Total Revenue | The sum of Net Interest Income (from lending and investments) and Noninterest Income (from fees and services). | This represents your institution's total earning power. Growing this side of the equation is as critical as controlling costs. |
In short, managing the ratio is a continuous balancing act between disciplined spending and strategic revenue growth.
Why It Demands Executive Attention
The efficiency ratio is not a passive metric for a quarterly report; it is an active gauge of your bank's competitive fitness. In a market defined by thin margins and technological disruption, the ability to manage this ratio is the ability to lead.
It compels executives to ask critical operational questions:
- Are our technology investments delivering measurable productivity gains?
- Is our branch network optimized for current customer behavior, not that of a decade ago?
- Are our fee-based income streams sufficiently diverse to withstand market shifts?
A firm grasp of this metric is the foundation of sustainable, profitable growth. Data intelligence platforms like Visbanking replace guesswork with certainty. By benchmarking your ratio against custom peer groups, you can diagnose the true source of inefficiencies and model the impact of strategic initiatives. It is time to see how your bank truly measures up.
Deconstructing The Formula: Levers You Can Control
To effectively manage your bank's efficiency ratio, you must master its components. The formula directly reflects two core functions: operational expense management and revenue generation. Every strategic decision your leadership team makes pulls one of these two levers.
The infographic below illustrates the powerful relationship between expenses, income, and the resulting ratio.
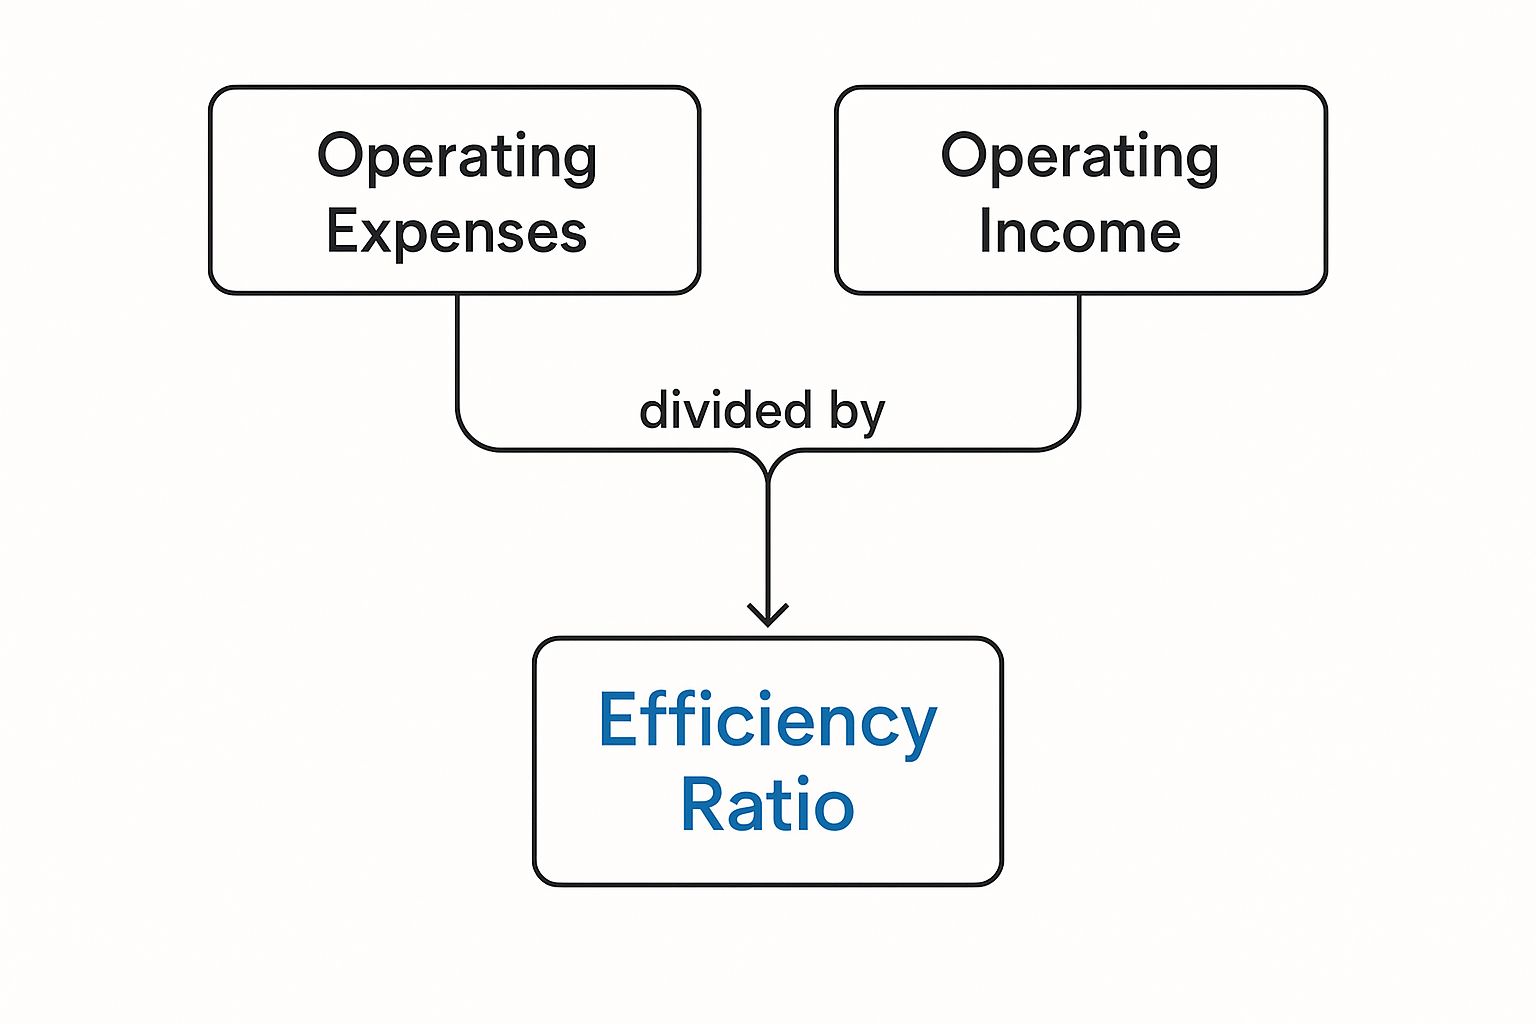
The task is to either shrink the numerator (expenses) or grow the denominator (income). The most successful institutions execute on both fronts simultaneously.
The Numerator: Noninterest Expenses
This represents the cost of running the institution. Noninterest expenses encompass all operational overhead and present the most direct opportunity for impact.
Key drivers include:
- Compensation and Benefits: Typically the largest expense category, covering salaries, incentives, and healthcare.
- Technology and Infrastructure: Core systems, digital banking platforms, cybersecurity, and data analytics tools.
- Occupancy and Real Estate: The branch network, corporate offices, and associated maintenance.
- Regulatory and Compliance: The escalating costs of meeting regulatory requirements, including specialized staff and software.
A granular analysis of these costs against relevant peer benchmarks is the first step toward identifying overspending. For a complete analysis, our guide provides a breakdown of bank income versus expense structures.
The Denominator: Total Revenue
The other side of the equation is the bank's total earning power: the sum of net interest income and noninterest income. Growing revenue is as critical as trimming expenses, as a strong revenue base can absorb necessary operational investments.
Revenue is derived from two primary streams:
- Net Interest Income (NII): The traditional engine of bank profitability, driven by the performance and pricing of the loan and investment portfolios.
- Noninterest Income: Fee-based revenue from deposit services, wealth management, mortgage servicing, and other value-added products.
Every strategic decision has a direct cause-and-effect relationship with the bottom line. A seemingly minor adjustment can produce a significant impact on the banking efficiency ratio when scaled across the institution.
Consider a practical example: a community bank with $25 million in noninterest expenses and $40 million in revenue has a 62.5% efficiency ratio. A strategic renegotiation of several key vendor contracts reduces expenses by 5%, yielding a $1.25 million savings.
The efficiency ratio immediately drops to 59.4%—a 310-basis-point improvement from a single initiative. This is the power leaders have when they know which levers to pull. A platform like Visbanking allows you to model these changes and benchmark every expense category to identify the most significant opportunities.
Benchmarking Your Bank's Performance
What defines a "good" efficiency ratio? For years, 50% has been the unofficial gold standard, signaling an operational powerhouse that spends just fifty cents to generate each dollar of revenue.
However, blindly pursuing a single number without context is a strategic error. A bank’s asset size, business model, and geographic market dictate what is realistic and effective. Aggressively chasing a low number can lead to underinvestment in critical areas like technology or talent retention.
The objective is not just to hit a number, but to outperform the right competitors.
The Nuances of Peer Comparison
Context is paramount. A community bank built on high-touch service and a physical branch network operates with a different cost structure than a large money-center institution. Their strategies differ, and so should their benchmarks.
Data confirms this. In late 2023, the median efficiency ratio for community banks hovered around 68%, while larger noncommunity banks were closer to 63%. This five-point gap does not signal failure; it reflects different operating models and economies of scale. You can review the complete data on these banking industry performance metrics.
This is precisely why broad industry averages are insufficient for serious strategic planning. Executives must ask more incisive questions:
- How does our performance compare to banks of a similar asset size?
- What is the norm for institutions with our specific loan portfolio mix?
- Are we keeping pace with direct competitors in our primary geographic markets?
An efficiency ratio is only as valuable as the comparison it enables. Without proper context, it's just a number; with precise benchmarking, it becomes a strategic roadmap for improvement and a clear measure of competitive standing.
From Raw Data to Actionable Intelligence
Answering these questions requires more than a simple spreadsheet. It demands the ability to segment the market for a true apples-to-apples comparison. This is how raw data is transformed into a strategic action plan.
For example, your bank’s ratio is 67%, slightly better than the community bank median. On the surface, this seems adequate. But what if a granular analysis reveals your compensation expenses are 5% higher than your direct peers, while your technology spend is 3% lower? Now you have a specific, actionable insight. Are you overstaffed, or are you underinvesting in automation that could drive long-term efficiency?
This is the level of detail that fuels confident decisions. By leveraging powerful bank peer group analysis, you can move beyond broad averages to pinpoint specific opportunities. With Visbanking, you can construct custom peer groups to benchmark every facet of your performance, turning the efficiency ratio from a simple metric into a tool for strategic action.
Navigating Market Pressures And Ratio Volatility
A bank’s efficiency ratio is a dynamic indicator of its resilience to market forces. While internal strategy is controllable, external factors like interest rate fluctuations, economic cycles, and regulatory changes are not. These forces can create powerful headwinds—or tailwinds—that directly impact your bottom line.
The key takeaway for executives is that sustainable efficiency is not merely about cost reduction. It is about building an agile operation that can absorb market shocks and capitalize on opportunities. The goal is to anticipate these pressures, not just react to them.
The Macroeconomic Squeeze on Your Ratio
Recent years serve as a clear case study. As interest rates fluctuated and economic uncertainty grew, many banks saw income streams contract while expenses continued to climb. This combination pushed the aggregate efficiency ratio higher across the industry.
In the second quarter of 2023, the average efficiency ratio for U.S. banks rose to 55.44%, the first quarterly worsening in over a year. The drivers were a significant drop in noninterest income, a slight dip in net interest income, and a steady increase in noninterest expenses. The full story on this recent banking industry trend details the underlying causes.
Such environments quickly expose vulnerabilities. Banks that are overly reliant on a single revenue stream or lack expense discipline are the first to see their ratios deteriorate when market conditions tighten.
A volatile market separates the resilient from the reactive. Banks that maintain or improve their efficiency ratio during economic headwinds demonstrate superior strategic foresight and operational control. They protect profitability when it matters most.
Trading Guesswork for Data-Driven Foresight
The challenge for leadership is not simply acknowledging macroeconomic trends but translating that awareness into decisive action. This is where high-quality data intelligence becomes indispensable. Instead of waiting for a quarterly report to signal a problem, you can model the impact of market shifts before they occur.
Consider these applications:
- Interest Rate Scenarios: What is the projected impact of a 50-basis-point rate cut on your net interest margin and, consequently, your efficiency ratio? Modeling this provides a clear forecast, enabling proactive balance sheet adjustments.
- Expense Reality Checks: Noninterest expenses are rising industry-wide. But are your costs increasing in line with your peers, or is there an internal leak? Pinpoint peer benchmarking provides the answer.
- The Cost of Compliance: How will new regulations affect your overhead compared to other banks of your size? Granular data helps you budget accurately and identify offsetting efficiencies.
To navigate volatility, leadership must shift from a reactive to a proactive posture. By using a robust data platform like Visbanking, executives can benchmark their institution against hand-picked peer groups in real time. This is how you identify threats before they fully materialize, pressure-test strategies, and make the agile, informed decisions required to protect your efficiency ratio and your bank's future.
Data-Driven Strategies To Improve Your Ratio

Lowering your bank's efficiency ratio is not about arbitrary, slash-and-burn cost-cutting. That is a short-term tactic, not a sustainable strategy. Lasting improvement is the result of disciplined, data-backed initiatives.
While each bank's path is unique, the journey to a leaner, more profitable operation is built on three pillars. Mastering these is what separates market leaders from the rest. They are not discrete tasks but interconnected components of a comprehensive strategy for building a more resilient institution.
Operational Process Optimization
The most immediate improvements often come from optimizing internal workflows. Many institutions are burdened by legacy processes that create friction and inflate noninterest expenses, particularly labor costs. The objective is to identify and eliminate these operational drags.
Consider a mid-sized bank using a paper-intensive commercial loan origination process. The back office is mired in redundant data entry, manual compliance checks, and document chasing. This inefficiency directly inflates the numerator of the banking efficiency ratio.
Now, imagine that bank implements a modern loan origination system that automates data verification and centralizes documents. This single investment could reduce processing time by 30%. If that project cuts related salary costs by $500,000 annually, a bank with $70 million in revenue has just lowered its efficiency ratio by nearly a full percentage point. This demonstrates the power of optimizing a single, critical workflow.
Strategic Technology Investment
Optimizing processes refines what you already do; strategic technology investment redefines what is possible. This is not about acquiring the latest trend but deploying tools that fundamentally lower the cost-to-serve while creating new revenue opportunities. The most significant gains are found in data analytics, digital customer platforms, and intelligent automation.
A well-executed technology strategy is a powerful deflationary force on your expense base. It allows you to scale operations, serve more customers, and handle greater transaction volumes without a proportional increase in headcount or overhead.
Imagine a community bank investing in a customer data platform. By analyzing transaction patterns, the platform identifies high-value clients who are prime candidates for wealth management services. This allows relationship managers to focus their efforts for maximum impact, boosting cross-sells of fee-generating products and strengthening the ratio's denominator.
This is where sharp peer analysis becomes a strategic advantage. A data intelligence platform like Visbanking allows you to benchmark your technology spend against top performers, ensuring your investments are driving efficiency, not just bloating the expense line.
Revenue Diversification
Finally, cost-cutting alone cannot produce a best-in-class efficiency ratio. A truly efficient bank is also adept at growing high-margin, noninterest income. Over-reliance on net interest income leaves an institution vulnerable to interest rate volatility. A diversified revenue portfolio is the best defense.
A prime example is a bank that strengthens its treasury management services for commercial clients. By offering solutions like ACH origination, remote deposit capture, and fraud protection tools, the bank establishes a stable stream of fee income. This not only diversifies revenue away from lending but also fortifies the denominator of the efficiency ratio, creating a crucial buffer when lending margins are compressed.
The optimal path forward depends on your bank's unique circumstances. The table below outlines these high-impact strategies to help guide your decision-making.
High-Impact Strategies For Ratio Improvement
| Strategy | Primary Focus Area | Potential Impact | Key Challenge |
|---|---|---|---|
| Operational Optimization | Internal Processes & Workflows | High | Identifying bottlenecks; overcoming resistance to change |
| Strategic Technology | Automation & Data Analytics | Very High | Significant upfront investment; requires skilled implementation |
| Revenue Diversification | Noninterest Income Growth | High | Requires product development and market expertise |
Ultimately, a combination of these strategies—streamlining operations, investing in smart technology, and diversifying revenue—provides a robust framework for improving your banking efficiency ratio. But you cannot determine the destination until you know your precise starting point.
Explore how Visbanking’s granular peer data can illuminate your greatest opportunities for action.
Putting Data Intelligence Into Action
Sustainable efficiency is not achieved by reacting to poor quarterly results. True operational command is built on a foundation of proactive data intelligence.
For bank executives, the paradigm has shifted. The efficiency ratio is no longer a historical metric but a forward-looking tool that must shape daily decisions. A modern data platform is now essential, enabling leaders to move from passively knowing their ratio to actively shaping it.
True command of operations means turning raw numbers into decisive action. It is the ability to benchmark performance against a hand-picked peer group in real-time, pinpoint the precise drivers of expense, and model the impact of a strategic move before committing capital.
From Static Reports To Dynamic Strategy
Historically, analyzing the banking efficiency ratio was a retrospective exercise. By the time data was compiled, the window for meaningful action had often closed. Today, data intelligence platforms reverse this dynamic, providing a forward-looking, command-and-control view of performance.
Suppose your bank has a persistent efficiency ratio of 71%. A standard report might indicate that noninterest expenses are high. But why? A dynamic business intelligence system delivers the depth to uncover the real story.
- Drill Down on Expenses: Instead of a single "Salaries and Employee Benefits" line item, you can deconstruct it. You might discover that while your headcount aligns with peers, your cost per employee is 15% higher. This provides a clear directive to review compensation and benefits structures.
- Benchmark Your Performance: Perhaps your occupancy expenses are 10% below the peer average—a clear strength. However, you see your technology spend is 20% higher, while digital adoption rates lag. This is a red flag indicating a potential ROI problem with technology investments.
This level of detail transforms the conversation from a vague "our costs are too high" to a specific, actionable "we need to re-evaluate our core processing vendor contracts and determine if our CRM is delivering real productivity gains."
Modeling Decisions Before They Hit The Balance Sheet
Perhaps the most powerful capability of a data intelligence platform is the ability to execute "what-if" scenarios. Major strategic decisions no longer need to rely on instinct alone; they can be pressure-tested with data.
Data intelligence gives executives the power to ask "what if?" and get a concrete answer back. It turns strategic planning from an exercise in educated guesswork into a data-driven discipline, cutting your risk and seriously boosting your odds of success.
Imagine your board is debating the acquisition of a smaller bank. A robust data tool allows you to model the combined entity's pro forma efficiency ratio. You can simulate the impact of integrating a more expensive branch network or project the savings from consolidating back-office functions. This analysis determines if the acquisition supports your efficiency goals from day one.
Consider another scenario: before committing $2 million to a new digital onboarding platform, you can model its projected impact. By forecasting a 15% reduction in manual processing hours and a 5% lift in new deposit accounts, you can calculate the expected improvement to your efficiency ratio over 12, 24, and 36 months. This provides a clear, data-backed business case for the board. For bank CFOs seeking to implement such a system, knowing how to get a solid business intelligence system up and running is the critical first step.
This is how top-performing institutions operate. They do not merely measure their banking efficiency ratio; they manage it with precision, using data to guide every major decision.
At Visbanking, we provide the Bank Intelligence and Action System that top executives use to turn complex data into their most valuable strategic asset. Stop reacting to performance and start directing it. Explore the Visbanking platform to see how granular peer benchmarking and predictive insights can drive your institution's success.
Related Articles

Visbanking Blog
Bank Efficiency Ratio Explained: What 60% Really Means

Visbanking Blog
What the Efficiency Ratio Tells You About a Bank

Visbanking Blog
How Bank Efficiency Ratios Reveal Hidden Operational Costs

Visbanking Blog
Bank Comparison Tools: Find Your Perfect Financial Match

Visbanking Blog
Unveiling Insights: Exploring Performance Conditions of US Banks with Visbanking Banking Report Portal

Visbanking Blog