
Regulatory Rules for U.S. Banks: What Matters in 2026
Brian's Banking Blog
Your board is considering a new commercial lending segment and a fintech partnership. The growth case looks attractive, but the CFO and chief compliance officer need different records to answer the same question: can the bank support both without breaching a capital constraint, weakening customer due diligence, or adding reporting work it hasn't budgeted for?
Why Regulatory Rules Now Shape Bank Strategy
Consider a hypothetical $1.0 billion community bank pursuing those initiatives in the same planning cycle. The lending team models revenue, the finance team tests capital capacity, and compliance asks who will own customer identification, transaction monitoring, and partner oversight. Approval requires those analyses to reconcile.
Regulatory rules shape the decision through three channels:
- Capacity: Capital and liquidity requirements constrain how much balance-sheet risk management can assume.
- Obligations: Customer records, reporting definitions, and retention requirements determine what the bank must collect and preserve.
- Cost: Staff, systems, verification, and review work determine whether projected revenue translates into acceptable returns.

Separate risk protection from processing work
Executives should distinguish controls that protect solvency or detect financial crime from the manual work used to document those controls. Both may be mandatory. They don't deserve identical technology solutions or spending priorities.
For software-dependent controls, DevArmor's resource on policy enforcement for financial software provides useful context for connecting written policies to application behavior. Management should specify the evidence a control produces before approving the system that runs it.
The board's questions should be concrete: Which requirements apply, which records prove compliance, and where do cost and risk concentrate? A business proposal isn't decision-ready until management can identify the responsible owner, affected data, and operating consequences.
The U.S. Rules Governing Banks and Credit Unions
Read this comparison by institution type first, then by the records needed to demonstrate compliance.
Major U.S. regulatory rules and what they govern
| Rule or Report | Who It Applies To | What It Governs | Data It Draws On |
|---|---|---|---|
| FDIC Part 363 audit and reporting rules | Insured banks above FDIC asset thresholds | Annual independent audits, internal controls, audit committees | Call Report and asset data |
| FinCEN BSA/AML and customer due diligence rules | Banks and credit unions | Customer risk profiles, monitoring, beneficial ownership | KYC records and transaction data |
| FFIEC Call Report and UBPR | Banks under FFIEC agencies | Quarterly condition reporting and supervisory performance analysis | Call Report line items |
| NCUA 5300 Call Report | Federally insured credit unions | Quarterly financial and regulatory reporting | 5300 Call Report line items |
| HMDA | Lenders above HMDA coverage thresholds | Mortgage application and loan disclosure | Loan-level origination records |
| SBA program rules (7(a) and 504) | Lenders in SBA programs | Guaranty eligibility, documentation, program compliance | Loan-level SBA program data |
| Basel III capital and liquidity rules | Large banks, with requirements implemented through applicable domestic frameworks | CET1, leverage, LCR, output floor | Regulatory capital and liquidity reports |
Start with scope, not a reporting template
For audit and control requirements, finance should establish the applicable asset measure and organizational perimeter before commissioning work. A consolidated asset total and a legal-entity asset total aren't interchangeable because both appear in management reporting.
Customer due diligence requires a different operating model. The FFIEC BSA/AML examination manual describes risk-based procedures for understanding customer relationships, maintaining risk profiles, monitoring suspicious activity, and updating information when warranted. An onboarding approval alone doesn't demonstrate that the relationship remains understood.
Call Reports provide financial condition information; the UBPR supports performance analysis rather than replacing the underlying filing. Credit unions need their own reporting taxonomy through the NCUA framework. Assigning both populations the same reporting fields would obscure differences rather than standardize them.
Product coverage needs separate decisions
HMDA coverage depends on lender-size and loan-volume tests set in regulation. Confirm coverage annually before building the loan-level extract, and preserve the determination alongside the extract.
SBA participating lenders should maintain program-level files that support guaranty eligibility and documentation reviews. A credit-approved loan file isn't automatically a complete program-compliance file.
Basel standards establish an international framework, not a substitute for domestic applicability analysis. The Basel Committee's capital framework summary explains the post-crisis emphasis on stronger capital and consistent implementation; national authorities can impose stricter requirements.
Use the institution's charter and supervisory relationships to establish accountability, supported by this overview of regulatory agencies for banks.
Scope test: Establish why the institution is covered before asking whether its records prove compliance.
Capital and Liquidity Thresholds to Track
Treat this table as a planning register, not an eligibility opinion. The cited capital frameworks establish different requirements for different institution populations.
Capital and liquidity thresholds that trigger action
| Threshold | Value | Applies To | Why It Matters |
|---|---|---|---|
| CET1 minimum | 4.5% | Large banking organizations | Floor before buffers |
| Stress capital buffer | At least 2.5% | Large banking organizations | Set partly by stress-test results |
| Combined CET1 baseline example | At least 7.5% with a 3.0% buffer | Large banking organizations | Shows how buffers stack |
| Well-capitalized CET1 floor | 6.5% | Banks under prompt corrective action | Basel III well-capitalized benchmark |
| Community Bank Leverage Ratio | 8%, down from 9% | Eligible community banks | Four quarters to return to compliance |
| Liquidity Coverage Ratio | 100% | Banks subject to the LCR | Full strength since January 1, 2019 |
| Output floor | 72.5% in 2026 | Banks using internal models, subject to applicable implementation | Limits modeled risk-weighted asset reductions |
The Federal Reserve's large-bank capital requirements publication states the 4.5% CET1 minimum and at least 2.5% stress capital buffer; its framework produces a baseline of at least 7.5% when the institution-specific buffer is 3.0%, before other applicable requirements. The well-capitalized benchmark is a separate classification test, not the same thing as a large bank's complete buffer stack.
Translate ratios into planning capacity
The Federal Reserve's capital-framework testimony describes the 2026 CBLR change from 9% to 8%, the extension from two quarters to four quarters to return to compliance, and approximately $10 million of tier 1 capital capacity for a bank with $1.0 billion in average consolidated assets.
That capacity isn't automatically distributable cash. Finance still needs to evaluate eligibility, asset growth, losses under stress, and the bank's internal capital target before recommending lending or dividends.
Liquidity and model constraints need separate monitoring. The Basel Committee's standards overview describes the LCR's progression to 100% in 2019 and an output-floor schedule reaching 72.5% in 2026; management must confirm the applicable domestic timetable rather than assume the international schedule controls its filing.
Give directors forward-looking measures
Assign treasury the liquidity inputs and finance the capital numerator, denominator, and framework election. Require reconciliation between projected assets and the denominator used in each regulatory calculation.
For interpretation, use a consistent reference for capital ratios for banks, but retain institution-specific applicability decisions internally. Set early-warning levels above legal triggers, with enough room for management to act before balance-sheet growth consumes the buffer.
How to Map Each Rule to Your Data
A regulatory inventory is useful only if staff can follow it into an actual record. Build the map around institution applicability, source-system lineage, accountable owners, and retrievable evidence.
The 2025 CSBS survey release reported that regulation fell from a top external risk in 2024 to sixth place in 2025. That change in executive sentiment doesn't remove the need to maintain controls or prepare filings.
Build a traceable operating register
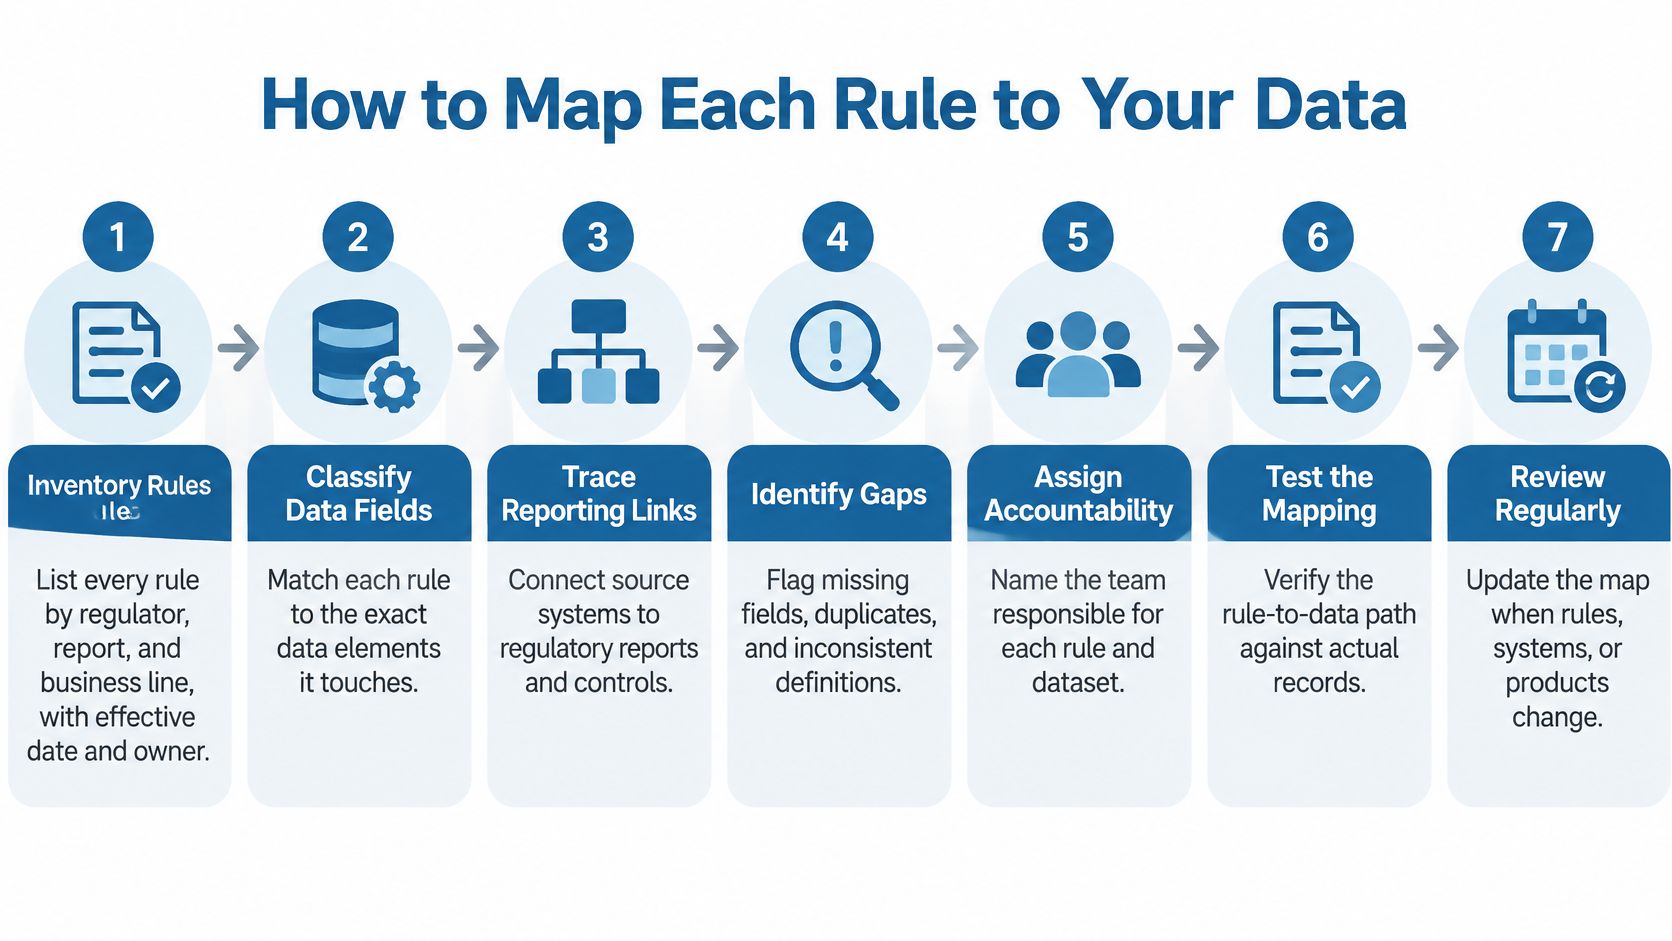
Inventory the requirements. List each rule by regulator, report, and business line, recording its effective date and transition period. Separate proposed changes from adopted obligations so staff don't implement an announcement as though it were binding.
Tag institution attributes. Attach asset size, charter, primary regulator, and products offered to each applicability decision. Preserve the reason for an exclusion, not just the conclusion that a requirement doesn't apply.
Connect the evidence fields. Identify the exact Call Report line item, ownership record, or mortgage-origination field that supports the requirement. Include source system, transformation logic, reporting definition, and reconciliation control.
Name an accountable owner. Assign an individual role, such as regulatory reporting controller or BSA officer, and specify the evidence an examiner would request. A department name alone doesn't establish who resolves an exception.
Define an observable trigger. Monitor the relevant ratio, ownership change, missing field, or approaching deadline rather than waiting for a filing-level pass or fail. Specify who receives the alert and who can close it.
Route judgment cases. Send trusts, indirect ownership chains, and control-person changes to documented review queues. Preserve the facts reviewed, the decision, and the rationale instead of overwriting the original record.
Retest after change. Review the map after quarterly filings and whenever a threshold, product, system, or legal structure changes. Test actual records through the reporting path, including rejected records and manual adjustments.
Choose architecture around evidence
Raw documents and standardized reporting tables serve different purposes. Ekipa's lake versus warehouse comparison offers useful context when deciding where to preserve source material and where to maintain controlled reporting datasets.
Don't treat an architecture decision as a substitute for field definitions. A well-organized warehouse can still contain an incorrectly defined regulatory measure.
Self-test: Give an independent reviewer five minutes to trace a requirement to its source field, responsible owner, and supporting evidence. If the path breaks, the map has a gap.
Beneficial Ownership and Due Diligence Data
Keep ownership identification, control identification, verification, and ongoing customer assessment distinct. Each needs different evidence and a different exception path.
Due diligence requirements and the data each one needs
| Requirement | Data Field Needed | Common Failure | Control Fix |
|---|---|---|---|
| Owners with 25% or more ownership | Name, date of birth, ownership percentage | Indirect owners missed | Deterministic threshold logic with an exception queue |
| Significant control person | Name, role, authority | Control change not recorded | Trigger review on officer changes |
| Identity verification | Verification method and date | Verification delayed past a reasonable period | Risk-based verification workflow |
| Customer risk profile | Purpose, products, geography | Static onboarding data | Refresh on relationship change |
| Record retention | Identifying information and certification | Records purged early | Retain five years after account closure |
The FFIEC beneficial-ownership examination procedures describe identifying every individual with 25% or more direct or indirect ownership, plus a significant control person even when nobody meets that ownership threshold; they also describe obtaining at least name and date of birth, risk-based identity verification within a reasonable period after opening, and retention for five years after account closure.
A corporate record needs a relationship history
A company shouldn't exist in portfolio analytics as a single undifferentiated customer record. Link the entity to owners, controlling individuals, accounts, verification events, and dated source documents.
The relationship manager should capture reported changes; the BSA function should determine their due diligence consequences. Technology should preserve previous relationships rather than replace them with the latest names.
For complex structures, Lighthouse Consultants' explanation of how to uncover hidden ownership structures provides context for investigating relationships that aren't apparent from a direct shareholder list.
Review the trust, not just the percentage
Suppose a manufacturing customer's majority owner transfers 30% of its shares to a family trust. That's a hypothetical event requiring review of both ownership and control, not an automatic instruction to classify the trustee as the company's control person.
The reviewer should examine the trust arrangement, relevant exceptions, indirect ownership, and who in fact directs the customer. Record the conclusion and supporting documents.
Automate clear threshold cases; preserve human judgment for ambiguous structures. A percentage calculation can identify a review candidate, but it can't replace a documented interpretation of the legal relationship.
What Compliance Costs Look Like by Bank Size
Safety-and-soundness practices accounted for 27% of compliance expenses, money-laundering standards 25%, and consumer-protection standards 23% in the 2025 CSBS survey of 268 community banks; the accompanying decade-long analysis found the smallest institutions devoted roughly 11%–15.5% of payroll to compliance versus 6%–10% at the largest community banks.
Those percentages describe where the money went. Directors should weigh them against the loss or control failure each expenditure is meant to prevent, because a large spending share and a large risk share are different questions.
Compliance expense share by category, 2025 survey
| Compliance Category | Share of Expenses |
|---|---|
| Safety and soundness | 27% |
| Money-laundering standards | 25% |
| Consumer-protection standards | 23% |
| Remaining categories | 25%, calculated as the balance |
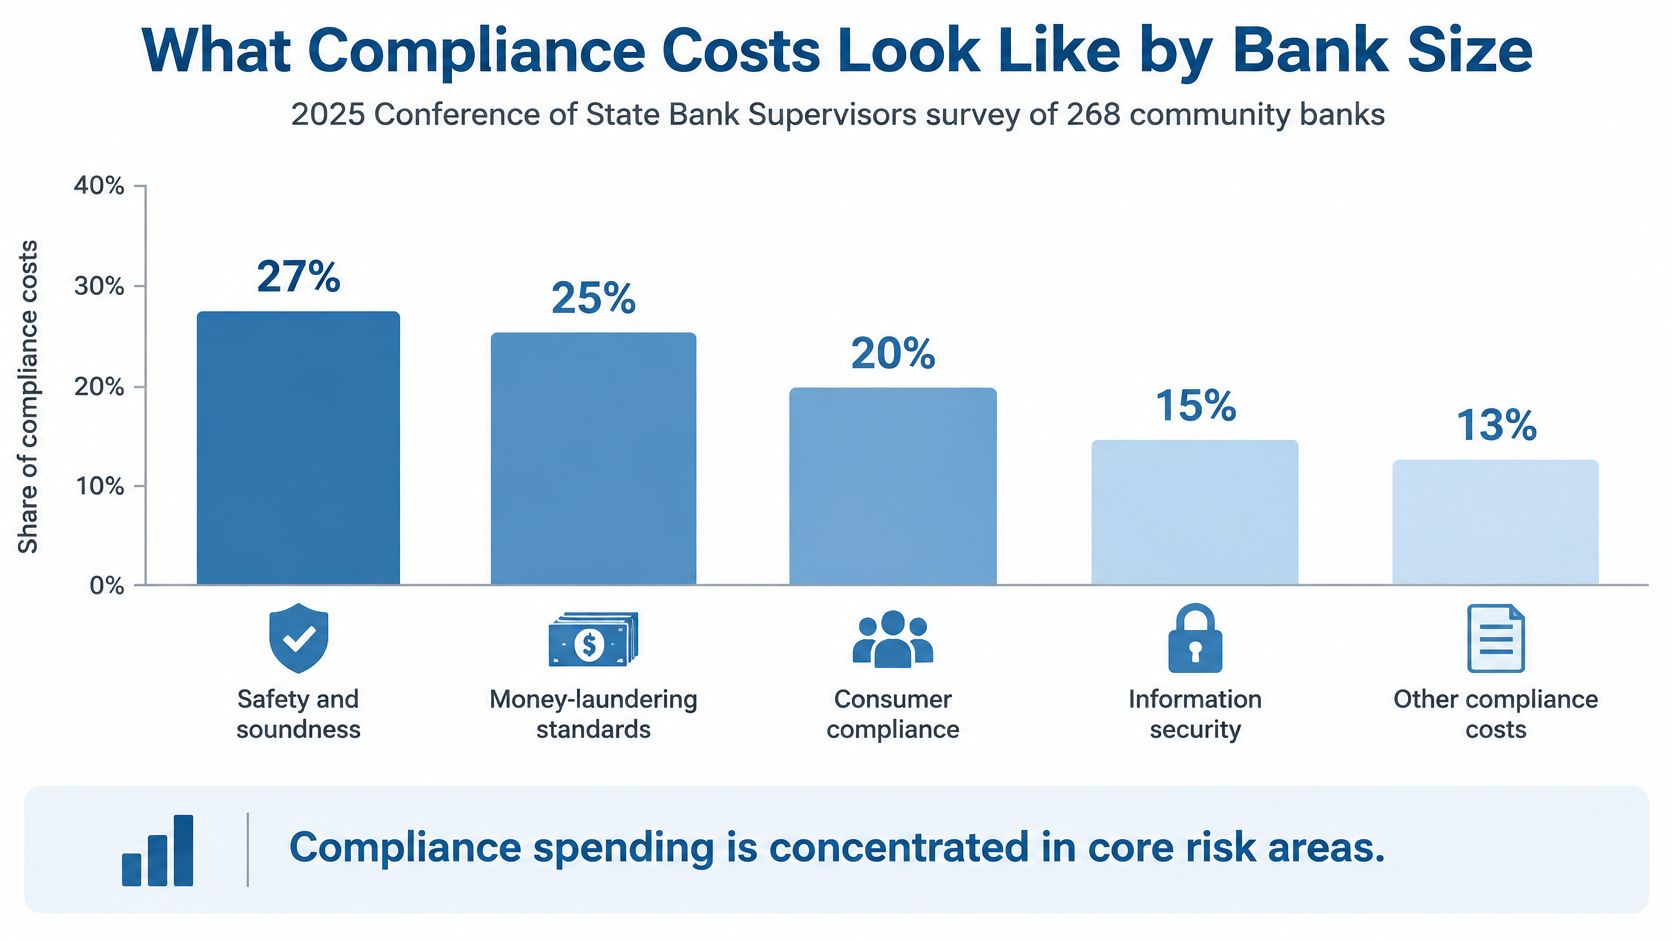
Three categories absorb 75% of the typical community bank's compliance budget. The sharper board question is which of them is growing fastest at your institution, and which owner can explain why.
Put the size effect into dollars
Consider a hypothetical $500 million bank with 60 employees, each earning an average $75,000. Salary payroll would be $4,500,000, excluding benefits and other employment costs.
Applying illustrative compliance allocations of 11% and 6% produces $495,000 and $270,000, respectively, a $225,000 annual difference. Treat the gap as a sensitivity result: it shows what the payroll mechanism does at small-bank versus large-bank intensity, and it says nothing about this particular bank's actual cost or the savings any automation project might recover.
Why does the same function absorb a larger share at a smaller institution? Compliance work has a fixed floor. Fixed staffing, data processing, accounting, and consulting work offer a practical starting point for investigating the gap. Ask which tasks persist regardless of transaction volume and which increase with customers or products.
Spend first where safety impact and manual effort are both high. Consolidate repetitive documentation work without weakening the underlying control.
The survey measures each bank's total compliance burden rather than the price of one identical rule applied at different institutions. Making that rule-level comparison requires internal time allocation and vendor expenses tagged to the same requirement and workflow. Give each tagged line three fields: the requirement it serves, the workflow it funds, and the accountable owner. A money-laundering line item, for example, might split across monitoring staff hours, investigation caseload, and screening vendor fees, each with a named owner. That mapping converts a payroll percentage into a cost model the board can interrogate.
Tracking Rule Changes Before They Reach the Board
An annual regulatory review is a planning convenience, not a reliable change-control schedule. Management needs to evaluate a threshold revision when it is adopted and when the bank's own position changes.
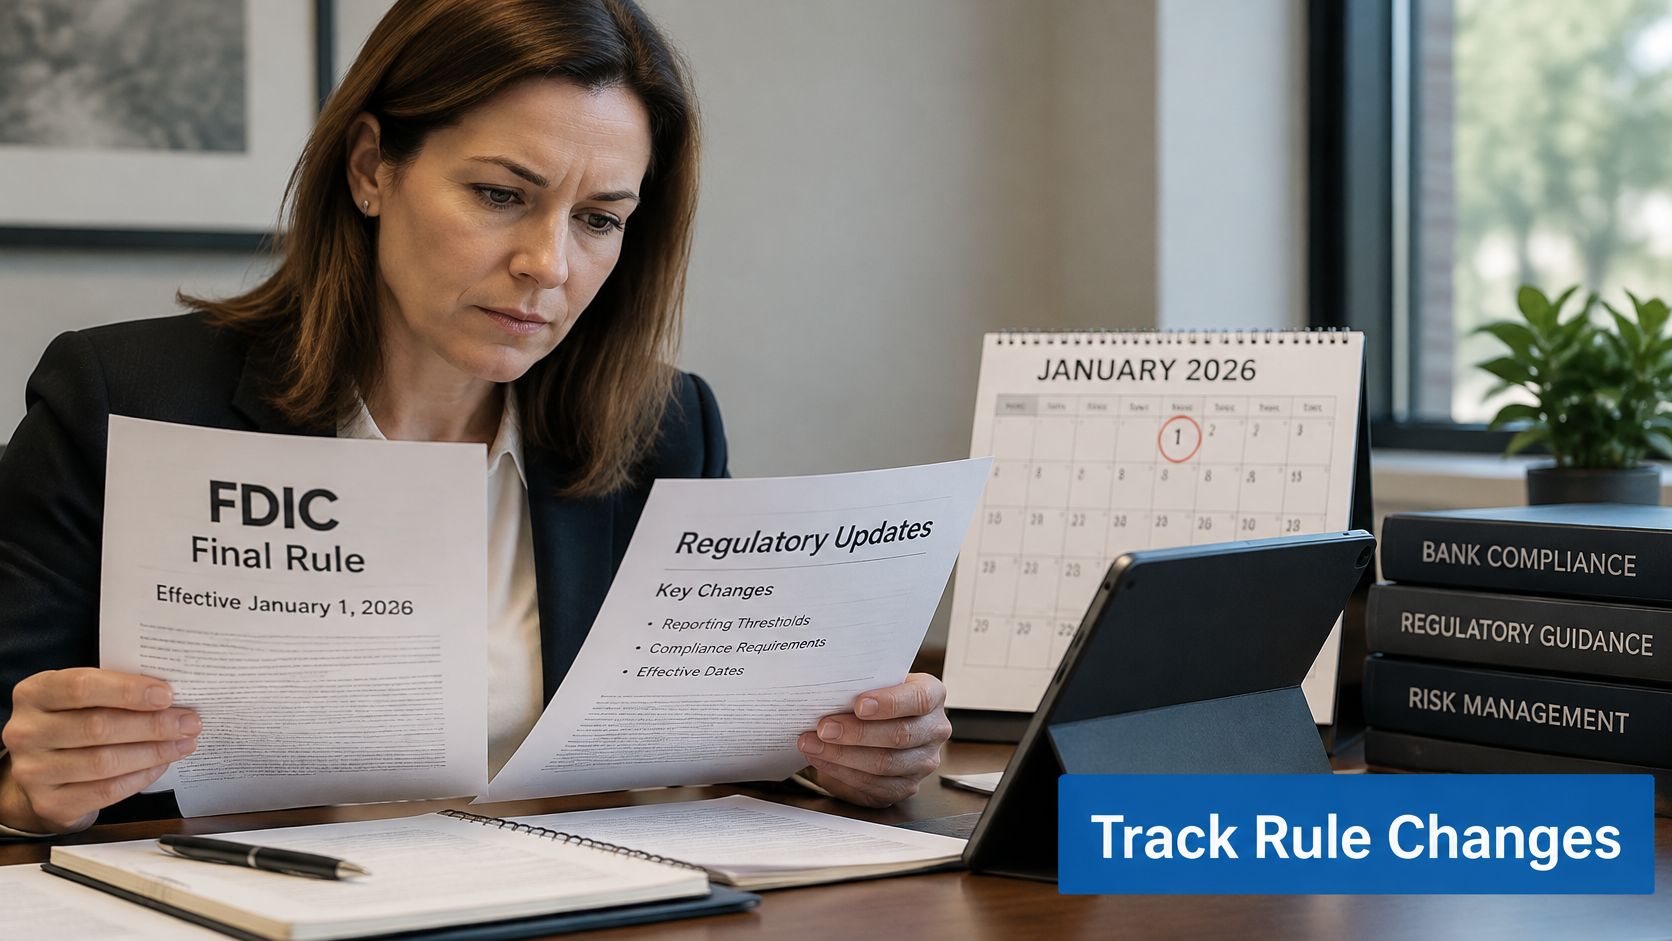
The FDIC final rule adjusting and indexing regulatory thresholds became effective January 1, 2026, generally provides updates every two years, and makes indexing adjustments effective October 1 of the applicable year; it includes thresholds under 12 CFR Part 363, with immediate relief for institutions no longer covered because of revised thresholds.
Record the decision, not just the announcement
Part 363 addresses annual independent audits, internal controls, audit committees, and related reporting. Finance and legal should document which obligations remain applicable before changing audit engagements or control activities.
Maintain a change log with these fields:
- Legal reference: Rule, threshold, effective date, and transition window.
- Institution impact: Affected institutions and affected data fields.
- Execution evidence: Owner, examiner evidence, and status.
A merger, asset growth, or organizational restructuring should reopen the applicability assessment even if the rule itself hasn't changed. For practical implementation, distinguish regulatory intelligence from a news feed: intelligence should end in an assigned decision and preserved evidence.
Use an internal proximity trigger
As a management rule of thumb, flag asset levels within 10% of an applicable threshold for quarterly review. That's a proposed internal control, not a regulatory requirement, and management should tighten it where growth or transaction activity warrants.
Directors gain a dated record of anticipation: what management knew, when it assessed the impact, and who authorized the response.
Benchmark Your Rule Exposure This Quarter
Confirm the institution's rule-to-data map, then benchmark the positions that could change a board decision. A peer comparison is useful only when management can explain the population, reporting period, and underlying measure.
Select the highest-weight obligations. Start with five rules that create the greatest operational consequences for your balance sheet, using capital, customer due diligence, audit coverage, mortgage reporting, and program lending as candidates. Check applicability, evidence completeness, unresolved exceptions, and the cost of maintaining each control.
Build a relevant peer group. The Federal Reserve's supervision and regulation report reported aggregate CET1 ratios of approximately 13% for both large and small banks at year-end 2025, while LCR-covered banks maintained liquidity above requirements. Compare institutions with similar size and structure, then examine commercial real-estate concentration, deposit behavior, and available liquidity rather than treating the aggregate as a safety certificate.
Set decision-linked alerts. Identify the movement that would change an approval, capital plan, or reporting obligation. Give each alert a response owner and escalation path, and distinguish a filing-based signal from a continuously measured internal control.
Keep the benchmark explainable
Visbanking pulls data directly from regulatory filings, including FDIC, NCUA, and FFIEC filings. Our sources include FDIC Call Reports, FFIEC and UBPR, NCUA 5300, SBA program data, multi-state UCC filings, SEC/EDGAR, BLS and BEA macro series, and HMDA.
Our threshold-based flags include a Major flag when CET1 falls below 6.5%, the Basel III well-capitalized floor. That signal is a prompt for investigation, not a substitute for the bank's complete regulatory-capital assessment.
Management should bring the board a short decision record: the affected requirement, the institution's position, the relevant peer comparison, and the proposed action. The useful outcome isn't another dashboard. It's a defensible decision about growth, capital, control investment, or remediation.
Visbanking combines regulatory-filing data, peer benchmarking, and threshold-based signals to help bank leaders evaluate regulatory exposure alongside performance. Visit Visbanking to benchmark your institution and explore the data behind your next capital, growth, or compliance decision.
Latest Articles

Brian's Banking Blog
Talent and Intelligence: A Guide for Bank Leaders
Brian's Banking Blog
8 Bank Lending Trends Reshaping Credit Strategy in 2026

Brian's Banking Blog
CRM for Credit Unions: A Practical Buyer's Guide

Brian's Banking Blog
Bank Benchmark Rate: How Banks Price and Compare
Brian's Banking Blog
Predictive Risk Analysis for Bank Decisions
Brian's Banking Blog