
Credit Risk Analytics Software: A Bank Buyer's Guide
Brian's Banking Blog
In 2023, the Federal Reserve's stress-test results covered 23 large banks and found they could absorb more than $540 billion in losses while continuing to lend to households and businesses. That figure is the right frame for buying credit risk analytics software. The platform is not a nicer chart. It is the system that turns ratings, loan files, and macro paths into reserves, capital, and limits a board can defend.
Headline model accuracy is the wrong buying test. A score can rank borrowers well and still fail when an examiner asks where a concentration came from, why a grade's default rate missed, or who changed a threshold. Judge the shortlist on whether the data and the explanation would survive supervisory review.
Why Credit Risk Analytics Software Now Reaches the Boardroom
In 2024, 75% of banks surveyed globally said they intended to increase investment in risk-technology infrastructure, and 64% planned to increase spending on third-party software, according to FT Longitude and SAS, who surveyed 300 senior banking risk leaders across 25 countries. Those budgets now sit with the board because the output feeds CECL reserves, stress-test capital paths, concentration limits, and the exam file.
The CRO, the CFO, and the audit committee each own a piece of that output. A reserve the CFO cannot segment, or a limit the CRO cannot trace, is a shared failure, not a vendor inconvenience.
Board test: If the platform cannot show who changed a threshold, and which source fed the number, it is not ready for a capital discussion.
Treat the category as platforms that aggregate institution and borrower data, estimate probability of default, loss given default, and exposure at default, run scenarios, and issue alerts with a full audit trail. Anything thinner is a report, not a control.
The cost of a weak choice is concrete. Reserves built on one blended loss rate hide the segment that is deteriorating. A concentration warning that arrives after the quarter closes is a governance failure. A slow dashboard is only an annoyance.
Score every shortlisted vendor in one week against the same script, then confirm the choice in a pilot before any contract is signed. The sequence is fixed:
- Scorecard first: Rate pass, conditional, or fail before any sales narrative.
- Then the hard tests: Lineage, model behavior, and integration, in that order.
- Then fit: Use cases, vendor type, and a 45-day pilot on identical data.
The Evaluation Scorecard to Apply Before Any Demo
Eight criteria. Three outcomes: pass, conditional, or fail. Rate them from a live demo, not a brochure. A model with strong discrimination can still fail on lineage, calibration, or explainability, and supervisors test all three. Accuracy on a slide is the claim that most often runs past what an exam file can support.
The scorecard works only when every vendor runs the same script on the same sample of 500 loans, including one planted data error the team already knows about. If the platform misses that error, aggregation fails, whatever the accuracy chart says. A separate buying question, how to choose a data enrichment tool, covers a different product category and does not stand in for those tests.
| Criterion | Test to run | Pass signal | Red flag |
|---|---|---|---|
| Data aggregation | Roll exposures across legal entities, segments, and regions | Totals reconcile to source within an agreed tolerance | Manual spreadsheet steps between source and report |
| Lineage | Trace one concentration alert to account, source file, and timestamp | Full path shown on screen | Lineage stops at the data warehouse |
| Explainability | Generate reason codes for five sample borrowers | Reasons are stable and match model features | Explanations are generic or unavailable |
| Calibration | Compare predicted and realized default rates by grade | Realized rates fall inside expected variability | Only AUC is reported |
| Stability monitoring | Run population stability on a recent quarter | Drift alerts configured by default | Drift reviewed only at annual model review |
| Integration | Push one alert to CRM and one dashboard | Native connectors for CRM and BI tools | Custom code needed for every connection |
| Audit trail | Change a threshold and review the log | Version, user, and timestamp recorded | Previous values overwritten |
| Scenario analysis | Run baseline and adverse scenarios on one portfolio | Results comparable by segment and vintage | Single blended output only |
How to read a split result
A conditional on integration is acceptable if the vendor commits the connector in writing, with a date and a named owner. A conditional on lineage is not. You cannot add an audit path later to a warehouse that stores only the last total.
Read the row, not the average. AUC without grade-level realized defaults does not show calibration. Generic reason codes do not show that explanations match model features. A blended scenario hides the segment and vintage an examiner will ask for. Drift left until the annual review means the quarter that moved is already closed.
Score a shortlist of three. Carry every fail into the procurement terms before you talk price. A pass on seven criteria and a fail on audit trail is still a fail for a board system.
Data Lineage and Aggregation Tests That Separate Platforms
Run four tests before anyone mentions a model score. The Basel Committee's BCBS 239 standard requires automated aggregation of material risk data across business lines, legal entities, asset classes, industries, and regions, lineage back to authoritative sources, and accurate figures in both normal and stress reporting. It also ties that aggregation to risk appetite, and it requires data that stay accurate, complete, adaptable, and timely.
A team that cannot show the path from filing to alert is not ready to trust the model on top of it.

- Source check. Compare the vendor's source list with yours: call reports, FFIEC and UBPR, NCUA 5300 where you cover credit unions, macro series, and HMDA. Each feed should be a direct pull, not a manual upload. At Visbanking we pull directly from regulatory filings, including FDIC, NCUA, and FFIEC, and the set also includes SBA PPP, 7(a), and 504, multi-state UCC filings, SEC and EDGAR, plus BLS and BEA macro series. A source that arrives as a spreadsheet fails.
- Reconciliation. Aggregate one concentration across two legal entities and tie the total to the general ledger within a written tolerance, such as 0.5%. On a large loan book that gap is millions of dollars, too wide for a board pack. A break outside tolerance is a fail, not a footnote.
- Trace. Pick one portfolio alert and follow it to the account, segment, source file, transformation, and reporting timestamp. If the path stops at the warehouse, the alert is not decision-grade. The same habit of checking whether a narrative matches the underlying record is what makes earnings call analysis for equity researchers useful, and it applies to risk memos too.
- Operating metrics. Record reconciliation breaks per cycle, refresh latency, failed-pipeline rate, and the share of reports with documented lineage. Each metric is pass or fail against a number you set before the demo.
A strong model score does not offset an untraceable input. Examiners test the inputs first. Run all four tests on every shortlisted platform and write down which one can show the full path from source to report.
Explainability Versus Predictive Lift in Model Tests
A challenger scorecard at a Gini of 0.42 against a complex model at 0.47 is a familiar demo result. That five-point lift is not a purchase case. A supervisory review will ask whether the probabilities stay calibrated and whether each adverse-action reason maps to a real feature. Ranking power alone answers neither question.
The European Banking Authority's discussion paper on machine learning for IRB models states the practical problem: institutions struggle to explain material gaps between realized default rates and the expected variability of probability-of-default estimates by rating grade. A more complex model can separate higher-risk borrowers from lower-risk ones and still leave those grade-level gaps hard to defend.
The test sequence
Ask for out-of-time and out-of-sample results, not only in-sample fit. Place the vendor model beside an interpretable logistic or scorecard challenger. Check calibration by risk grade. Test stability across geography, industry, product, and economic regime. Require a reason code on each adverse decision, with a feature definition a reviewer can reproduce.
A code that does not match a real model feature is not an explanation. Treat that match as the test in any discussion of explainable AI in banking.
If the complex model's calibration slope then drifts to 0.82 in the latest quarter, the move from 0.42 to 0.47 does not justify the pricing error. Take the transparent model, or require the vendor to fix calibration before purchase.
| Metric | What it tests | Reference point | Why the board cares |
|---|---|---|---|
| AUC or Gini | Ranking of higher- versus lower-risk borrowers | Gini equals 2 x AUC minus 1; request out-of-time results | Shows whether scores rank risk |
| Brier score | Accuracy of predicted default probabilities | Lower than the interpretable challenger | Shows whether probabilities are usable |
| Calibration slope | Match between predicted and realized defaults | Near 1.0, with grade-level gaps explained | Shows whether reserve and capital estimates hold |
| Population stability index | Shift in borrower mix from the development sample | Breach of the threshold in the model policy | Triggers recalibration decisions |
| Challenger comparison | Complex model against a logistic or scorecard baseline | Lift justifies the loss of transparency | Tests whether complexity pays |
The highest AUC is not the production benchmark. Sustained calibration, stable reason codes, and a fast alert when realized defaults leave the expected range are what relationship managers and directors can act on.
Log every override. An untracked override weakens the validation file, because the decision on the book no longer matches the decision in the model.
Integration and MLOps Requirements Your IT Team Will Test
A model that cannot leave the analytics environment will not change a credit decision. IT should test connections and ongoing control, not a slide of architecture.
Three connections, each demonstrated live:
- Core and loan extracts: The platform ingests the files your core and loan systems already produce, on the schedule those systems run.
- CRM: One alert lands in the relationship system with the borrower, the reason, and an owner. A native connector passes. Custom code for that single hop fails.
- BI tools you already use: Output should open in Power BI, Tableau, or Excel without a second data copy. If your team rebuilds the number in a spreadsheet, the integration failed.
MLOps, or the model will drift in silence:
- Version every feature and every model, and keep a feature store so two teams do not define the same ratio differently.
- Schedule retraining only on documented triggers, not on a vendor's quiet refresh.
- Turn on drift alerts and pipeline observability before go-live, not after the first miss.
- Name one owner who approves a model change, and write the rollback steps before the first release.
Failure test: In the test environment, remove one source file. Time how long the platform takes to flag the gap, and check whether downstream alerts are suppressed or wrongly issued. A silent alert on stale data is worse than no alert.
Price the first-year license, the integration effort, the data-engineering hours, and the validation staff time as separate lines. The license is rarely the number that decides the total.
Ask how production pipelines are built and monitored before you accept a connector roadmap. A practical walk-through of how to build data pipelines shows the questions your engineers should put on the scorecard: source ownership, refresh, failure handling, and an audit of each transform.
Use Cases Where the Right Software Changes the Outcome
Match capabilities to the decision, then refuse any platform that only answers the question in aggregate. The comparison below is the filter. The three worked cases show which single capability changes the call.
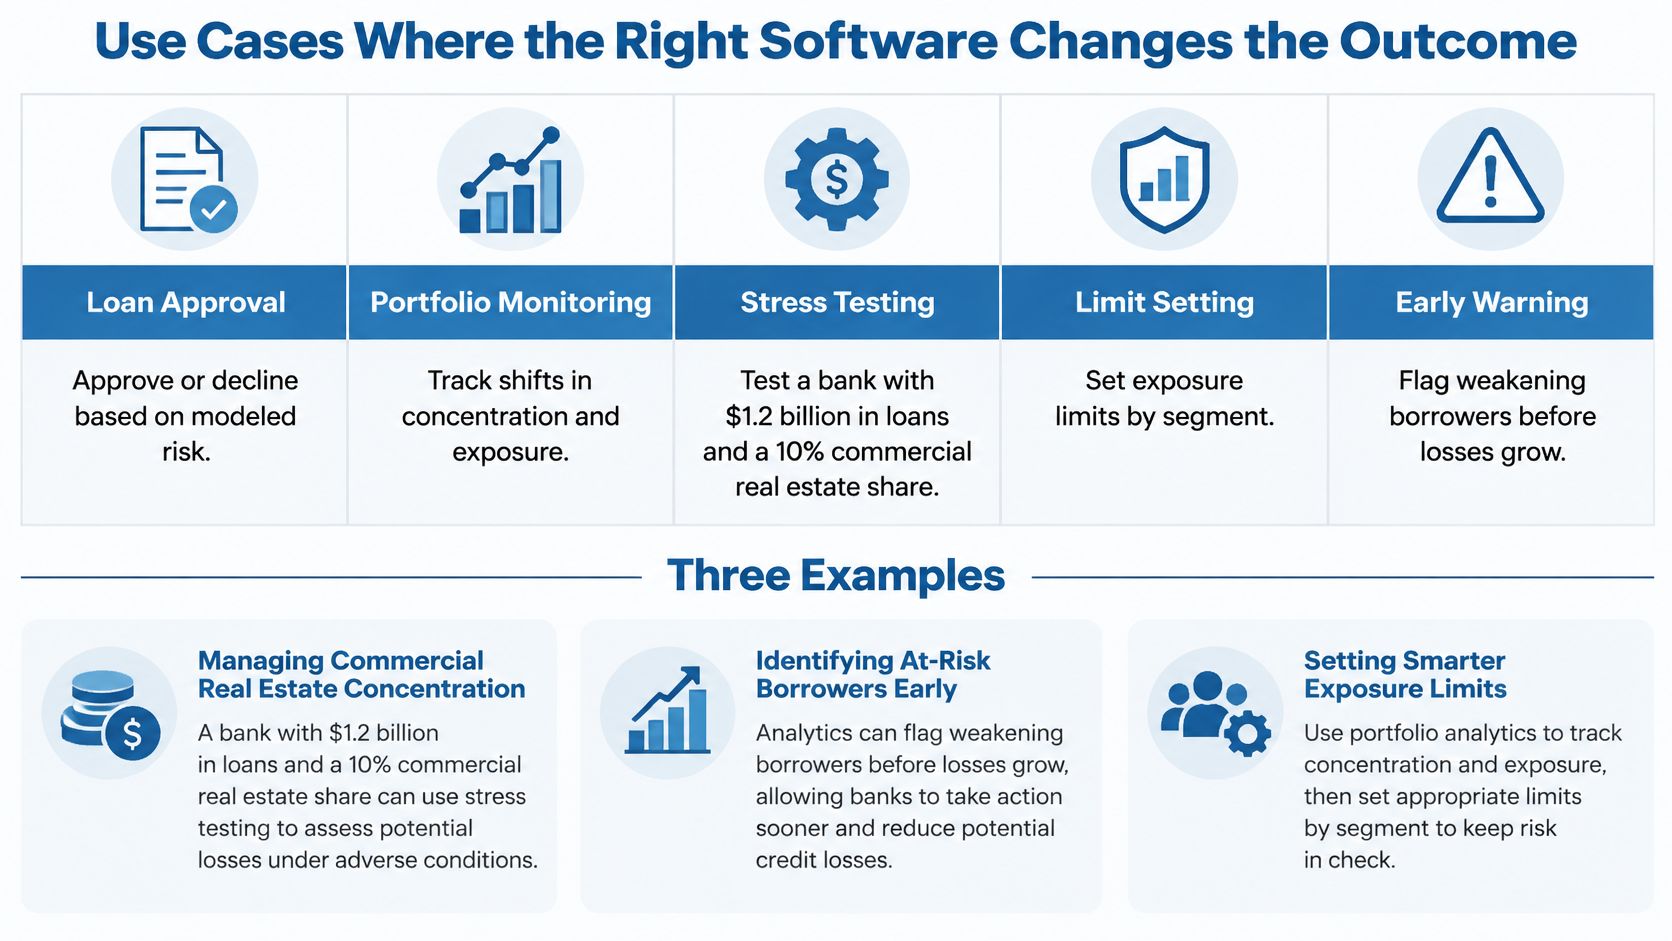
| Decision | Core question | Capabilities to require | Board output |
|---|---|---|---|
| Loan underwriting and pricing | Is this borrower priced for its risk? | Grade-level default probability with reason codes and override logging | Approval and pricing rules by grade |
| CECL allowance | How much loss must the portfolio reserve? | Loan-level history, segment loss rates, and macro scenarios | Reserve range by segment |
| Concentration monitoring | Are exposures approaching a board limit? | Aggregated exposures across entities with alerts before thresholds | Headroom against each limit |
| Stress testing | What happens to capital on an adverse path? | Scenario engine with segment loss rates and multi-quarter projections | Capital ratio paths by scenario |
| Early-warning monitoring | Which relationships are deteriorating now? | Nonaccrual, delinquency, grade migration, peer comparison, and alerts | Named watchlist with an action owner |
Stress testing. FDIC supervisory research describes community-bank stress work as applying stressed loss rates to the actual loan mix. Take a bank with $1.2 billion in loans and a 10% commercial real estate concentration, so $120 million sits in that segment. If segment losses move from 0.75% to 3.00%, that path adds $2.7 million of losses before recoveries, taxes, or capital actions. The software has to show that result by property type, geography, and vintage. One blended total does not tell directors where to slow growth. Predictive risk modeling is useful here only when the scenario stays tied to those segments.
Concentration monitoring. FDIC concentration guidance treats the risk as an enterprise measurement, not a loan-category ratio. Banks are expected to aggregate exposures across legal entities and by business line, region, industry, and consolidated total, including committed lines and related instruments, not loans alone. A board-approved 25% capital limit for one industry works only if direct loans, unfunded commitments, acquired portfolios, and related counterparties roll into one timely total, with the borrowers or regions driving the increase named, and with organic growth separated from purchased or reclassified exposure.
Early warning. FDIC supervisory material treats charge-offs, delinquency, nonaccrual, and restructured loans as a set, not a single ratio. Picture delinquency steady at 1.8% while nonaccrual commercial loans rise from 0.6% to 1.1%, with criticized loans clustering in one metropolitan office. A delinquency-only dashboard delays action. A joined view of grades, collateral, industry, and peers supports tighter underwriting or a pricing change. Our Bank Intelligence app, still in beta, provides early warnings, including bankruptcy probability and stress markers, and sends actionable alerts by email, Slack, or CRM.
The capability that changes the stress decision is the segment scenario. The capability that changes the limit decision is the cross-entity total before the threshold. The capability that changes the watchlist is the joined deterioration view, not the stable headline delinquency rate.
Vendor Types and Their Trade-offs
Choose the vendor type before the vendor. Four models dominate shortlists, and each trades reach against cost and control.
Enterprise risk suites cover credit, market, and operational risk, plus governance workflow. Implementations run long, and integration cost can exceed the license. They fit a bank that already has a program team and needs one control framework across risk types.
Specialist model-risk platforms go deep on IRB tooling, validation, and reason codes. Aggregation and regulatory reporting are often thinner, so you supply the pipelines. They fit a bank whose exam pressure sits on model documentation, not on building the data store.
Data-intelligence providers combine regulatory, financial, market, and macroeconomic data with peer benchmarks and early-warning alerts. They suit a team that needs signals without a large data-engineering staff. Model internals may be less open unless the contract requires access, export, and a validation pack.
In-house builds give full control of feature definitions and model code. You also carry MLOps, validation staffing, and examiner documentation. That trade is rational only when those teams already exist.
Weight the type against the decision that dominates your book. A lender whose largest exposure is commercial real estate concentration should rank concentration and stress capability first, whatever the category on the proposal. Write each trade-off on the scorecard so the contract reflects it, including data-export rights if you might leave.
Run a 45-Day Pilot Before You Sign
Do not sign on a demo. Run one sequence, on the same data, for every finalist, and finish it in 45 days.

- Shortlist three platforms that pass every scorecard criterion. A conditional on lineage does not enter the pilot.
- Hand each vendor the same 500 loans and the same concentration query, including the planted error.
- Score lineage, calibration, reason-code quality, and alert latency on one sheet so the comparison stays like for like.
- Require a validation pack an examiner could read: data sources, overrides, stability, and the scenario assumptions.
- Negotiate integration commitments, data-export rights, and exit terms in writing before price is treated as final.
- Sign only after the pilot confirms the results. A missed planted error or a silent stale-file alert ends the process.
A community bank with a small data team should favor ready regulatory-data pipelines and peer benchmarking. A mid-size lender with a concentrated commercial real estate book should weight concentration and stress capability highest. A large bank with in-house models should weight explainability and MLOps.
You can benchmark banks and credit unions side by side with a couple of clicks, and signing up for an account is free. Put your own ratios next to peers, then decide whether the platform you are about to buy would have surfaced the same gap.
Visbanking unifies regulatory, financial, market, and macroeconomic data so credit decisions, early-warning alerts, and peer benchmarks rest on traceable inputs rather than a single blended ratio. If you are judging credit risk analytics software on what would survive an exam, start by seeing how your bank compares. Visit Visbanking to benchmark your institution and explore the data behind the comparison.
Latest Articles
Brian's Banking Blog
Data Driven Partners for Banks: A Practical Guide
Brian's Banking Blog
Prospecting Rules for Banks: How to Build and Score Them
Brian's Banking Blog
Predictive Risk Intelligence for Banks: A Practical Guide
Brian's Banking Blog
Audit Trail in Banking: What It Is and Why It Matters
Brian's Banking Blog
Talent and Intelligence: A Guide for Bank Leaders
Brian's Banking Blog