
Predictive Risk Intelligence for Banks: A Practical Guide
Brian's Banking Blog
The usual advice on predictive risk intelligence is to collect more data and build a more accurate model. That's incomplete. A bank can improve a back-test score and still leave its executives unable to explain an alert, assign responsibility, or defend the resulting decision.
Data lineage and alert accountability are the more durable predictive edge. Directors should judge a forecasting capability by whether management can trace a warning to reliable evidence, distinguish deterioration from a reporting defect, and act within a defined control framework. Model sophistication matters, but it doesn't replace those disciplines.
Signal Map Behind Every Early-Warning Alert
Predictive risk intelligence combines bank, market, regulatory, and macroeconomic data into forecasts of stress, then routes each forecast to someone who can act on it. The forecast is only part of the capability. The source, refresh schedule, interpretation, and decision owner belong in the same operating design.
The FDIC's adoption of supervisory model-risk guidance defines a model broadly as a quantitative method, system, or approach that applies statistical, economic, financial, or mathematical theories and assumptions to inputs to produce quantitative estimates. A deposit-outflow alert or commercial real estate stress indicator can therefore require model-risk governance, not just a traditional credit score. The guidance calls for disciplined development, documented assumptions, implementation controls, independent validation, and appropriate use.
Match the source to the warning
The following signal map is an analytical design, not a promise of forecasting performance. Lead times are illustrative estimates, not benchmarks, and must be tested against the bank's own reporting cadence and observed outcomes.
Signal families, sources and what they flag
| Signal family | Example sources | What it flags | Illustrative lead time |
|---|---|---|---|
| Capital and earnings | FDIC call reports, FFIEC UBPR | Thinning capital buffers, falling net interest margin | 2-4 quarters |
| Asset quality | FDIC call reports, including past-due and charge-off data | Rising past-due loans, charge-off trends | 1-3 quarters |
| Lending concentration | HMDA, SBA program data | Potential overexposure to a sector or geography within covered lending | Before the next concentration-limit review |
| Borrower and collateral | UCC filings, SEC/EDGAR | Liens, filing changes, leverage shifts | 1-2 quarters |
| Macro conditions | BLS and BEA series | Unemployment and output pressure on borrowers | 2-4 quarters |
| Liquidity and deposits | Bank-provided deposit feeds | Outflows, funding concentration | Days to weeks |
NCUA 5300 data provides a corresponding starting point for credit union analysis. Keep population boundaries explicit: HMDA and SBA program records describe covered lending, not an institution's complete loan book. A UCC filing likewise warrants investigation, not an automatic conclusion that collateral protection has weakened.
External applications can help bankers think through source combinations. PropLab's explanation of how investors find deals with predictive data models offers a useful adjacent perspective on property-market screening. A bank should distinguish an investment opportunity signal from evidence sufficient for a credit or collateral decision.
Require a decision connection
For every signal, management should answer:
- Origin: Where does the observation come from, and can an analyst inspect the underlying record?
- Refresh: How often does it update, and what reporting lag remains?
- Decision: Which lending, funding, capital, or relationship decision changes when it crosses a threshold?
Practical rule: If nobody can identify the decision an alert changes, keep it out of the executive escalation queue.
Peer and historical comparisons make these questions testable. The useful output isn't an institution's worsening rank. It's evidence that the movement survives a comparison with relevant institutions and warrants a specific review.
Data Quality Sets the Ceiling on Every Forecast
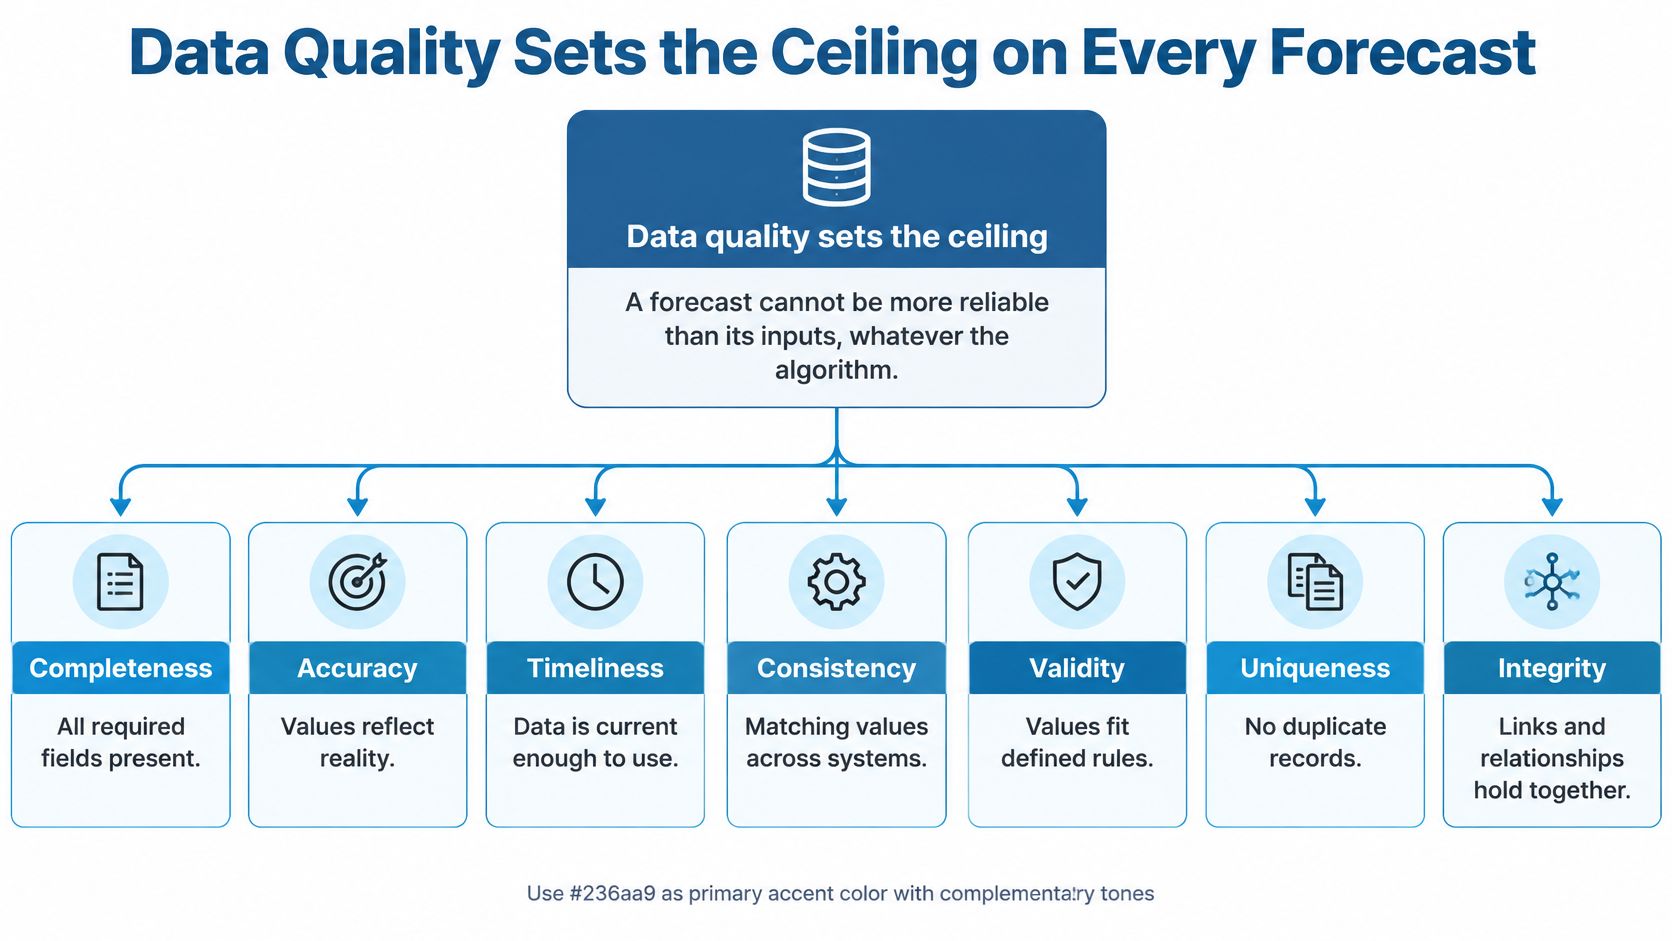
A forecast can't be more reliable than its inputs, whatever the algorithm. Adding sources without reconciling identifiers, definitions, and effective dates can produce more detailed errors rather than better foresight.
An FDIC-published response concerning financial-institution AI identifies seven data-quality characteristics: consistency, accuracy, completeness, auditability, validity, uniqueness, and timeliness, and warns about model drift as incoming data diverges from training conditions. In bank feeds, these mean matching definitions across systems, reconciling values to records, populating required fields, preserving traceable transformations, enforcing valid ranges, eliminating duplicates, and delivering usable information on time.
Put input health beside the forecast
Consider a hypothetical commercial-credit model with 8% of required financial fields missing and a feed arriving 10 days late. The score may look precise while describing an incomplete, outdated borrower position. The remaining warning signs below are proposed monitoring conditions, not measured results.
Data-health indicators to show beside every score
| Indicator | What it measures | Warning sign in the hypothetical |
|---|---|---|
| Completeness | Share of required financial fields populated | 8% of required fields missing |
| Update latency | Days from period end to feed arrival | Feed arriving 10 days late |
| Duplicate rate | Share of records repeated across sources | Rising after an entity-resolution change |
| Population shift | Change in borrower mix versus training data | Refinancing-sensitive borrowers rising as rates climb |
| Exception count | Records failing validation checks | Sustained rise across several periods |
A model trained under low-rate conditions may become less reliable as refinancing costs rise or collateral values fall, even without a code change. Management should distinguish that economic change from a broken feed before authorizing retraining.
Preserve comparability
For a small community bank, favor interpretable ratios and borrower-level evidence over thinly populated market signals. Preserve both original and restated call-report observations so analysts can reconstruct what was available when a decision occurred. Treat missing information as a potential warning only after ruling out submission schedules, coverage gaps, and ingestion failures.
Document extraction belongs under the same controls. Teams considering finance document automation with Matil should define reconciliation and exception checks before extracted values enter risk features. Data observability should expose failures rather than merely confirm that a pipeline ran.
At Visbanking, we unify public and proprietary sources into a consistent model with entity resolution, quality checks, and version control. Comparable definitions and appropriate peer groups help analysts avoid mistaking institutional scale or accounting changes for deterioration.
Operationalizing Alerts from Signal to Decision
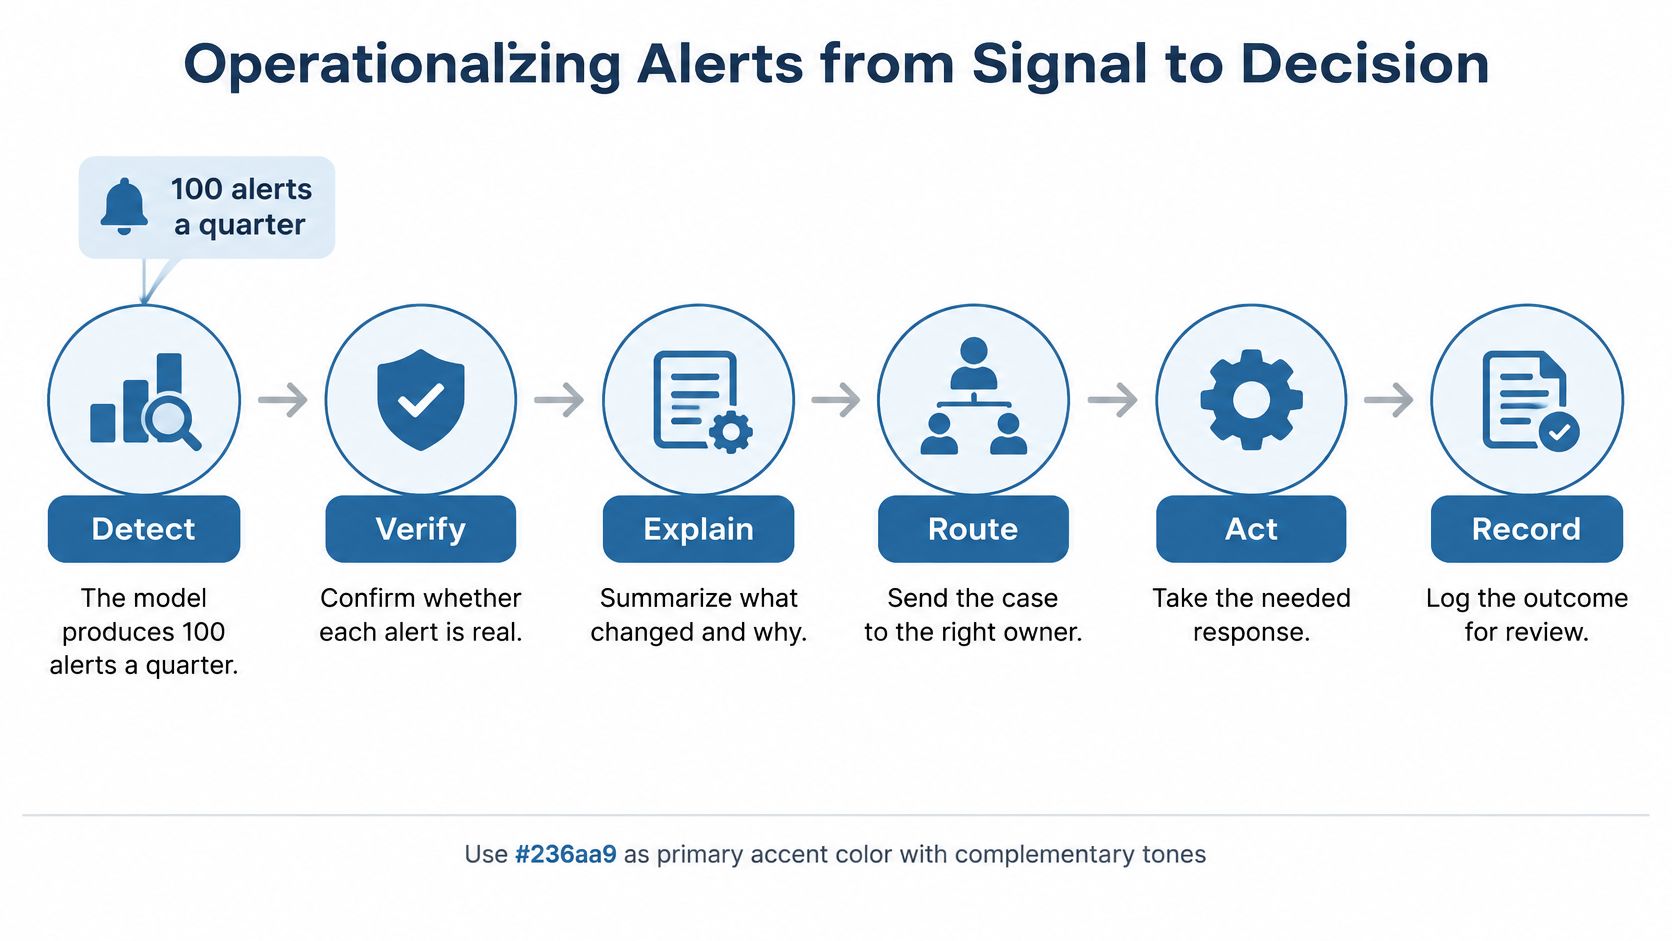
Consider a hypothetical deposit-risk model producing 100 alerts each quarter, with only 20 historically followed by material outflows. Its 20% precision may consume relationship managers' capacity without delivering enough useful cases. Add a feed failure that excludes 30% of new accounts, and apparently stable results become unreliable.
The FDIC's model-risk guidance recommends early-warning performance metrics soon after deployment, trend analysis, and ongoing monitoring. Management shouldn't wait for the annual validation cycle to discover that an alerting process has degraded.
Assign responsibility at every handoff
- Detect. The model owner operates the approved monitoring process and identifies the flagged segment or institution.
- Verify. Risk analytics checks input-health tolerances and confirms the observation isn't a processing artifact.
- Explain. The risk analyst prepares the principal drivers, peer comparison, uncertainty, and applicability limits.
- Route. The alert coordinator assigns the case according to confidence and financial materiality.
- Act. The designated executive or relationship manager completes the required review within the approved window.
- Record. The case owner logs the decision, any override, its rationale, and the later outcome.
Alert triage rules by confidence and materiality
These are proposed operating windows for a hypothetical bank, not regulatory deadlines.
| Alert profile | Required action | Owner | Response window |
|---|---|---|---|
| High confidence, high materiality | Escalate to the credit or ALCO committee with a driver summary | Chief risk officer | Within 2 business days |
| High confidence, low materiality | Relationship manager review and client check-in | Relationship manager | Within 10 business days |
| Low confidence, high materiality | Verify data health, then re-run drivers before any client action | Risk analytics | Within 2 business days |
| Low confidence, low materiality | Log and track the trend in the monthly review | Model owner | Next monthly cycle |
Measure usefulness, not activity
The model owner should own alert precision, escalating when it falls below the approved operating floor. Risk analytics should monitor the false-positive rate and forecast error, triggering investigation when either exceeds its approved tolerance. Data engineering should own completeness breaches; model risk should challenge population drift and determine whether restrictions are necessary.
Set those tolerances before deployment, using validation results, financial consequences, and reviewer capacity. Don't select a threshold just because it generates a manageable dashboard.
A sustained move supported by independent drivers deserves more attention than an isolated ratio spike. Persistence supports investigation, but it doesn't prove causation.
Overrides need the person's identity, rationale, supporting evidence, and subsequent outcome. Otherwise, management can't distinguish informed judgment from habitual dismissal.
Delivery responsibility also matters. Our end-to-end work at Visbanking includes source integration, production data pipelines, modeling, application development, and decision-ready analytics. Those handoffs must remain explicit because a forecasting defect and a routing failure require different remediation.
Early-Warning Monitoring in a Community Bank
The monitoring committee's question is straightforward: Is any exposure drifting toward stress before it appears in earnings? Consider a hypothetical community bank with $1.5 billion in assets and commercial real estate loans equal to 340% of total capital. For this example, directors have set an internal concentration-review trigger at 300%, not a finding that the bank has breached a universal regulatory limit.
The committee doesn't need a single institution-wide alarm. It needs a sequence of exposure-specific questions that determines where management should investigate.

Review the exposure in operating order
The following thresholds are hypothetical bank policies, not supervisory requirements.
- Past-due trend: Trigger a CRE segment review after two consecutive quarterly increases. The credit officer separates newly delinquent loans from persistent cases and checks whether the increase clusters around a property type or sponsor.
- Repricing exposure: Flag loans scheduled to reprice within 12 months when the affected share exceeds the bank's approved risk-appetite limit. Credit administration identifies borrowers lacking current cash-flow information before the committee considers exposure reductions.
- Deposit concentration: Review the 20 largest depositors when their combined balances reach 25% of total deposits. Treasury examines relationship links, withdrawal flexibility, and available replacement funding rather than assuming every large depositor presents the same risk.
Suppose the same hypothetical bank holds 40% of its loan book in one metropolitan area. A sustained decline in local employment should prompt review of the affected borrowers and collateral markets, not an automatic downgrade of the whole institution. Management should establish whether employers, tenants, guarantors, and depositors share the same local economic exposure.
Test contractual cash flows
Apply a hypothetical 200-basis-point rate increase to floating-rate borrowers. Payment caps can defer or redistribute the effect, so an aggregate repricing estimate won't identify every loan whose debt-service coverage falls below the bank's approved floor.
The credit team should calculate contractual payments at each repricing date, incorporate applicable caps, and compare stressed debt service with supportable borrower cash flow. The committee then receives a borrower-level exception list with proposed actions, such as updated financial reporting, covenant review, or a documented customer conversation.
The Federal Reserve's stress-testing framework combines institution-provided financial and risk information with macroeconomic scenarios to assess loss absorption and continued lending capacity. A community bank can apply that forward-looking logic without copying a large-bank supervisory exercise.
Committee takeaway: Run the scenario while management still has options, and assign each material exception before the borrower's repricing date.
Explainability Turns Scores into Decisions
A score without drivers isn't enough for a banker to act. It identifies a concern without establishing which question to ask, which exposure to examine, or whether the model applies to the institution under review.
BIS analysis of AI explainability describes Shapley values as a way to quantify each predictor's marginal contribution to an individual prediction. In plain language, the method allocates a prediction among its contributing inputs relative to a reference baseline. It explains model behavior, not proof that a particular input caused financial stress.
Read a worked alert
Consider an illustrative additive explanation expressed on a probability scale. These figures are hypothetical, not an observed institution's forecast.
| Component | Illustrative contribution |
|---|---|
| Reference baseline | 0.30 |
| Wholesale funding reliance | +0.12 |
| Falling loan yields | +0.08 |
| Stable capital ratio | -0.03 |
| Resulting risk estimate | 0.47 |
The calculation is useful only if the model defines the predicted event and horizon. A banker shouldn't interpret 0.47 as bankruptcy probability unless that is the model's validated target. Some explanation tools report contributions on a transformed scale, so the displayed arithmetic must match the model implementation.
In this example, the immediate follow-up concerns funding structure and earning-asset economics. Stable capital provides an offset; it doesn't eliminate the need to investigate funding pressure.
Make the explanation reviewable
An actionable alert card should include:
- Prediction context: The event, horizon, risk rank or probability, and calibration limitations.
- Driver evidence: Principal contributions, direction, recent movement, and relevant peer comparisons.
- Applicability limits: Confidence qualifications and an explicit warning when the institution falls outside the training population.
- Next intervention: A defined investigation, such as reviewing liquidity trends or requesting updated relationship intelligence.
Explanation methods can be inaccurate, unstable, or misleading, so validation must test whether the displayed explanation faithfully represents the model. Compare contribution patterns over time and investigate economically implausible changes, rather than accepting a plausible-looking narrative.
Operational explainable AI in banking requires reproducibility. Preserve the exact input snapshot, model version, reference population, and explanation displayed to the user. A later reviewer should be able to reconstruct the basis for the action, not generate a new explanation from revised information.
Governance Controls That Scale with Model Materiality
Governance should scale with materiality, not novelty. The FDIC's revised interagency model-risk guidance says the framework is expected to be most relevant to organizations with more than $30 billion in total assets, while generally not applying to institutions at or below that threshold without significant model-risk exposure.
That distinction isn't permission to use consequential alerts without controls. A smaller bank still needs documented definitions, ownership, testing, and exception review when an estimate influences a decision.
Deepen controls as consequences increase
Control depth by model materiality tier
The following cadences are a proposed governance design, not prescribed regulatory schedules.
| Materiality tier | Example use | Minimum controls | Review cadence |
|---|---|---|---|
| Low | Peer-benchmark alert in the board pack | Documented definitions, named owner, exception review | Annual |
| Moderate | Deposit-outflow alert routed to relationship managers | Independent challenge, drift monitoring, override log | Quarterly |
| High | Automated liquidity or credit limit triggers | Full validation, change control, vendor oversight, board reporting | Monthly monitoring, annual validation |
Every tier needs a defensible conceptual basis, source lineage, versioned feature definitions and parameters, and records connecting alerts to decisions. The BIS discussion of machine-learning risk models emphasizes sound development, validation, independent challenge, appropriate inputs, and ongoing performance assessment.
The MLOps layer should provide controlled feature stores, observability, rollback paths, and release approvals. Technical controls don't replace a pre-implementation assessment or second-line challenge. European banking supervisory guidance on AI governance emphasizes assessment, monitoring, escalation, remediation, and change management.
Preserve accountability across systems
Kagool's guide to enterprise AI risk provides broader enterprise context for coordinating these responsibilities. Banks should translate enterprise controls into explicit decision authorities within their model-risk management framework, especially when automated outputs affect limits or customer treatment.
The audit record should connect the data snapshot, model version, user, action, and outcome. Set retention according to applicable obligations and bank policy, with enough history to reconstruct an examination or board-review decision. Faster execution is defensible only when management can identify who authorized it and what evidence supported it.
Benchmark Your Early-Warning Signals This Quarter
Before the next board cycle, select a portfolio where earlier review could change a real decision. Commercial real estate and deposits are useful candidates because management can connect warnings to identifiable exposures, existing committees, and accountable owners.
Run a bounded pilot
As a proposed implementation plan, run a 30-day pilot with five to seven signals and a decision log covering the first 90 alerts, extending observation if that volume doesn't occur during the pilot. Assign an owner to every signal and approve acceptance criteria for precision, completeness, and response time before launch.
- Benchmark appropriately: Compare institutions with relevant business models, markets, and exposure mixes.
- Test decision value: Record whether each alert changed an investigation, customer conversation, or committee decision.
- Review rejected alerts: Distinguish incorrect forecasts from duplicate warnings, immaterial cases, and alerts management couldn't act on.
Don't treat the pilot as proof of long-term predictive performance. Use it to determine whether the evidence, routing, and reviewer workload justify broader deployment.
Visbanking's Bank Performance benchmarks profitability, risk, and efficiency across more than 4,600 institutions. BIAS combines FDIC, FFIEC/UBPR, NCUA 5300, SBA, UCC, SEC/EDGAR, BLS/BEA, and HMDA information with auditable lineage. The Bank Intelligence app, currently in beta, provides early warnings, including bankruptcy probability and stress markers, with actionable alerts through email, Slack, and CRM integration.
The decision is practical: authorize a bounded pilot with named owners and judge it by documented decisions, not dashboard activity.
Visbanking offers peer benchmarking, multi-source bank intelligence, and explainable early-warning analytics to support accountable risk decisions. Visit Visbanking to explore our data and benchmark your institution's signals as the starting point for a 30-day portfolio pilot.
Latest Articles
Brian's Banking Blog
Audit Trail in Banking: What It Is and Why It Matters

Brian's Banking Blog
Talent and Intelligence: A Guide for Bank Leaders
Brian's Banking Blog
Regulatory Rules for U.S. Banks: What Matters in 2026
Brian's Banking Blog
8 Bank Lending Trends Reshaping Credit Strategy in 2026

Brian's Banking Blog
CRM for Credit Unions: A Practical Buyer's Guide

Brian's Banking Blog