Statistics of Sales: Driving Decisive Action in Banking
Brian's Banking Blog
In a competitive market, intuition is a liability. The delta between market leaders and the rest is not optimism, but data. For banking executives, statistics of sales are not mere numbers; they are strategic assets that dictate profitability, market share, and risk exposure.
Why Sales Statistics Are a Banker's Most Critical Asset
For any bank executive, a command of sales data—from call reports to the commercial loan pipeline—is fundamental to sound governance. It is the only reliable way to navigate economic uncertainty and identify growth opportunities that competitors miss. However, reviewing raw loan origination or deposit growth numbers is insufficient. The real value is unlocked when that data is structured to answer critical strategic questions.
When sales statistics are leveraged correctly, leadership transitions from reacting to reports to making proactive, informed decisions. Consider this scenario: a community bank reports a 5% increase in new commercial accounts for the quarter. On the surface, this is a success. But a deeper analysis reveals that 80% of these new accounts hold minimal balances and have not adopted any other fee-generating services. The initial "win" is now correctly identified as a potential long-term drain on profitability.
From Data Points to Strategic Intelligence
This is the transition from abstract numbers to actionable intelligence. Bank leaders must demand more than dashboards; they require insights that drive measurable outcomes.
Consider the practical applications:
- Market Positioning: Analyzing loan origination data by industry (NAICS code) and geography reveals precisely where a competitor is eroding market share. This provides a clear roadmap for a targeted, strategic response.
- Profitability Analysis: Move beyond loan volume. Compare the Net Interest Margin (NIM) on new loans against the existing portfolio. This immediately identifies which relationship managers are driving the most profitable business, not just the largest transactions.
- Risk Foresight: A consistent decline in new business from a specific commercial sector is a critical leading indicator. It often signals emerging credit risk within that portfolio long before delinquencies appear on reports.
The objective is to transform sales data from a historical record into a predictive tool. It is about understanding not just what happened, but why it happened—and what is likely to happen next.
Executing this is impossible with disparate spreadsheets and siloed CRMs. A single, unified view of performance is required. This is precisely what Visbanking's intelligence platform is engineered to provide. We consolidate scattered data sources—FDIC, UCC, SBA—into a clear, coherent picture.
By benchmarking your bank’s performance against peers, you can identify tangible opportunities and equip your team to act decisively. Explore our data to see your true market standing.
The Four Pillars of Bank Sales Intelligence
To convert raw numbers into strategic assets, a coherent framework is necessary. Simply observing the statistics of sales is not enough. An effective analysis is built on four distinct yet interconnected pillars that provide a comprehensive view of your institution’s performance. This structure enables you to move beyond superficial metrics, diagnose weaknesses, and capitalize on strengths with precision.
Each pillar represents a critical component of your bank's growth engine. Monitored in concert, they create a powerful feedback loop, ensuring that daily sales activities directly support high-level strategic objectives, such as expanding market share and securing sustained profitability.
Pillar 1: New Business Acquisition
New client acquisition is the most visible indicator of growth. However, counting new accounts is a dangerously incomplete metric. True intelligence is derived from analyzing the quality and cost of new business.
A bank might celebrate opening 500 new commercial accounts in a quarter. But if analysis reveals a Customer Acquisition Cost (CAC) of $3,500 per account against an average initial deposit of only $5,000, the strategy is flawed. This is not a win; it is an inefficient allocation of capital to attract low-value clients. The crucial discipline is to track the profitability of every New-to-Bank (NTB) relationship from inception, not merely the volume.
The chart below illustrates how strategic assets, built from this granular data, form the foundation for profitability, market position, and risk foresight.
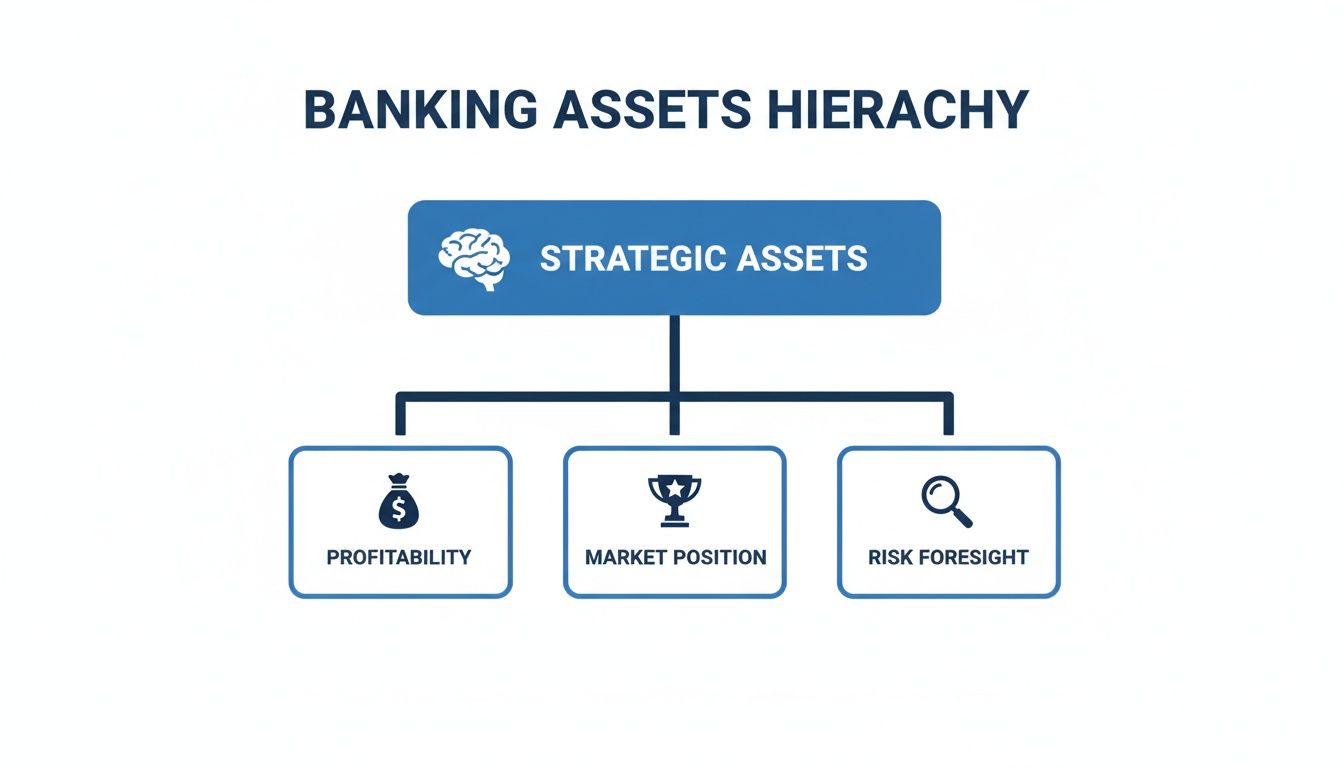
As shown, high-level outcomes are not accidental. They are built upon a solid foundation of detailed, pillar-specific intelligence.
Pillar 2: Existing Client Deepening
It is axiomatically more expensive to acquire a new customer than to expand an existing relationship. This pillar focuses on maximizing the value of your current client base. Key metrics here include cross-sell ratio and share-of-wallet.
For example, a relationship manager may oversee a portfolio of 100 commercial clients. If only 20% of them utilize your treasury management services—while the bank-wide average is 45%—that is a significant performance gap. This single statistic identifies a clear revenue opportunity and a necessary coaching intervention, transforming routine data into a concrete action plan.
Pillar 3: Relationship Manager and Branch Performance
This pillar measures operational execution. To assess it correctly, you must move beyond lagging indicators like total loan volume and focus on leading indicators that predict success. These include pipeline conversion rates, call effectiveness, and proposal success rates that provide a forward-looking view.
A top-performing RM may have a 40% lower call volume than their peers but boast a 75% higher proposal-to-close ratio. This insight is invaluable. It demonstrates that effectiveness, not sheer activity, drives results—a lesson that can be institutionalized through training.
Pillar 4: Product Portfolio Profitability
Finally, it is essential to know which products are generating profit. A high-volume mortgage product may appear to be a top performer. However, after accounting for origination costs and a compressed Net Interest Margin (NIM), it could be significantly less profitable than a smaller portfolio of commercial lines of credit.
Analyzing profitability by product—and by officer—ensures that sales incentives are aligned with bottom-line results, not just volume. For a more comprehensive understanding of achieving this clarity, it is worth exploring the capabilities of a modern banking sales intelligence platform.
The following table summarizes the essential KPIs across these four pillars, serving as a framework for building a data-driven sales strategy.
Essential Sales Statistics for Banking Executives
| Pillar | Key Metric (KPI) | Strategic Importance (What It Tells You) | Example Data Source |
|---|---|---|---|
| New Business Acquisition | Customer Acquisition Cost (CAC) vs. Lifetime Value (LTV) | Are you investing capital to attract profitable, long-term clients or chasing costly, low-value accounts? | CRM, Core Banking System, Marketing Expense Reports |
| Existing Client Deepening | Products Per Household/Business (Cross-Sell Ratio) | How effective are your RMs at expanding relationships and increasing share-of-wallet with current clients? | Core Banking System, Customer Relationship Data |
| RM & Branch Performance | Pipeline Conversion Rate (Lead-to-Close %) | Does your team's activity generate tangible results? This metric measures sales effectiveness, not just effort. | CRM, Sales Funnel Data |
| Product Portfolio Profitability | Net Interest Margin (NIM) by Product | Which products are true profit drivers for the bank, and which are merely generating volume? | General Ledger, Loan Origination System |
By consistently tracking these metrics, you shift from conjecture to genuine insight, empowering your teams to make smarter decisions that directly impact financial performance.
Benchmarking Performance Against the Market
Internal sales data is critical, but analyzing it in a vacuum creates a dangerous strategic blind spot.
Knowing your loan origination grew by 5% is one data point. Knowing the regional market grew by 10% in the same period provides the necessary context. The 5% growth is no longer a success; it is an indicator of market share erosion. Without external benchmarks, your bank is operating without a complete picture, unable to discern genuine outperformance from simply riding a market updraft.
True strategic insight comes from contextualizing performance. A market-level view is required to answer key questions: Are we keeping pace with peers? Where are competitors gaining an advantage? What untapped potential exists? This is how raw data becomes a competitive yardstick.
The Scale of the Global Opportunity
Consider the global retail banking market. It expanded from $1,703.91 billion in 2021 and is projected to reach $2,175.6 billion by the end of 2025. This represents a compound annual growth rate (CAGR) of approximately 6.3% expected through 2033.

Regionally, Asia Pacific leads with a 36.70% market share, followed by North America at 26.80%. In the U.S. alone, consumer banking sales are projected to reach $1.28 trillion in 2025.
These high-level statistics of sales establish a baseline. If your institution is not meeting or exceeding these growth rates, it is losing ground. This realization is the first step toward building a proactive growth strategy.
From Macro Data to Micro-Level Action
Broad market figures are only valuable if you can measure your own performance against them with precision. This is where modern intelligence tools are indispensable. A platform like Visbanking’s Bank Performance module, which aggregates clean, reliable data from over 4,600 institutions, cuts through market noise to deliver clear, actionable signals.
You can instantly compare your loan portfolio's growth in specific NAICS codes against the top five competitors in your primary county. This transforms benchmarking from an annual strategic exercise into a quarterly tactical weapon.
To gain a true competitive advantage, understanding what the latest competitor AI analysis tools can reveal provides critical insights into market positioning. The goal is to create a dynamic, real-time view of your competitive standing. By using comprehensive performance measurement systems, you can pinpoint the exact product lines or geographic areas where peers are advancing, understand why, and deploy resources to close the gap with confidence.
Four Actionable Strategies Driven by Sales Data
Theory and market analysis are prerequisites, but execution drives returns. The value of robust statistics of sales is realized when they are converted into specific, actionable strategies that improve bottom-line performance. For banking executives, this means moving beyond passive dashboards to equip teams with data-driven directives.
A unified intelligence system, like Visbanking's BIAS, serves as the engine for these strategies. It integrates disparate data sources—FDIC call reports, UCC filings, SBA loan data—and transforms raw numbers into a clear roadmap for growth.

Here are four concrete strategies your institution can implement today.
1. Precision Prospecting
Traditional prospecting is notoriously inefficient. Precision prospecting reverses this by using market data to identify high-potential commercial clients before initial contact is made.
Assume the objective is to grow your C&I loan portfolio. By analyzing UCC filing data, you can identify local manufacturing companies that recently secured equipment financing from a competitor. This is a strong signal of capital investment and future credit needs. A tool like Visbanking’s Prospect surfaces these opportunities, transforming a cold call into a timely, well-informed business conversation.
2. Proactive Cross-Selling
Your greatest growth opportunities often reside within your existing client base. Proactive cross-selling involves using internal data to uncover unmet needs, thereby deepening client relationships and increasing share-of-wallet.
Imagine a commercial client maintains a $1.5 million average daily balance in a non-interest-bearing checking account. This is a clear indicator of excess liquidity, making them an ideal candidate for treasury management or investment services. Instead of waiting for an inquiry, data analytics flags this for the relationship manager, who can then present a compelling proposal that delivers tangible value. The RM transitions from a service provider to a strategic financial partner.
The objective is to shift from reactive order-taking to proactive advisory. Data intelligence enables your team to anticipate client needs, solidifying loyalty and capturing revenue that might otherwise go to a competitor.
3. Performance Optimization
Managing a sales team solely on loan volume is like coaching a football team by only looking at the final score. Effective performance optimization requires analyzing the leading indicators—the specific behaviors that produce results.
An RM-level dashboard might show one officer with a 70% proposal-to-close rate, while another struggles at 25% despite similar activity levels. Deeper analysis might reveal the top performer excels at structuring deals for a particular industry. This insight is actionable. That success can now be replicated through targeted training, transforming performance management into a scalable coaching strategy.
4. Early Risk Detection
Sales statistics are not only for pursuing growth; they are also a powerful early-warning system for credit risk. Negative sales trends in a specific loan portfolio or geographic area often signal economic distress long before delinquencies materialize.
For instance, a sharp decline in new loan applications from local restaurants could be a leading indicator of sector-wide financial strain. By monitoring these trends, your bank can proactively review its exposure, adjust underwriting criteria, and mitigate potential losses. This is non-negotiable in a market where North America’s retail banking sector is projected to reach $1.62 trillion in 2025 revenues. The figure highlights both the massive opportunity and the scale of the risk that must be managed. More can be learned from Fortune Business Insights' report on global retail banking trends.
By integrating these data-driven strategies into your daily operations, you cultivate a culture of intelligent, accountable action. Explore Visbanking's data tools to see how to put these insights to work.
Common Pitfalls in Sales Data Interpretation
Good data is the bedrock of sound strategy, but it can be misinterpreted. Even meticulously tracked statistics of sales can lead to flawed conclusions if common analytical traps are not avoided.
The most prevalent error is confusing correlation with causation. Suppose your bank launches a new digital marketing campaign for commercial loans, and the following quarter, originations increase by 10%. It is tempting to attribute the growth directly to the campaign.
However, a more rigorous analysis is required. What if a major competitor in your market simultaneously tightened its credit standards? A significant number of qualified borrowers would have been redirected to your institution. In this case, the campaign correlated with the growth but did not cause it.
The Danger of Averages
Relying on averages is another path to misinterpretation. Averages provide a clean summary but can obscure critical underlying trends.
Consider a bank celebrating an increase in its cross-sell ratio from 2.1 to 2.3 products per household. This appears positive. However, a granular breakdown might reveal that a key metropolitan market actually declined from 2.8 to 2.2, while a smaller, less strategic region experienced a significant spike that skewed the overall average.
Without the ability to segment data, you risk celebrating a headline number while a crucial market is underperforming. This is where advanced intelligence tools prove their worth—they enable granular analysis by region, branch, or individual lender.
Garbage In, Garbage Out
The most fundamental pitfall is poor data quality. The axiom "garbage in, garbage out" remains undefeated. The sophistication of your analysis is irrelevant if the underlying data is flawed.
A CRM populated with duplicate entries, outdated contact information, or inconsistently coded products undermines any strategic initiative.
- Inaccurate Pipeline: A sales pipeline containing dormant deals that have not been updated in months leads to unreliable revenue forecasts.
- Flawed Customer Profiles: An incorrect industry classification (NAICS code) for a commercial client renders any cross-sell analysis or market share calculation invalid.
The only defense against these risks is a single, reliable source of truth. A platform like Visbanking's BIAS, which consolidates and standardizes data from FDIC call reports to UCC filings, ensures you are operating with clean, contextualized intelligence.
Do not just review the numbers—understand the story behind them. Benchmark your bank’s performance against the market to see the complete picture.
Moving from Dashboards to Decisive Action
Mastering the key statistics of sales is a critical first step, but true value is created when you move beyond observation to action. The future of banking is not in historical reporting; it is in using data to anticipate what comes next.
It is time to stop analyzing last quarter's performance and start using data to navigate the road ahead.
This is where a unified intelligence system becomes a strategic imperative. It integrates all relevant data—from FDIC call reports to local UCC filings—into a single command center. This is no longer a luxury; it is the engine of a modern, high-performance banking operation.
The Shift to Proactive Intelligence
Consider two banks. Bank A's leadership team analyzes a dashboard showing a 5% decline in new commercial deposits. They schedule a series of meetings to diagnose the cause.
Meanwhile, Bank B receives an automated alert from its intelligence platform, which identified leading indicators—such as a dip in local business filings—that predicted the downturn. Their team is already engaging at-risk clients before Bank A has even scheduled its first meeting.
This is the critical distinction: reacting to what has happened versus acting on what is about to happen. You can either analyze history or shape it.
This proactive posture fundamentally changes sales management. Guesswork is eliminated. You can pinpoint which customers are prime for a cross-sell conversation, which relationship managers require coaching, and which markets hold the greatest potential for growth.
To see what this looks like in practice, review these financial dashboard examples to understand the power of this approach.
The ultimate goal is simple: equip your teams with the tools to not just interpret data, but to act on it with speed and confidence. That is how you drive sustainable, measurable growth.
It is time to elevate your institution's performance. The team at Visbanking provides the intelligence system to help you move from dashboards to decisive action. Explore how to benchmark your bank and unlock predictive insights at https://www.visbanking.com.
Related Articles

Visbanking Blog
Sales Is Service.

Visbanking Blog
It’s much easier to eat someone’s lunch than it is to steal their entire business.

Visbanking Blog
Get Ahead of the Curve with BIAS, the Proactive Market Analysis Solution

Visbanking Blog
Banking Data Analytics: Turning Information Into Profit

Visbanking Blog
Ever wonder how companies sell for 10X Book Value?

Visbanking Blog