How to Improve Customer Satisfaction: A Data-Driven Mandate for Bank Executives
Brian's Banking Blog
To genuinely improve customer satisfaction, executives must stop reviewing surface-level metrics and start interrogating the data that drives real loyalty. It is no longer about simple satisfaction scores. It is about deploying sharp, competitive data to understand why customers stay, why they leave, and what transforms them into advocates for your institution.
The competitive landscape has shifted. The mandate is to earn and retain business for the long term through intelligent, data-backed actions.
Moving Beyond Satisfaction to Secure Loyalty

Familiar customer satisfaction scores are dangerously misleading. Stable ratings can lull leadership into a false sense of security while deeper issues like eroding trust and advocacy quietly undermine the balance sheet. These are the metrics that actually predict churn and profitability.
The critical question for every banking executive is not "Are our customers satisfied?" but "Are we executing the necessary actions to earn their business daily in an increasingly competitive market?"
Modern customers expect proactive, personalized experiences that demonstrate a genuine understanding of their financial journey. Delivering this requires a strategy built on solid competitive intelligence, not institutional guesswork.
The Satisfaction and Loyalty Disconnect
Relying solely on internal surveys is akin to navigating with one eye closed. It misses essential market context.
Global research consistently reveals a significant gap between customers who report being "satisfied" and those who are truly loyal. While overall satisfaction numbers may appear stable, critical loyalty indicators—such as trust and advocacy—are declining in many sectors.
A customer may be satisfied with a single transaction but feel zero institutional allegiance, making them a prime target for acquisition by a competitor. Read more about these loyalty trends here: https://visbanking.com/customer-experience-in-banking-industry
The hard truth is this: a seamless transaction is now merely the price of entry. A durable competitive advantage is built on relationships that can withstand the aggressive product and pricing offers from competitors.
A Data-Driven Mandate for Executives
To elevate the customer experience in banking, leadership must transition from decisions based on institutional assumptions to those driven by hard data. Instead of reacting to a vocal minority of complaints, a data-first approach enables surgical precision.
- Diagnose the Real Problems: Pinpoint the exact friction points—whether in digital onboarding flows or call center scripts—that are quietly destroying loyalty.
- Benchmark Your Position: Gain an objective view of how your products, fees, and service levels compare to the banks and credit unions competing for the same customers.
- Invest Where It Counts: Cease funding broad, low-impact initiatives. Instead, direct capital to fixes that address measurable competitive gaps and will demonstrably impact retention and growth.
The most effective path to improving customer satisfaction is not a massive, expensive overhaul. It is a series of precise, data-informed moves that systematically remove friction and deliver value where it matters most to them.
This is where a tool like Visbanking becomes indispensable. It provides the granular, comparative analytics required to transform vague feedback into a concrete action plan. By benchmarking performance against a curated peer group, you can identify where you are lagging and, critically, where opportunities exist to gain a competitive advantage.
Pinpointing Performance Gaps with Precision Data
Before allocating a single dollar toward improving customer satisfaction, you must know what is actually broken. Lasting improvements are built on cold, hard data—not on anecdotes from branch managers or assumptions about customer desires.
The objective is to stop reacting to customer complaints and start methodically identifying the friction points costing you business.
From Internal Hunches to Data-Driven Diagnosis
Every executive has a hypothesis about where their bank is falling short. The key is to prove—or disprove—those hypotheses with numbers.
Internal data provides the starting point, revealing high call volumes, low digital adoption, or high transaction failure rates. But this information exists in a vacuum without external context.
For instance, your call center might log 500 calls per month from customers encountering mobile deposit limits. This is a signal, but its severity is unknown. Is this an industry-wide issue, or is it unique to your institution?
This is where comparative analytics provides a decisive advantage. Benchmarking your policies against a relevant peer group transforms an internal statistic into a powerful competitive insight.
A platform like Visbanking can reveal that your mobile deposit limit is 25% more restrictive than the average of ten peer institutions. Suddenly, those 500 monthly calls are not just an operational headache. They represent a clear performance gap that is likely driving customers to competitors.
Key Diagnostic Areas for Analysis
To gain a complete picture, you must focus on the core components of the banking experience. These are the make-or-break moments that define customer perception.
Digital Channel Usability: Analyze application abandonment rates for new accounts and loans. If your abandonment rate is 15% higher than your peer average, you have identified a severe, high-priority problem. A cumbersome digital process is a direct impediment to growth.
Fee Structures and Transparency: How do your overdraft fees, monthly maintenance charges, and wire costs compare? A seemingly minor difference, such as a fee that is just $5.00 higher than your top three competitors, can create significant negative sentiment over time.
Service Consistency and Speed: Examine metrics like average call wait times, in-branch transaction times, and first-contact resolution. If data shows your competitors resolve 85% of issues on the first call while your institution is at 65%, that inefficiency is actively eroding customer trust.
Isolating these specific, measurable gaps provides a solid foundation for your entire strategy. It shifts the internal conversation from "I think we should..." to "The data indicates we must..."
The next step is using this intelligence to prioritize action. Explore Visbanking’s tools to begin benchmarking your performance today.
Using Competitive Benchmarking to Set Priorities
Making strategic decisions in a vacuum is a recipe for mediocrity. As an executive, you must know how your bank measures up against the competition—not just what your internal numbers indicate. Without that context, you are operating blind.
Consider this common scenario: you have reduced your average online account opening time to 12 minutes. Internally, this is celebrated as a victory over last year's performance. However, what if competitive analysis reveals that your top three local rivals all average just 7 minutes?
That 5-minute gap is not just a number. It represents a customer's first impression and a primary reason why your application completion rates are lagging.
From Data Points to Strategic Imperatives
This is where effective benchmarking transforms isolated data points into clear, actionable priorities. It moves the conversation from subjective feedback toward objective, measurable gaps in products, fees, and service levels. For a deeper analysis, review our guide on what is competitive benchmarking.
This clarity allows you to deploy resources where they will have a material impact and create a genuine competitive edge.
For example, discovering your mobile check deposit limits are significantly more restrictive than your peers' can immediately inform your product roadmap. The link between a stringent policy and operational burden is often startlingly direct.
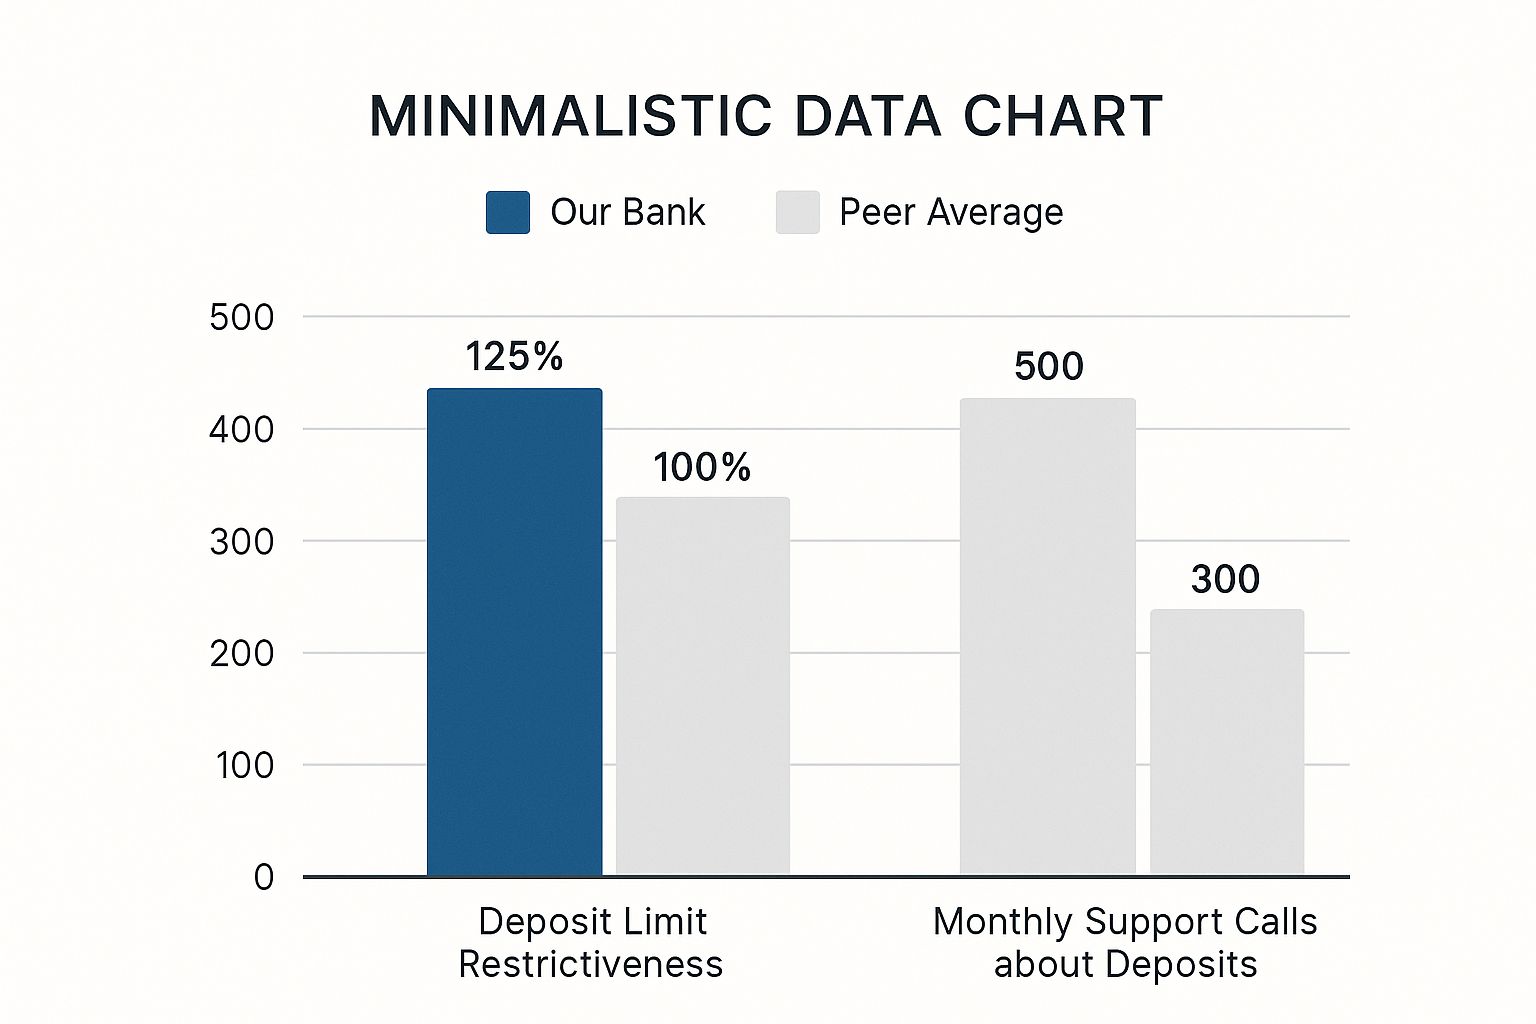
The data here tells a simple story: a policy that is 25% more restrictive than the peer average correlates with nearly 70% more support calls. This represents a direct drain on resources and a reliable source of customer frustration.
Prioritizing with a Competitive Lens
Once you possess this level of insight, prioritization ceases to be a debate and becomes a calculated exercise. The question is no longer, "What should we fix?" but rather, "Which competitive disadvantage is costing us the most in customers and capital?"
This table illustrates how a hypothetical bank's key service metrics compare against a defined peer group, highlighting specific areas for strategic improvement.
| Comparative Analysis: Key Service Metrics | | :----------------------------------- | :-------------------------- | :------------------------------------- | :----------------- | :----------------------------------------------------------------------------------------------------------------------------------------- | | Service Metric | Your Bank's Performance | Peer Group Average (Visbanking Data) | Performance Gap| Strategic Implication | | Mobile Check Deposit Limit | $2,500 | $5,000 | -$2,500 | A significant disadvantage causing customer friction and increased support calls. Raising the limit should be a top product priority. | | Avg. Call Center Wait Time | 3.5 minutes | 1.5 minutes | +2.0 minutes | A poor service experience likely leading to customer churn. Requires immediate operational review and potential staffing adjustments. | | Online Account Opening Time | 12 minutes | 7 minutes | +5 minutes | High friction at the acquisition stage is costing new customers. Process simplification and technology upgrades are critical. | | Overdraft Fee | $35.00 | $28.00 | +$7.00 | Uncompetitive pricing that can be a major deterrent for new and existing customers. A fee structure review is warranted. |
Viewing the data in this format makes it undeniably clear where the most urgent issues lie. A 2-minute longer wait time or a $7.00 higher fee is not a minor detail; it is a structural weakness.
By focusing on the areas where your bank is furthest behind its peers, you ensure that every dollar invested is aimed at closing a tangible competitive gap. This is how data-driven banks systematically improve customer satisfaction and capture market share.
It is time to stop guessing what your customers want and start knowing what the market demands. Use competitive data to benchmark your performance and set priorities that will drive real, measurable results.
Putting Your Data to Work: Targeted Fixes for Maximum Impact

You have diagnosed the problem and benchmarked your performance against the competition. What is the next step?
The answer is not a massive, expensive overhaul that paralyzes operations. The most significant gains come from surgical fixes aimed directly at the friction points you have uncovered—those actively harming your reputation and bottom line.
For example, if your data reveals a high abandonment rate during your online loan application, you do not need to scrap the entire website. A more intelligent approach, informed by competitor analysis, might show your income verification step is the primary culprit because it requires three more documents than peer institutions.
Simplifying that single step is a precise, data-backed solution. This small tweak could increase application completion rates by 15%. For a mid-sized bank, this could translate into an additional $5,000,000 in new funded loans annually—a significant return from a minor operational adjustment.
Securing Board Approval for Technology Investments
Many of these fixes require new technology, which necessitates a rock-solid business case for the board. Your data is your most powerful tool. Forget chasing the latest technology trend; focus on solving a quantifiable problem.
Consider an AI-powered chatbot. Do not pitch it as a tool to “improve service.” Present a quantitative case:
- The Problem: Our call center manages 10,000 routine calls per month for password resets and balance inquiries, at a cost of $7.00 per call.
- The Cost: This equates to $840,000 annually spent on tasks suitable for automation.
- The Solution: An AI chatbot, with a one-time implementation cost of $150,000, can automate 80% of these inquiries.
- The Payoff: This immediately frees up $672,000 in annual operational costs. More importantly, our agents can now focus on complex, high-value conversations that build customer loyalty.
This transforms the request from a technology expenditure into a clear-cut financial decision.
The Cost of Inaction
The argument for targeted fixes becomes even more compelling when you quantify the cost of inaction. A poor customer experience is not a single event. It costs six to seven times more to attract a new customer than to retain an existing one. Banks that understand this and invest in smart platforms see tangible results, such as resolving customer issues 30% faster. Dig into more crucial statistics shaping the customer experience to build your case.
The most effective improvements are not always the most expensive, but they are always the most informed. Precision, backed by competitive intelligence, ensures that every dollar spent is a direct investment in customer retention and profitability.
Ultimately, knowing how to improve customer satisfaction is about using data to identify the largest opportunities. Whether fixing a cumbersome digital form or automating routine support, the goal is constant: make it easier for customers to bank with you than with anyone else.
Explore how Visbanking's data can help you benchmark your operations and pinpoint the targeted fixes that will deliver a real impact.
Measuring ROI and Building a Culture of Improvement

Improving customer satisfaction is not a one-time project; it is a continuous discipline. For this discipline to become institutionalized, there must be a direct line from every action taken to the financial outcome it produces.
Every dollar invested in the customer experience must be justified with a clear return. This requires moving past vanity metrics like Net Promoter Score (NPS) and instilling a rigorous, data-first mindset across the organization. The conversation must shift from tracking satisfaction to demanding proof of its impact on the balance sheet.
Tying CX Investments to Financial Outcomes
You must create a clear feedback loop. Suppose you benchmark your mobile check deposit process and discover your limits are too restrictive compared to peers. You invest in streamlining the process. What does success look like?
Success is twofold.
First, track the immediate operational win: a 30% reduction in support calls related to mobile deposits. This is a direct, tangible decrease in your cost-to-serve—easy to measure and report.
Second, measure the resulting growth. An analysis should show a corresponding 10% increase in mobile adoption among a key segment, such as small businesses. This proves the project did not just solve a problem—it actively fueled growth and profitability. This is the core of effective performance measurement systems; they connect operational adjustments to strategic results.
Key Performance Indicators for the Boardroom
To build a sustainable culture of improvement, you must track the KPIs that command the board’s attention. These are the numbers that prove enhancing the customer experience is a core business strategy, not a cost center.
- Customer Lifetime Value (CLV): Prove that your most satisfied customers are also your most profitable over the long term.
- Churn Rate Reduction: Track this by product and segment. Reporting a 5% reduction in churn among high-value deposit accounts after a specific service improvement tells a powerful ROI story.
- Cost-to-Serve: How much does it cost to support a customer? Your digital self-service initiatives should demonstrably lower this cost per account.
The most critical question is not whether customers are happy. It is whether their satisfaction translates into measurable loyalty and profitability. If you cannot draw a straight line from a CX project to a financial result, that initiative has failed to prove its value.
The stakes have never been higher. Recent data from Zendesk shows 99% of consumers state service is a key factor in their choices, with 74% calling it essential. With 54% admitting they would leave over the frustration of repeating their issue, tolerance for friction is nonexistent. You can find more on the high stakes of modern customer service on zendesk.com.
Building this culture means every leader can answer precisely how their efforts to improve customer satisfaction are strengthening the bank’s financial position. The first step is to start building that business case by benchmarking your key metrics with Visbanking’s data.
Answering the Tough Questions from the Top
To effectively use data to improve customer satisfaction, you must change how your institution thinks. It is time to move beyond anecdotal evidence and gut feelings. Here is how to answer the critical questions that arise during this shift.
How Do We Convince the Board to Invest in Analytics?
You must speak their language: risk and reward. The board is not moved by vague promises of a better experience; they respond to clear data showing how an investment will increase revenue or how inaction will lead to measurable losses.
Do not just talk about improving the customer experience. Present the data. Display a chart comparing your call wait times or digital application abandonment rates against your top three competitors. Then, tie that data directly to a dollar amount.
For example: "Our current online application abandonment rate translates to an estimated $2,000,000 in lost loan volume annually. Our top competitors are closing these same applications 40% faster. A $250,000 investment to upgrade our platform will allow us to capture that lost revenue."
Every recommendation must have a direct line to a financial result—whether it is profit, efficiency, or defending market share.
What's the One Metric That Matters Most?
That is a trick question. There is no single metric.
Relying on one number, like an NPS score, is a trap that can create a false sense of security while deeper issues erode profitability. The most successful banks use a dashboard of connected metrics to understand the full picture.
Begin with operational metrics that directly shape the customer's reality, such as 'First Contact Resolution Rate' or 'Average Handle Time' in the call center. Then, correlate these with core business outcomes like 'Customer Churn Rate' and 'Customer Lifetime Value'.
The value is in connecting the dots. When you see your First Contact Resolution Rate increase by 10%, you should also see a measurable decrease in churn among your most valuable customers. The "most important" metric is simply the one that proves an operational fix delivered a tangible financial return.
This is how you transform "customer satisfaction" from a vague concept into a core component of your financial strategy.
We're Strapped for Resources. Where Do We Even Begin?
Go directly to the most significant sources of friction—the ones costing you the most money. Analyze your data to identify the top three reasons customers contact your support center. These calls are not just service issues; they are clear indicators of operational failures and customer frustration.
Once you have that list, use a tool like Visbanking to see how you perform on those specific issues relative to your peers. Your starting point is where three factors converge: a high-volume problem, a significant operational cost, and a clear competitive disadvantage.
For many banks, this area is the digital account opening or loan application process. It is a critical juncture where a small, focused improvement can deliver an oversized return in both new customers and operational savings. Secure a quick, visible win here to build the momentum—and the budget—for your next initiative.
Visbanking provides the Bank Intelligence and Action System that unifies financial, regulatory, and market data into decision-ready analytics. Stop guessing where you stand and start making precise, data-driven decisions that improve performance and capture market share.
Benchmark your bank against your peers and uncover your greatest opportunities for growth.
Related Articles

Visbanking Blog
Bank Customer Experience: Why Service Quality Matters More

Visbanking Blog
I recently changed banks over a Customer Service issue.

Visbanking Blog
Get a Competitive Advantage with BIAS, the Proactive Banking Solution

Visbanking Blog
How Bank Efficiency Ratios Reveal Hidden Operational Costs

Visbanking Blog
Success in banking doesn’t come from hitting home runs.

Visbanking Blog