Business Intelligence CRM: Guide for Data-Driven Bank Decisions
Brian's Banking Blog
A Business Intelligence CRM unifies cross-channel customer data into a single profile enriched with predictive scores and real-time triggers. For bank executives and directors, this integration drives precise cross-sell campaigns, proactive risk management and accelerated decision cycles—backed by Visbanking’s proven framework.
How Business Intelligence CRM Delivers Results
Banks and credit unions face demands for hyper-personalized offers while adhering to strict compliance standards. Integrating BI with CRM breaks down data silos, delivering measurable improvements in revenue, risk mitigation and operational efficiency.
Key Features:
- 360° Customer Profile — Fuses FDIC call reports, HMDA data and internal CRM records into one comprehensive view.
- Predictive Scoring — Applies Visbanking AI models to rank prospects by revenue potential and default probability.
- Automated Triggers — Activates targeted campaigns and risk alerts the moment defined data events occur.

Daily pipelines ingest core banking metrics, FDIC call reports and HMDA fields, updating each customer snapshot so executives can detect anomalies and optimize outreach in minutes.
Key Benefits Overview
Connecting BI and CRM delivers clear wins for leadership teams:
- Cross-sell uplift by up to 25% through context-driven recommendations
- Risk reduction with 15% fewer non-performing loans via early-warning alerts
- Operational cost savings near 10% by eliminating redundant workflows
- Decision latency cut—insights in minutes, not days
Visbanking Insight: “Unified data views reduced decision cycles by 40% for a regional bank.”
Practical Example at a Mid-Atlantic Credit Union
A mid-Atlantic credit union deployed Visbanking’s BI+CRM module and recorded a 22% increase in cross-sell revenue within three months. Automated risk alerts reduced non-performing loan balances by 12%, while streamlining analysis saved 60 hours per month. Directors now launch campaigns and review performance on demand.
BI CRM Components And Benefits Summary
| Component | Purpose | Executive Benefit |
|---|---|---|
| 360° Customer Profile | Combine multi-source financial and CRM data | Unified customer insights for targeted growth |
| Predictive Scoring | Apply AI risk and opportunity models | Prioritized leads and reduced defaults |
| Automated Triggers | Launch actions based on data events | Faster decisions and lower costs |
| Performance Dashboard | Visualize key metrics in real time | Operational efficiency and transparency |
This modular framework sharpens decision-making and strengthens risk controls. Ready to benchmark your BI+CRM maturity? Download our report template on the Visbanking Benchmark Portal and schedule a tailored briefing.
Understanding Key Concepts
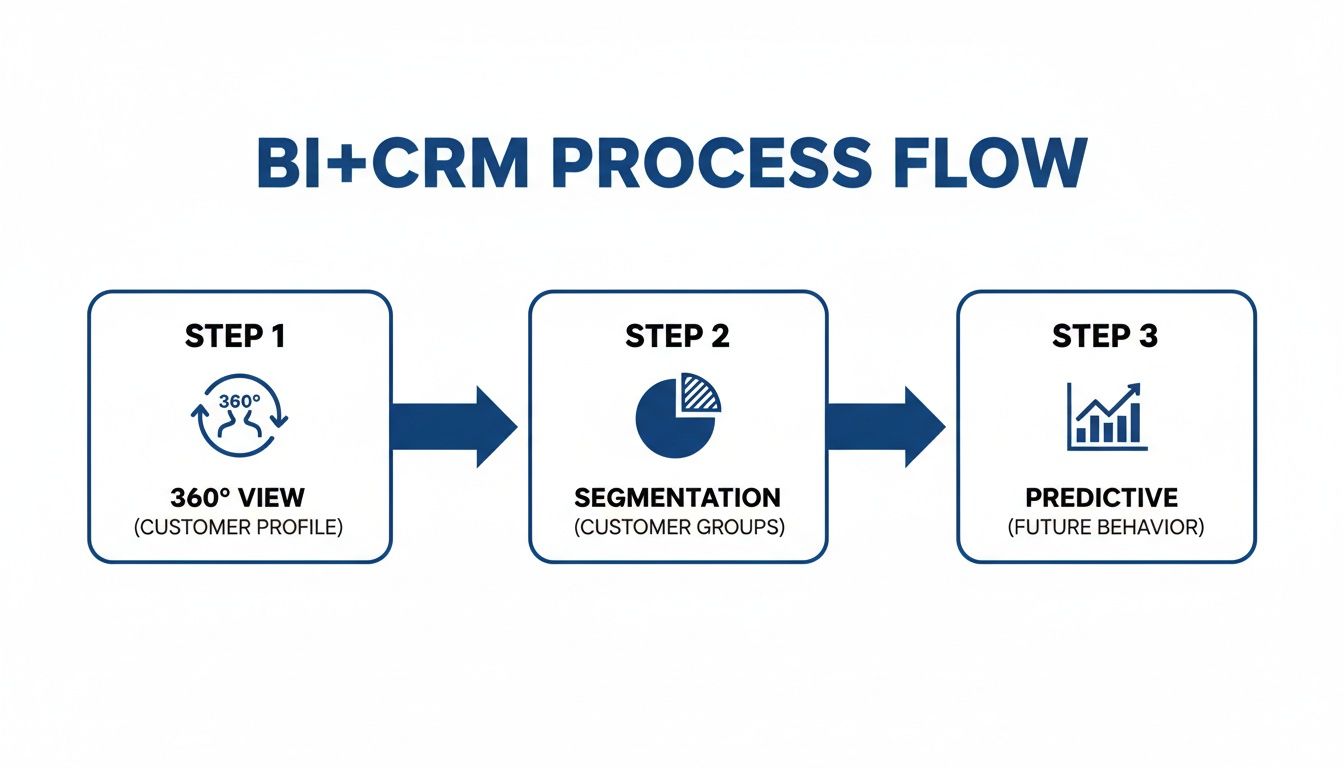
Turning scattered customer files into a cohesive decision engine transforms how banking leaders operate. A Customer 360° View knits together FDIC call reports, HMDA filings and in-house CRM profiles into one live dossier:
- Customer 360° View merges on-system and off-system data for a unified perspective
- Segmentation groups clients by behavior, product use and demographics for sharper outreach
- Predictive Modeling applies statistical and AI-driven scores to highlight credit risk or upsell potential
- Workflow Automation triggers alerts and tasks when balances, delinquencies or thresholds shift
- Dashboard Visualization arranges live KPIs into interactive charts for faster understanding
All modules turn your CRM into a dynamic analytics hub. In one pilot, Visbanking processed 100,000 loan records overnight and surfaced 8,500 accounts primed for targeted outreach.
From Insights To Action
Insights alone don’t move the needle—actions do. By routing risk alerts into Slack channels and auto-logging follow-up tasks in the CRM, teams cut manual triage by 30%. Real-time dashboards then reveal branch performance and deposit trends within minutes, enabling on-the-fly adjustments.
- Automated warnings shrink annual risk exposure by 15%
- On-demand scorecards cut report prep from days to hours
- Interactive visuals unite stakeholders around clear, actionable data
The global CRM market stood at $112.9 billion in 2025 and is projected to reach $262.7 billion by 2032, a 12.8% CAGR driven by analytics and AI. For deeper market context, see insights from Kixie.
Check out our guide on customer relationship management for banks to see how Visbanking integrates BI into CRM for actionable banking insights: https://visbanking.com/customer-relationship-management-for-banks
Another success story: a regional credit union slashed manual reporting by 40% after automating risk triggers and cross-sell notifications with Visbanking’s CRM workflows.
“BI-CRM delivers decision support at executive speed.”
Moving from a passive CRM to a proactive decision engine drives faster, data-driven cycles and proves ROI on lending, growth and risk initiatives. One community bank saw offer acceptance jump 25% by tying segmentation directly to personalized campaigns.
Bank executives ready to shift from hindsight to foresight will find BI-enabled CRM a clear path to reduced risk and accelerated growth. Start delivering impact today with Visbanking insights.
Integration Architecture And Data Workflows
An integrated BI+CRM setup brings data ingestion, analytics engines and user interfaces under one roof—turning raw numbers into actionable insights for strategy planning, risk controls and customer engagement. For a deeper dive into building robust pipelines, see our data integration best practices.
Data Layer Structure
At the core lies a centralized repository organizing information into raw and refined zones. This design tracks lineage, supports rollbacks and meets audit requirements:
- Staging Zone holds inbound tables from external and internal sources
- Cleansing Layer applies schema mapping, validation rules and deduplication
- Feature Store caches calculated metrics and risk scores for downstream models
- Master Data Repository maintains golden records for accounts and customers
Encryption in transit and at rest meets GLBA and FFIEC mandates. Role-based access ensures only authorized teams see sensitive PII. API connectors standardize real-time feeds to live banking systems and market data.
Pipeline Orchestration And Processing Modes
Balancing throughput and latency requires both batch and streaming jobs:
- Batch Processing for nightly bulk loads and enrichment
- Stream Processing for real-time alerts and triggers
- Orchestration that tracks SLAs, retries failures and surfaces errors
Best practices include idempotent transformations, automated retry logic with alert notifications and dashboards monitoring latency, job duration and drift. Moving compute close to data sources can cut processing times for critical feeds.
Core Data Sources
Banks and credit unions tap regulatory and internal feeds to build a 360° view:
| Data Source | Frequency | Key Use |
|---|---|---|
| FDIC Call Reports | Quarterly | Peer benchmarking and trend analysis |
| FFIEC/UBPR | Quarterly | Financial ratios and peer comparisons |
| NCUA 5300 | Quarterly | Credit union performance monitoring |
| HMDA | Annual | Compliance, segmentation and outreach |
| Core Banking | Nightly | Real-time balances and transactions |
Major CRM vendors report silo challenges in roughly 81% of IT environments. Learn more in this report on CRM data silo challenges. To sync effectively, use RESTful or Kafka-based connectors, enforce schema validation and define retention policies per source.
Example Workflow Scenario
A regional bank runs HMDA ingestion at 2 AM and completes ETL in under two hours:
- Stage 150,000 HMDA records in the staging zone
- Normalize fields, strip duplicates and apply ELT transformations
- Run risk models to assign credit-default probabilities
- Push updated scores into customer 360° profiles within the CRM
This process flags 2,500 accounts nightly for review. Automated triggers then launch outreach tasks, cutting review cycles by nearly 50%. Similarly, a credit union can pull NCUA 5300 data by 3:30 AM, generate peer-comparison insights and allocate reserves within four hours.
Best Practices For Deployment
Choosing between on-premises, cloud or hybrid depends on control versus elasticity:
- On-Premises: Full data residency control and in-house security
- Cloud: Scales with demand and reduces infrastructure overhead
- Hybrid: Keeps sensitive data onsite while leveraging cloud analytics
Containerization and microservices enable continuous delivery of ETL components. Observability tools should track failure rates, data drift and performance metrics. Align IT and business on governance—container security, network segmentation and encryption key management—to accelerate deployments.
Contact your account executive to evaluate your integration strategy with Visbanking.
Business Value And Use Cases
When BI and CRM converge, raw data becomes clear next steps. Teams spot growth pockets, tighten risk controls and optimize HR workflows. Static reports give way to predictive processes that fuel revenue and reduce costs.
Three scenarios illustrate outcomes with Visbanking:
- Predictive Lead Scoring boosts cross-sell by 22% at a midsize bank
- Automated Risk Alerts slash non-performing loans by 15% at a credit union
- Employee Performance Dashboards free up hundreds of hours monthly for HR
These snapshots show how integrated insights guide fast action. Marrying external benchmarks with internal CRM records reveals hidden opportunities.
Real Bank Lead Scoring
A regional bank rolled out Visbanking’s predictive model across its retail book. In six weeks, they flagged 5,400 high-potential accounts. Campaigns aimed at this segment lifted acceptance rates from 8% to 15%, unlocking an extra $1.2 million in revenue.
Here’s how they did it:
- Data Ingestion — Nightly pipelines pulled transaction histories and FDIC call reports
- Model Training — Visbanking’s algorithms scored each account for cross-sell probability
- Campaign Execution — Top 20% of prospects entered targeted email and call sequences
- Outcome Tracking — Live dashboards displayed touchpoints, average deal sizes and conversion rates
“Predictive scoring turned dormant accounts into new revenue streams in under two months.”
Across the market, CRM users report:
- 25% Increase in marketing ROI
- 41% Uplift in sales revenue
Read more on boosting CRM performance at Dialectica.
Credit Union Risk Management
A credit union processed 12,000 loan records each night with Visbanking’s risk-alert engine. The system flagged 1,800 accounts showing early delinquency patterns. Automated prompts drove non-performing loans down from 3.2% to 2.7% in three months.
Key benefits included:
- 15% Fewer delinquencies year over year
- 75 hours saved on manual loan reviews
- Dynamic Risk Scoring updating with each new transaction
Branch teams received Slack alerts and CRM tasks to prioritize follow-ups. This feedback loop cut loss provisions by $350,000 in Q1. HR leaders use the same platform for workforce insights—by reallocating staff to busy branches, one bank reclaimed 160 work hours each week and lifted NPS by 12 points.
Explore your ROI by benchmarking current capabilities on the Visbanking Benchmark Portal.
Implementation Best Practices And KPI Tracking
Rolling out a Business Intelligence CRM platform demands careful planning, strategic alignment and a clear path to measurable returns. Use the following playbook for structured deployment and executive-level impact.
Vendor Evaluation And Selection
Zero in on vendors offering robust connectors to core banking systems, regulatory feeds and your CRM database. Key criteria:
- Total Cost of Ownership — Licensing, implementation and ongoing training
- ROI Forecasting — Scenarios over a three-year horizon to identify payback timelines
- Integration Capabilities — API coverage, data latency SLAs and pre-built adapters
- Security Controls — Role-based access, encryption in transit and at rest, audit trails
- Vendor Service Levels — SLAs, update cadence and dedicated account resources
Validate performance with peer references, focusing on time to value and executive adoption rates.
Sample Implementation Roadmap
A phased, six-month example timeline:
- Project Kickoff & Governance — Define steering committee, success criteria and risk matrix
- Data Connector Configuration — Wire up FDIC call reports, HMDA feeds and CRM APIs
- Pilot Phase — Deploy dashboards for 2–3 user groups, then gather feedback
- Full Deployment — Scale integrations, automate workflows and onboard 100+ end users
- Optimization & Reporting — Refine KPIs, build alert rules and schedule monthly executive reviews
Plan contingencies for data quality issues, vendor lock-in and integration delays. Maintain a rapid-response team for critical fixes.
Data Governance And Change Management
Data governance is an operational framework—assign clear roles, establish stewardship processes and enforce audit logs. Change management keeps stakeholders aligned with tailored training and communication plans for executives, analysts and branch personnel.
Key elements:
- Role-Based Access Control to limit data visibility by function
- Data Stewardship Teams to own quality checks and enforce standards
- Audit Logs capturing every change for compliance reviews
Supplement hands-on workshops with just-in-time video tutorials and quarterly refreshers tied to new features.
Cost Forecasting And ROI
Map your Total Cost of Ownership across software fees, infrastructure, training and change management. Build ROI models—conservative and optimistic scenarios—showing how a 20% cross-sell uplift or a 15% drop in defaults justifies the investment.
Visbanking Insight: “Benchmarking cost forecasts improved ROI visibility by 30% for a regional bank.”
Embed ROI check-ins at each project phase and refine forecasts in real time based on adoption and performance metrics.
Tracking Key Performance Indicators
Tie KPIs directly to strategic objectives and executive priorities:
- Customer Lifetime Value Growth: Revenue trajectory per client
- Cross-Sell Ratio: New product uptake per customer
- Campaign ROI: Return on marketing spend
- Response-Time Improvement: Speed from trigger to decision
- Operational Cost Savings: Expense reduction from automation
- Risk Event Frequency: Flagged events versus actual incidents
- Employee Productivity: Time reclaimed from manual tasks
Benchmark against historical performance and peer data. For reference, explore our financial dashboard examples. Dashboards should refresh in real time and offer drill-downs by segment. Update external comparators quarterly and empower an internal center of excellence to share best practices.
Engage with Visbanking to unify dashboards, benchmarking and KPIs on one platform. Contact your account executive today.
Security and Compliance Requirements
When integrating BI and CRM, security is non-negotiable. Visbanking encrypts data at rest and in motion using AES-256 and TLS 1.2+, meeting GLBA and FFIEC mandates for protecting PII. Role-based access ensures users see only what they’re authorized to view.

An unbroken audit trail timestamps actions and captures user IDs, essential for forensic investigations and compliance checks. Tokenization and data masking reduce exposure while preserving analytical integrity. In non-production environments, full anonymization ensures no real customer data is ever exposed.
Regulatory Controls
Key frameworks for a unified BI+CRM deployment:
- GLBA — Enforces confidentiality of customer financial details
- SOX — Mandates auditable financial records
- FFIEC Guidance — Outlines risk management best practices
- PII Protection — Requires data minimization and anonymization
- Audit Logs — Must capture user IDs, timestamps and action specifics
“Embedding compliance into the data pipeline reduces breach risks and accelerates audits.”
Vendor Risk Management
Outsourcing adds complexity. A structured vendor risk program should:
- Conduct annual security questionnaires and on-site audits
- Review third-party encryption certifications and penetration testing reports
- Define SLAs for incident response times and patch management
Extend internal controls to partners, maintain continuous monitoring and schedule periodic penetration tests. Feed SIEM alerts into your analytics stream for real-time threat detection. Mandatory data-handling training and quarterly compliance drills keep teams sharp. Executives should review audit summaries every quarter via governance dashboards showing live compliance metrics against benchmarks.
Request a customized security demo with Visbanking’s technical team.
Next Steps And Common Questions
To kick off your BI+CRM rollout, first benchmark your current state against peer banks and credit unions. Identify gaps in data sourcing, analytics and customer workflows, then draft a roadmap aligning data ingestion, analytics and CRM to your strategic goals.
- What data feeds power your Customer 360° view?
- Which SLAs govern latency and refresh rates?
- Who sits on the steering committee and what decisions do they own?
- What ROI figure will prompt scaling the pilot?
- How will you ensure compliance with GLBA and FFIEC rules?
Assemble a steering committee with stakeholders from IT, risk, marketing and compliance to keep the project on track and accelerate approvals.
Vendor Demo Checklist
- Confirm connectivity to FDIC call reports, NCUA 5300, HMDA and core banking APIs
- Test data model flexibility and ease of building custom dashboards
- Verify security standards: AES-256 encryption and role-based access
- Measure live data refresh speeds and SLA guarantees
- Explore automated alert flows into Slack, email or your CRM
Common Executive Questions
“Mapping integration milestones brought our pilot live 30% faster.” – CFO, Regional Bank
| Question | Executive Guidance |
|---|---|
| Integration Timeline | Budget 12–24 weeks for pilot (data mapping, testing) |
| Expected ROI | Aim for 20% cross-sell lift or 15% risk reduction |
| Required Data Sources | FDIC call reports, HMDA, FFIEC ratios, core banking extracts |
| Compliance Must-Haves | Embed GLBA, FFIEC & SOX controls throughout data pipelines |
Most pilots finish in 12–24 weeks, with full rollouts by week 36. Year-one goals should target a 20% lift in cross-sells or a 15% drop in at-risk balances. Key inputs include FDIC and NCUA filings, HMDA data, FFIEC UBPR, UCC records and daily core banking snapshots. Embed GLBA, SOX and FFIEC checks from ingestion through reporting. Then set up quarterly check-ins to track progress and refine executive dashboards.
Ready to see how your BI+CRM maturity stacks up? Request a benchmarking report or book a Visbanking Demo today.
Related Articles

Visbanking Blog
Ever wondered how a global startup operates amidst the complex banking industry?

Visbanking Blog
Banking Data Analytics: Turning Information Into Profit

Visbanking Blog
Revolutionize Your Banking Operations with Data-Driven Insights from BIAS

Visbanking Blog
BIAS: The Smart Choice for Banking Intelligence and Action

Visbanking Blog
BIAS: The Smart Choice for Banking Intelligence and Action

Visbanking Blog