A Guide to Data-Driven Sales Territory Planning for Banks
Brian's Banking Blog
Sales territory planning is not an administrative task of drawing lines on a map. It is the strategic alignment of a bank's most valuable asset—its relationship managers—with its greatest opportunities for growth. For banking executives, this process must move beyond simple geography to create balanced territories based on quantifiable potential, such as commercial loan demand, deposit concentration, and emerging market needs.
Why Territory Design Is a Critical Growth Lever in Banking

Effective territory design is a primary driver of revenue growth, not a logistical exercise. Poorly structured territories directly impede performance, leading to missed quotas, frustrated relationship managers (RMs), and market share ceded to competitors with more sophisticated, data-driven strategies.
The legacy approach—relying on anecdotal evidence or replicating last year's map—is no longer defensible. A data-driven methodology is what separates market leaders from the rest. It is a cornerstone of designing an effective organizational structure for scalable growth.
The Financial Cost of Flawed Territories
When territories are imbalanced, the financial impact is immediate and significant.
- The Overburdened Performer: Your top RM is assigned a territory with 250 high-quality commercial prospects. However, their capacity limits them to actively managing only 150 of those relationships. The remaining 100 prospects represent millions in untapped loan and deposit potential, effectively left fallow.
- The Underutilized Asset: Concurrently, a capable RM in an adjacent territory has only 80 viable prospects. They exhaust their opportunities within months, leading to disengagement and, ultimately, costly turnover.
This imbalance not only caps revenue but also fosters a perception of inequity that erodes morale and drives talent to competitors.
From Subjective Assignments to a Growth Engine
The solution is to construct territories based on empirical opportunity, not historical precedent. This requires consolidating disparate data sources into a single, coherent view of the market.
By integrating FDIC call reports, UCC filings for commercial lending, and HMDA data for mortgage trends, banks can precisely identify where capital is flowing. This intelligence enables the engineering of equitable, balanced territories focused squarely on strategic growth objectives.
For instance, if a bank's objective is to expand its C&I loan portfolio, a data intelligence platform like Visbanking can identify a specific county with a high concentration of manufacturing firms that have recently filed for equipment financing. This transforms a vague goal into a direct, actionable strategy: deploy your most skilled C&I lender to that market, armed with precise intelligence.
This guide provides a blueprint for converting territory design into a core performance driver. We will detail the necessary data, market segmentation techniques, and execution strategies. A critical first step is to benchmark your current market coverage against empirical data to identify the most immediate opportunities.
Building Your Data Foundation: The Prerequisite for Strategic Territory Planning
Superior sales territories cannot be built on intuition or outdated assumptions. The process must begin with a robust, multi-layered data foundation. For banking executives, this means looking beyond the confines of the institution's own CRM.
The objective is to synthesize scattered public and private datasets into a unified, actionable market intelligence picture. This is not merely about locating existing customers; it is about pinpointing where the next wave of growth will originate.
While an internal system of record is a necessary starting point, and selecting the best CRM for sales territory planning is important, it reveals only a fraction of the total market potential. It represents what your bank knows, not what it could know.
Integrating the Essential Datasets
A comprehensive understanding of market dynamics requires the integration of key external data sources. Each provides a distinct, critical lens for assessing opportunity and risk.
The following table outlines the core data sources that banking executives must leverage for effective territory planning, detailing their strategic purpose and practical application.
Core Data Sources for Bank Territory Planning
| Data Source | Strategic Purpose | Example Use Case |
|---|---|---|
| FDIC/NCUA Call Reports | Competitive Intelligence | Analyze a rival institution's loan concentration and deposit mix in a specific county to identify market vulnerabilities and strategic openings. |
| HMDA Data | Mortgage Market Targeting | Pinpoint census tracts with high mortgage origination volumes and identify which competitors dominate the local market. |
| UCC Filings | Commercial Lead Generation | Receive real-time alerts when local businesses file for equipment financing, signaling an immediate need for outreach from your commercial lenders. |
| Proprietary Market Data | Market Sizing & Segmentation | Identify high-growth industries or business segments within a geographic area to concentrate sales efforts for maximum impact. |
These datasets are the architectural components of a powerful market intelligence engine. When consolidated, they reveal strategic connections that competitors, operating on fragmented data, will invariably miss.
Manual aggregation of these sources is inefficient and prone to error. Modern intelligence platforms provide the necessary infrastructure to automate this process, delivering a single, reliable source of truth. To understand this concept more deeply, review our guide on what business intelligence analytics means for banking.
Translating Raw Data into Actionable Strategy
The strategic advantage emerges when these datasets are layered to answer critical business questions.
Consider a regional bank aiming to expand its middle-market commercial loan portfolio. Instead of issuing a general directive to "find more clients," it can adopt a surgically precise, data-driven approach.
A practical application:
The bank overlays UCC filing data with industry data from the Bureau of Labor Statistics (BLS). This analysis might reveal a county where manufacturing firms constitute 35% of local businesses and have demonstrated a 20% year-over-year increase in equipment financing needs.A vague goal like "expand in the northern region" is immediately transformed into a specific, data-validated mission.
This level of analytical rigor distinguishes market leaders. Optimized sales territories are not about lines on a map; they are about aligning your team's finite resources with the densest pockets of opportunity to drive measurable revenue growth.
This is a common point of failure. Research shows that a staggering 58% of B2B companies are ineffective at territory mapping due to poor data integrity. They are forfeiting a potential 10-20% increase in sales.
Establishing the right data infrastructure is the non-negotiable first step. It is the mechanism that transitions your institution from reactive decision-making to proactive, intelligence-led growth.
From Data to Design: Scoring and Segmenting Your Market
With a robust data foundation in place, the strategic work begins. This phase moves beyond data aggregation to its application in designing intelligent sales territories. The objective is to create territories balanced not merely by workload, but by tangible, quantifiable opportunity. This requires a calculated shift from simple geographic assignments to strategic market segmentation and potential scoring.
The essential tool for this process is a custom 'Territory Potential Index' (TPI). This is not a generic metric but a weighted score, calibrated to your bank’s specific growth objectives. A well-constructed TPI ensures your team pursues future potential, not just past performance.
Constructing a Territory Potential Index
An effective TPI requires weighting several key variables to create a composite score that reveals the true underlying value of a market.
The typical components include:
- Historical Performance: Analyze past loan origination, deposit growth, and fee income. This provides a baseline but should not be over-weighted—a common error that anchors strategy to the past.
- Target Prospect Density: Quantify the number of ideal clients within the area. For a commercial team, this might be businesses with revenues between $10,000,000 and $50,000,000. For a credit union, it could be institutions with assets over $500,000,000. Specificity is critical.
- Competitor Saturation: A high-potential market dominated by two or three entrenched competitors presents a different challenge than an underserved one. Map competitor branches and analyze their market share from FDIC data.
- Leading Economic Indicators: This is the forward-looking component. Fresh UCC filings signaling commercial credit needs or high-volume HMDA data in expanding residential areas provide predictive insights.
This workflow—data consolidation, scoring, and balanced distribution—is a strategic imperative. It systematically eliminates the guesswork that has historically plagued territory design.
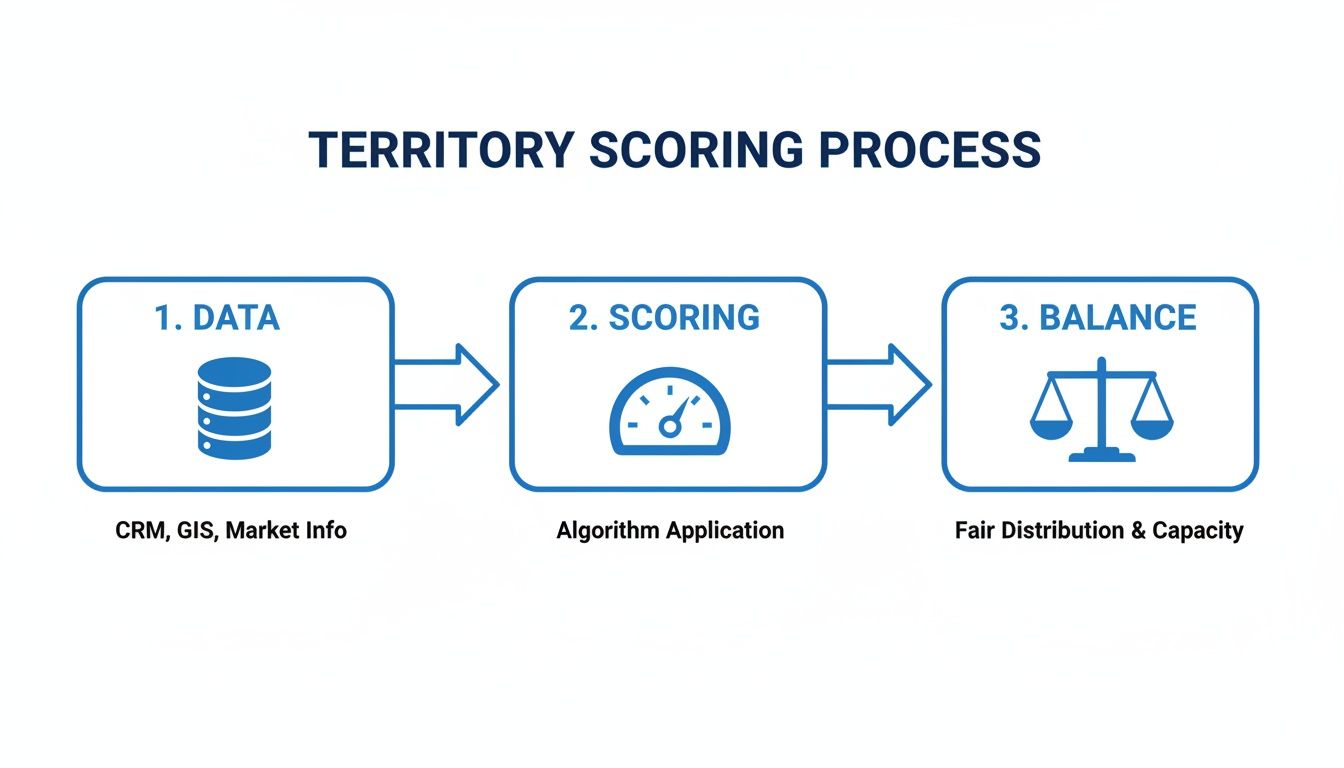
This process turns raw market data into an equitable and strategic distribution of opportunity, driving predictable results.
A Real-World Scoring Scenario
Consider two adjacent territories for your commercial lending team. A superficial analysis might lead to assigning the larger geographic area to the RM covering the historically more productive region. The TPI provides a more intelligent conclusion.
Territory A: Historical data shows $25,000,000 in annual loan volume. However, market intelligence reveals a high concentration of manufacturing firms with a recent surge in UCC filings for new equipment. Competitor presence is minimal. Its weighted TPI score is 85.
Territory B: Appears superior with $40,000,000 in historical loan volume. But the data shows a saturated market where two large competitors control 60% of commercial deposits and new business formation is stagnant. Its TPI score is only 70.
Without this scoring, an executive might overload Territory B, assigning an RM to an intense, low-yield battle for market share. The TPI, however, identifies Territory A as the locus of untapped potential. This is the essence of effective bank customer segmentation—aligning sales resources with clients demonstrating a propensity to transact.
Top-performing banks adhere to a strict +/-10% workload variance to ensure equitable distribution of opportunity. This level of precision is unattainable through manual spreadsheet analysis. A report from QuotaPath found that 58% of B2B firms fail at this process due to inadequate data, costing them 10-20% in potential sales growth.
Modern intelligence tools are essential for this task. They provide not only the raw data but also the analytical power to score potential accurately and identify key decision-makers at target accounts, transforming territory planning from a subjective exercise into a core driver of predictable revenue.
Bringing Your New Territory Plan to Life

A meticulously crafted sales territory plan has no value until it is effectively implemented. Execution is where many strategies falter. Successful deployment depends on two critical factors: establishing intelligent, data-driven quotas and securing buy-in from your relationship managers.
Abandoning the Legacy Quota Model
The practice of applying a uniform 5% year-over-year quota increase to every relationship manager is an outdated, ineffective approach. It is a blunt instrument that disregards the empirical market potential meticulously uncovered during the data analysis phase.
A superior methodology directly links quotas to the Territory Potential Index (TPI). This aligns individual goals with validated market opportunity.
Consider two distinct commercial banking territories:
- Territory A (High Potential): Scored an 85 on your TPI, indicating a high density of prospects with recent UCC filings and low competitive saturation. A 5% quota increase is insufficient. A more strategic goal of 15% growth is justifiable, supported by a prioritized list of qualified leads generated from the data.
- Territory B (Mature Market): Scored a 70, reflecting a stable client base but intense competition. A 3% quota focused on increasing deposit share and cross-selling treasury services is more realistic and strategic than pursuing new logos in a saturated market.
This is not merely about fairness; it is about strategic resource allocation. The objective is to shift the team's focus from pursuing an arbitrary number to capturing a calculated share of a known market potential.
When you provide your team not just with a quota, but with the data-driven rationale behind it, the goal is transformed from a directive into a strategic roadmap.
Driving Adoption with Data, Not Directives
No territory realignment will succeed without the endorsement of your relationship managers. Resistance is to be expected, particularly from seasoned bankers who have invested years cultivating their client portfolios.
The solution is not a top-down mandate, but a transparent, data-backed business case.
You must be prepared to articulate the "why" behind every adjustment. When meeting with a senior RM to discuss their new territory, the presentation must go beyond a revised map. It must be a compelling case for their future success.
Imagine presenting a dashboard of their new territory. Instead of geographic lines, they see a heat map identifying 150 high-potential prospects perfectly aligned with their expertise. Furthermore, the data flags that 25 of those prospects have recent UCC filings indicating an immediate need for commercial credit.
This transforms the conversation.
It demonstrates that the plan is based on objective opportunity, not internal politics, and that the bank has invested in equipping them to succeed. A sophisticated relationship manager prospecting tool is invaluable here, delivering real-time alerts that enable RMs to secure early wins and build momentum.
When your team understands that data is being used to enhance their success, they will not just accept the plan—they will execute it with conviction.
Measuring Success with the Right KPIs
A sales territory plan is a dynamic strategy, not a static document. It requires continuous monitoring to assess performance and make necessary adjustments. For bank executives, relying solely on top-line revenue per territory is an insufficient, lagging indicator. A more sophisticated set of Key Performance Indicators (KPIs) is required to accurately diagnose the health of your sales efforts.
This data-driven feedback loop is essential. A territory consistently underperforming its potential signals a need for intervention—be it enhanced marketing support, targeted coaching for the RM, or a personnel change. Continuous monitoring transforms a solid plan into a high-performance growth engine.
Moving Beyond Simple Revenue Metrics
Loan origination and deposit growth are foundational metrics, but they do not provide a complete picture. To gain true insight, executives must track more granular KPIs that measure both activity and outcomes.
The following metrics provide a more precise view of performance:
- Account Penetration Rate: What percentage of target clients within a territory have been converted into customers? A low penetration rate in a high-potential (high TPI) territory is a clear indicator of where to focus prospecting efforts.
- Product Cross-Sell Ratio: What is the average number of products or services utilized per client? This KPI reveals whether your team is merely opening accounts or building deep, profitable, and defensible relationships.
- New Client Acquisition Velocity: At what rate is an RM acquiring new-to-bank clients? This directly measures their effectiveness in expanding the bank's market footprint.
For example, a territory may report a strong $15,000,000 in year-over-year loan growth. On the surface, this appears successful. However, if its cross-sell ratio is only 1.2 products per client and new client acquisition is flat, it reveals an underlying weakness: the RM is servicing existing needs rather than proactively growing the business. This is a critical insight missed by top-line analysis alone.
Establishing a Data-Driven Review Cadence
Tracking these KPIs is only effective if integrated into a structured, recurring review process. Leading institutions implement a formal quarterly business review to analyze territory performance. These sessions are not simple report-outs; they are strategic assessments to diagnose issues and reallocate resources to capitalize on emerging opportunities.
The financial stakes are high. Companies with poorly designed sales territories often experience 15 percent lower sales goal achievement. Conversely, those that optimize their strategy can achieve over 14 percent higher attainment and unlock a potential 20 percent revenue lift by aligning teams with the right targets. You can read more about the financial impact on xactlycorp.com.
A data intelligence platform like Visbanking is a strategic asset in this process. It synthesizes complex market and performance data into clear, actionable dashboards. Executives can instantly benchmark a territory’s performance against its potential, identifying issues long before they impact quarterly results. This facilitates a shift from reactive problem-solving to proactive strategic management.
The ultimate goal is to foster a culture of accountability where performance is transparent and directly correlated with market opportunity. To assess your own territories, explore Visbanking’s data to benchmark performance and identify your next sources of growth.
Your Top Questions About Sales Territory Planning, Answered
As bank executives begin to implement a data-driven territory plan, several practical questions consistently arise. Here are direct answers to the most common inquiries.
How Often Should We Redo Our Sales Territories?
A major structural realignment should be conducted every 18-24 months. However, a formal review of territory performance must occur quarterly. The market dynamics affecting loan demand and deposit flows do not adhere to an annual planning cycle.
Consider a scenario where new federal incentives trigger a surge in SBA 7(a) loan applications in a previously overlooked county. An annual plan misses this opportunity entirely. An agile, quarterly review process allows leadership to reallocate an RM's focus or temporarily adjust a boundary to capitalize on this real-time market shift. This is continuous optimization.
The most significant error is treating territory planning as a singular project. It is an ongoing strategic function. A quarterly review is not just a best practice; it is the minimum requirement for maintaining a competitive edge.
What's the Single Biggest Mistake Banks Make?
Relying almost exclusively on historical sales data to determine a territory's value. This is analogous to driving while looking only in the rearview mirror. It reinforces past activities, potentially trapping top performers in saturated markets while ignoring emerging growth areas.
A common example: a bank assigns its top commercial lender to a territory solely because it generated $40,000,000 in loans the previous year. Meanwhile, an adjacent territory, which produced only $15,000,000, is experiencing a 30% year-over-year increase in UCC filings from new manufacturing firms. While its past performance is lower, its future potential is exponentially greater.
Effective data intelligence balances historical performance with forward-looking indicators, enabling you to deploy resources toward future growth, not just maintenance of the status quo.
How Do I Get My Relationship Managers to Buy In?
You cannot expect endorsement by simply presenting a new map. Your most experienced RMs have invested years building their client base and are rightfully protective of their work.
The keys are transparency and data. Do not just present the "what"; you must articulate the "why."
Walk them through the business case for their newly defined territory. Show them the competitor density analysis, the market potential scores, and the methodology used to balance workloads. Frame the realignment as a strategic initiative designed to increase their probability of success.
Instead of just showing a redrawn line, provide an RM with a prioritized list of 50 high-potential prospects in their new territory that are an ideal fit for their expertise. More powerfully, show them that your data has already flagged 10 of those prospects as having immediate credit needs. When your team sees the plan is equitable, intelligent, and backed by tangible opportunity, they will view it as a tool for their success.
Can This Really Make a Difference to Our Bottom Line?
Yes, unequivocally. Well-designed territories consistently boost sales team performance by 10-20%. For a bank, this translates directly to increased loan volume, accelerated deposit growth, and an improved net interest margin.
To quantify the impact, consider a $5,000,000,000 bank with a 20-person RM team. A conservative 15% performance lift—achieved simply by reallocating effort from low-potential activities to high-value targets—could readily generate an additional $100,000,000 to $200,000,000 in annual loan production.
This is not a theoretical exercise. It is the direct financial result of placing your best talent in front of your best opportunities.
Effective sales territory planning eliminates guesswork and transforms your team into a predictable growth engine. With Visbanking, you can consolidate your market intelligence, benchmark performance against true potential, and provide your leadership with the tools to make faster, more informed decisions.
See how your territories compare and find your next growth opportunity at https://www.visbanking.com.
Related Articles

Visbanking Blog
Banking Data Analytics: Turning Information Into Profit

Visbanking Blog
BIAS: Your Competitive Edge in Banking Data Driven Strategy

Visbanking Blog
Capital Banking in the USA: An Overview of Investment Services, Financial Instruments, and Regulations

Visbanking Blog
Empowering Banks with Visbanking's Enterprise Solution: Performance, Prospects, and Talent Insights

Visbanking Blog
Revolutionize Your Banking Operations with Data-Driven Insights from BIAS

Visbanking Blog