Liquidity Coverage Ratio Calculation: A Guide for Banking Leaders
Brian's Banking Blog
Liquidity Coverage Ratio Calculation
The liquidity coverage ratio calculation measures a bank’s stock of high-quality liquid assets (HQLA) against its projected total net cash outflows over a 30-day stress period. This ratio answers one critical question: can your institution survive a sudden liquidity crisis on its own?
An LCR of 100% or greater signals that a bank holds sufficient HQLA to cover its net outflows without external support. This regulatory minimum is the first line of defense. For executive leadership, however, it should be viewed as a floor, not a target.
Beyond Compliance: Why the LCR Calculation Matters
Treating the LCR as a mere regulatory checkbox is a strategic error. A rigorously managed LCR framework does more than satisfy examiners—it underpins institutional resilience and drives better decisions.
The 2023 regional banking crisis provided a stark reminder of this reality. Institutions with robust LCRs maintained depositor confidence and operational stability, while those with weaker liquidity faced catastrophic runs.
A Strategic Management Tool
When viewed as a dynamic decision-support metric, the LCR informs balance sheet optimization, funding strategy, and contingency planning. Executive teams that leverage LCR analytics gain distinct advantages:
- Benchmark Performance: Align HQLA composition and outflow assumptions with top-performing peers.
- Identify Vulnerabilities: Model the impact of rapid deposit flight or credit line drawdowns before they materialize.
- Enhance Market Reputation: Signal financial strength to investors and corporate depositors, thereby improving funding costs.
The LCR was introduced as part of post-2008 reforms, with large U.S. banks adopting the standard in 2014. Yet even after the crisis, industry liquidity buffers fluctuated significantly. For instance, between Q4 2009 and Q4 2010, the industry’s average LCR fell from 70% to 60%. This was driven by a 17% reduction in recognized liquid assets—from $2,023 billion to $1,678 billion—a clear demonstration of how asset classification directly impacts the ratio.
A strong LCR is more than a defense mechanism—it's a competitive advantage. It demonstrates foresight and positions your institution to capitalize on opportunities when others are forced to retreat.
This guide moves beyond the basics of regulatory compliance in banking to show how the LCR calculation can be transformed from a static report into a forward-looking strategic asset. Integrated data intelligence platforms like Visbanking automate validation, enable real-time benchmarking, and convert raw regulatory figures into actionable intelligence for executive leadership.
Mastering HQLA: The Numerator of the LCR
A bank's resilience is directly tied to the quality of its liquid assets. The numerator of the LCR calculation—the stock of High-Quality Liquid Assets (HQLA)—is not just a cash reserve. It is a strategically constructed portfolio designed for rapid, orderly liquidation with minimal loss during a crisis.
For any bank executive, a deep understanding of the HQLA buffer is fundamental to sound liquidity risk management.
Regulators mandate a clear hierarchy for HQLA, classifying assets into three tiers based on credit quality and market depth under stress conditions. To truly master this, one must understand what makes an asset truly liquid when markets seize. This a guide to market liquidity in assets provides a solid primer on the topic.
This flowchart provides a concise visual of HQLA’s role in the calculation.
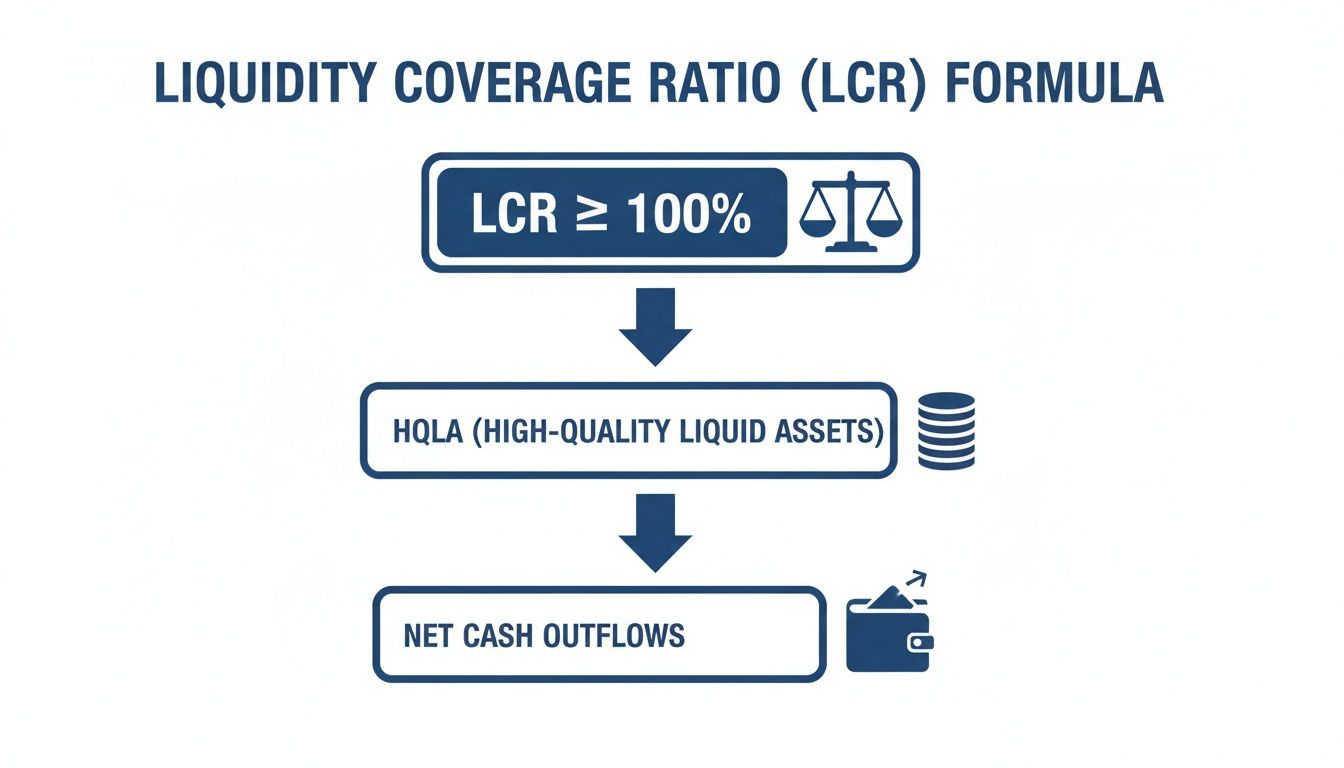
The principle is straightforward: HQLA must be sufficient to cover projected net cash outflows during a severe, 30-day stress event.
Deconstructing The HQLA Tiers
The stringent rules for HQLA ensure only assets with proven stability and marketability qualify. Each tier is subject to a specific valuation adjustment, or "haircut," reflecting its expected performance under duress.
Level 1 Assets: The Bedrock Of Liquidity
These are the highest-quality, most liquid assets. They are valued at 100% of their market value with no haircut applied, forming the core of any sound HQLA portfolio.
- Qualifying Assets: Cash, central bank reserves, and U.S. Treasury securities.
- Executive Takeaway: No regulatory cap exists for Level 1 assets. While over-concentration here may sacrifice yield, it represents the safest liquidity position—a fundamental strategic trade-off.
Level 2A Assets: High Quality, Minor Haircut
These assets possess high liquidity but carry slightly more market and credit risk than Level 1 assets. Consequently, they receive a 15% haircut, meaning only 85% of their market value contributes to the HQLA total.
- Qualifying Assets: Securities issued or guaranteed by U.S. government-sponsored enterprises (GSEs) like Fannie Mae and Freddie Mac.
- Executive Takeaway: Total Level 2 assets (2A and 2B combined) cannot exceed 40% of total HQLA. This rule enforces diversification away from assets with even minimal risk.
Level 2B Assets: The Final Tier Of Support
This tier includes assets with greater risk, such as certain corporate bonds and publicly traded stocks. They are subject to a significant 50% haircut and the tightest compositional limits.
- Qualifying Assets: Investment-grade corporate debt securities with a strong liquidity track record and certain equities included in major stock indices.
- Executive Takeaway: Level 2B assets are capped at 15% of total HQLA. Over-reliance here creates a false sense of security, as half their value is immediately discounted and their overall contribution is strictly limited.
The table below summarizes the HQLA classification, regulatory haircuts, and composition caps.
HQLA Classification and Regulatory Haircuts
| HQLA Level | Example Assets | Valuation (Haircut) | Composition Cap |
|---|---|---|---|
| Level 1 | Cash, Central Bank Reserves, U.S. Treasuries | 100% (No haircut) | No cap |
| Level 2A | GSE Securities (Fannie Mae, Freddie Mac) | 85% (15% haircut) | Level 2A + 2B cannot exceed 40% of total HQLA |
| Level 2B | Investment-Grade Corporate Bonds, Certain Equities | 50% (50% haircut) | Cannot exceed 15% of total HQLA |
This framework is not merely a regulatory exercise; it is a strategic blueprint for constructing a resilient balance sheet.
Practical Application: Calculating HQLA
Consider a bank with the following asset mix designated for its HQLA portfolio:
- $100 million in U.S. Treasury bonds (Level 1)
- $60 million in GSE mortgage-backed securities (Level 2A)
- $30 million in eligible investment-grade corporate bonds (Level 2B)
A surface-level view suggests $190 million in liquid assets. However, the regulatory calculation yields a different result.
- Level 1 Value: $100 million is valued at 100%, contributing $100 million.
- Level 2A Value: $60 million is valued at 85% (15% haircut), contributing $51 million.
- Level 2B Value: $30 million is valued at 50% (50% haircut), contributing $15 million.
The total calculated stock of HQLA is $166 million.
Next, we apply the composition caps. Total Level 2 assets ($51M + $15M = $66M) must not exceed 40% of total HQLA. Here, $66 million is 39.8% of $166 million, which is compliant. The Level 2B portion ($15M) is 9.0% of the total, well below its 15% cap.
This detailed analysis is where data intelligence platforms like Visbanking deliver significant value. They move beyond compliance checks to enable strategic benchmarking. Are your peers holding a higher percentage of Level 1 assets? Is your institution an outlier in its reliance on Level 2B? Answering these questions with data provides the intelligence needed to build a balance sheet that is both resilient and high-performing.
Forecasting Net Cash Outflows: The Denominator
If HQLA is a bank’s liquidity reserve, Total Net Cash Outflows represent the forecasted demand on that reserve. As the denominator of the LCR, this calculation is where rigorous analysis meets operational reality.
The process involves forecasting all potential cash drains over a 30-day period under a severe stress scenario. For bank leadership, mastering this calculation is not just a regulatory requirement; it is a critical assessment of the stability of the institution's funding base.
The calculation hinges on applying regulator-prescribed "run-off" rates to various liability classes and off-balance-sheet commitments. These rates are not arbitrary; they reflect empirical lessons on which funding sources are stable and which are prone to flight during a market panic.

Different Liabilities, Different Run-Off Rates
The primary variable in this calculation is the stability of a bank’s deposits. Regulators assign dramatically different run-off rates based on depositor type and relationship, sending a clear message: a stable, relationship-driven funding structure is paramount.
Stable Retail Deposits: These are the stickiest funds, primarily insured deposits from retail customers. They are assigned a low run-off rate, typically 3% to 5%, reflecting the confidence provided by federal deposit insurance.
Less-Stable Retail Deposits: This category includes uninsured deposits, high-yield accounts, and brokered deposits. These funds are more flight-prone and thus receive a higher run-off rate, often 10% or more.
Operational Deposits: These are balances from corporate clients used for daily operations such as clearing, custody, and cash management. While essential to the client, a portion is still assumed to depart. Run-off rates can range from 5% to 25%.
Unsecured Wholesale Funding: This represents the least stable funding. Deposits from non-financial corporates and sovereigns can see run-off rates from 20% up to 100%. Funding from other financial institutions is assumed to be lost entirely, receiving a 100% run-off rate.
The stark difference in these rates is a direct regulatory signal. The LCR framework heavily penalizes reliance on "hot money" and concentrated wholesale funding, rewarding banks with strong, diversified deposit franchises.
Example Outflow Calculation
Consider a hypothetical bank with $5 billion in relevant liabilities and commitments.
Liability Breakdown:
- Stable, insured retail deposits: $2,500 million
- Less-stable, uninsured retail deposits: $1,000 million
- Operational deposits from corporate clients: $800 million
- Unsecured wholesale funding (non-financial): $500 million
- Committed but undrawn credit lines to corporates: $200 million
Applying Run-Off Rates:
- Stable Retail Outflow: $2,500M x 3% = $75 million
- Less-Stable Retail Outflow: $1,000M x 10% = $100 million
- Operational Deposit Outflow: $800M x 25% = $200 million
- Wholesale Funding Outflow: $500M x 40% = $200 million
- Credit Line Drawdown Outflow: $200M x 10% = $20 million
The total projected gross cash outflow over the 30-day stress period is $595 million.
Factoring in Cash Inflows (with a Limit)
The LCR formula permits offsetting a portion of these gross outflows with expected cash inflows from performing assets, such as loan payments.
However, a crucial limitation applies: total eligible inflows are capped at 75% of total gross outflows. This cap ensures the ratio remains conservative by preventing assumptions that all expected income will materialize during a crisis.
To complete the example, assume the bank projects $300 million in inflows from fully performing loans.
- Total Gross Outflows: $595 million
- Maximum Allowable Inflows: $595M x 75% = $446.25 million
- Projected Inflows: $300 million (This is below the cap, so the full amount can be used).
Therefore, the Total Net Cash Outflow—the final denominator—is:
$595 million (Gross Outflows) - $300 million (Inflows) = $295 million
This calculation demonstrates the critical importance of precise data aggregation and classification. Every account must be categorized correctly. This is where modern data intelligence platforms are essential.
Systems like Visbanking automate data extraction from core systems, apply the correct regulatory logic, and provide the clarity needed for effective bank asset liability management. They transform a manual, error-prone process into a streamlined, auditable workflow. When executives can benchmark their liability mix and outflow profile against peers, the strategic implications become clear. If reliance on less-stable funding is an outlier, the data provides a clear mandate to pivot toward a more resilient funding strategy and a healthier LCR.
How the LCR Can Predict a Bank's Collapse
The Liquidity Coverage Ratio is more than a regulatory metric; it is a vital sign of an institution's capacity to survive a crisis. For bank executives, its predictive power is its greatest value. A strong, stable LCR signals a resilient institution. A declining LCR is an early warning that cannot be ignored.
The events of 2023 provided a harsh real-world lesson in this principle. The difference between banks that survived and those that failed often correlated directly with their pre-crisis LCR.
From Theory to Harsh Reality
Consider the contrast. U.S. Global Systemically Important Banks (GSIBs) consistently maintain LCRs averaging around 125%, well above the 100% minimum. This buffer is not accidental; it is a deliberate strategy to project strength, secure cheaper funding, and maintain operational flexibility in any market environment.
The case of Silicon Valley Bank illustrates the alternative. Post-mortem analysis revealed a far grimmer liquidity picture than its tailored regulatory reports suggested.
One analysis showed that under the full, standardized LCR rules, SVB’s ratio was a dangerously low 75%. The bank held $52.9 billion in HQLA against $71 billion in projected net cash outflows, driven by a highly concentrated and uninsured deposit base.
To meet the 100% minimum, SVB would have needed an additional $18 billion in HQLA. To match the 125% resilience of its GSIB peers, it would have needed $36 billion more. The full scale of this shortfall can be understood by reviewing the liquidity ratios of banks during this period.
The numbers are unambiguous. An $18 billion HQLA deficit is not a rounding error; it is a systemic failure warning. Calculated properly, the LCR revealed the fatal vulnerability.
Making the LCR a Forward-Looking Weapon
The key takeaway for banking leaders is to elevate the LCR from a backward-looking compliance report to a core component of forward-looking risk management. This requires moving beyond static, point-in-time calculations to dynamic stress testing.
By modeling specific "what-if" scenarios tailored to an institution's unique balance sheet and funding profile, the LCR becomes a powerful management tool that uncovers vulnerabilities a standard calculation might miss.
Consider these practical applications:
- Model a Deposit Run: What happens to your LCR if 10% of your uninsured deposits exit in 48 hours? This simulation immediately quantifies funding sensitivity and tests the adequacy of the HQLA buffer.
- Simulate Credit Line Drawdowns: How does your liquidity hold up if commercial clients draw down 25% of their committed credit lines in one week? This tests the bank’s true capacity to meet off-balance-sheet obligations under pressure.
Running these scenarios pinpoints the exact pressure points on the balance sheet. The resulting insights inform critical decisions on HQLA composition, funding diversification, and contingency planning. This is the essence of effective stress testing for banks—using data to prepare for the next crisis, not just report on the last one.
Platforms like Visbanking are designed for this strategic shift. By integrating regulatory, financial, and market data, we empower bank executives to run these models efficiently, benchmark against peers, and translate predictive analytics into decisive action.
Turning LCR Compliance Into a Competitive Edge
For many institutions, the Liquidity Coverage Ratio remains a defensive, compliance-driven exercise. The most forward-thinking banks, however, recognize that a robust LCR is not just a shield—it is a competitive weapon.
Maintaining a liquidity ratio well above the 100% minimum sends a powerful signal to the market. It communicates strength and stability to regulators, investors, and corporate depositors, which translates directly into a lower cost of funds and a more resilient balance sheet.
This principle is not new. While Basel III standardized the LCR in 2010, central banks have used similar liquid asset ratios for decades to manage credit and ensure economic stability. These historical liquidity policy tools shaped today's regulations, underscoring a timeless truth: a bank’s liquidity dictates its capacity for growth.
From Buffer to Bullish Advantage
In today's volatile environment, a liquidity advantage is more critical than ever. A strong buffer provides the freedom to act decisively, capitalizing on opportunities when less-prepared competitors are forced to retreat.
During a market downturn or credit crunch, banks operating near the 100% LCR threshold must turn inward. They hoard cash and curtail lending, focused solely on survival.
In contrast, a bank with an LCR of 125% operates from a position of strength. Its surplus HQLA is not just a rainy-day fund; it is dry powder, ready for strategic deployment.
A superior LCR enables a shift from defense to offense. It provides the confidence—and the capital—to make decisive moves when the market is in turmoil.
Real-World Opportunities Unlocked by a Strong LCR
A well-managed liquidity position creates tangible business opportunities that enhance profitability and market share. This is how the liquidity coverage ratio calculation evolves from a compliance task to a core component of the growth engine.
Acquiring Distressed Assets: When competitors are forced to deleverage, a liquid bank can acquire high-quality loan portfolios or securities at discounted prices, locking in future returns.
Winning High-Value Clients: During a crisis, a "flight to quality" occurs. A bank with a fortress-like balance sheet becomes a magnet for large corporate depositors seeking safety, attracting stable, low-cost funding when it is most valuable.
Supporting Core Customers: Perhaps most importantly, a strong LCR allows a bank to continue lending to its best clients when competitors cannot. This reliability builds deep, long-term loyalty that pays dividends for years.
Transforming Data Into Market Leadership
The key to unlocking this advantage is to move beyond viewing the LCR as a static, end-of-quarter figure. Leading institutions use data intelligence platforms to continuously benchmark their LCR and its components against their peers.
This practice transforms raw regulatory filings into strategic intelligence. By analyzing how top-performing banks structure their HQLA and manage outflows, executives can identify opportunities to optimize their own balance sheet for both safety and performance.
This is the clear differentiator between market leaders and followers. To see how your bank’s liquidity resilience compares, explore the peer benchmarking tools at Visbanking. Turning compliance data into a competitive weapon is the first step toward building a durable market advantage.
LCR FAQs: From Theory to Practice
Executing the Liquidity Coverage Ratio calculation requires both precision and strategic insight. Here are answers to common questions that arise as bank executives move from textbook definitions to real-world application.
What Are the Most Common Pitfalls in the LCR Calculation?
Two recurring errors consistently undermine the accuracy of the LCR: misclassification of High-Quality Liquid Assets (HQLA) and incorrect application of run-off rates to liabilities.
For example, classifying a corporate bond as a Level 2A asset when it only qualifies as Level 2B will materially overstate the HQLA buffer on paper. This simple mistake creates a dangerous illusion of liquidity.
Similarly, underestimating the outflow rates for operational deposits or committed credit facilities is a common blind spot. Assuming these funds are stickier than regulations prescribe in a stress scenario is a high-stakes gamble. Such errors often stem from manual processes and siloed data systems that cannot consistently enforce complex regulatory rules.
An accurate LCR is built on granular, high-integrity data. Without a single source of truth for asset and liability classifications, even minor errors can compound, resulting in a fundamentally flawed assessment of liquidity risk.
This is precisely where a robust data intelligence platform provides value. By automating data aggregation and applying regulatory logic systematically, these platforms prevent classification errors, ensuring a consistent, accurate, and auditable calculation every time.
How Often Should My Bank Really Be Checking Its LCR?
While regulatory reporting may be monthly, managing liquidity based on a monthly snapshot is like driving while looking only in the rearview mirror. Market conditions and depositor sentiment can shift in days, not weeks.
Leading institutions monitor their LCR and its key drivers daily. This high-frequency tracking enables treasury and risk teams to detect adverse trends early—such as a decline in the market value of HQLA or an anomalous spike in deposit outflows—and take corrective action long before a material risk develops. This transforms the LCR from a static compliance report into a dynamic dashboard for strategic decision-making.
Why Should We Aim for an LCR Well Above 100%?
Maintaining a significant LCR buffer, such as in the 120%-130% range, is not mere conservatism; it is a strategic imperative. A strong LCR position benefits the institution in three critical ways.
First, it signals financial strength to regulators, investors, and wholesale funding counterparties. This reputation can directly lower borrowing costs and improve access to capital markets.
Second, it provides an essential operational cushion, allowing the bank to absorb unexpected liquidity shocks without breaching the 100% regulatory minimum and triggering heightened supervisory scrutiny.
Finally, and most importantly, a superior liquidity position enables the bank to play offense when others are on defense. It provides the capital and confidence to acquire attractive assets or onboard high-quality clients while competitors are constrained.
At Visbanking, we help you turn complex regulatory data into a clear competitive edge. Our platform brings together financial, regulatory, and market data so you can perfect your LCR calculation, see how you stack up against your peers, and spot strategic opportunities. Ready to move from just looking at dashboards to making decisive moves? See how our intelligence system can strengthen your bank. Learn more at https://www.visbanking.com.
Related Articles

Visbanking Blog
How Bank Liquidity Coverage Ratios Impact Your Deposits

Visbanking Blog
Why Your Bank's Tier 1 Capital Ratio Could Save It From Crisis

Visbanking Blog
ROA vs ROE: Which Banking Metric Predicts Future Success?

Visbanking Blog
How Bank Efficiency Ratios Reveal Hidden Operational Costs

Visbanking Blog
Bank Efficiency Ratio Explained: What 60% Really Means

Visbanking Blog