A Guide to Bank Capital Ratios for Bank Executives
Brian's Banking Blog
Bank capital ratios are not a regulatory checkbox. They are the language of financial strength, a clear signal of your institution's risk appetite and strategic direction. Viewing capital adequacy as a mere constraint is a fundamental error. It is the foundational lever for navigating economic cycles, executing strategy, and unlocking sustainable growth. For bank executives and directors, a sophisticated understanding of these metrics directly impacts resilience, profitability, and competitive positioning.
Beyond Compliance: Capital Ratios as a Strategic Instrument
Bank leadership constantly balances regulatory demands with shareholder returns. This tension places capital management at the nexus of every strategic conversation.
The core ratios—CET1, Tier 1, and Total Capital—are not static figures for a call report. They are dynamic tools for balance sheet optimization, market signaling, and confident capital allocation. These metrics dictate your capacity for loan growth, your ability to weather economic stress, and your competitive posture.

Historically, the emphasis on a robust capital base has been cyclical. In the mid-19th century, U.S. banks were funded with over 50% equity, creating a formidable cushion to absorb shocks. In contrast, in the years preceding the 2007-2008 financial crisis, some major institutions operated with equity ratios as low as 1.5%. This razor-thin capitalization magnified systemic fragility.
From Regulatory Burden to Strategic Advantage
Viewing capital ratios solely through a compliance lens is a significant missed opportunity. While meeting minimums is non-negotiable, the strategic value is unlocked when these metrics are used to drive performance.
A sound capital strategy informs critical operational decisions:
- Loan Growth: Defines the precise capacity for lending expansion without breaching regulatory thresholds.
- Dividend Policy: Assesses the ability to return capital to shareholders while maintaining a prudent buffer.
- Strategic Investments: Evaluates M&A or technology upgrades based on their quantifiable impact on capital.
- Risk Appetite: Ensures the bank’s risk profile is aligned with its capital strength, fostering long-term stability.
The objective is to convert a regulatory requirement into a competitive edge. A well-capitalized bank is perceived as safer by depositors, more reliable by counterparties, and better positioned to seize opportunities during market dislocations.
For a broader perspective on building robust controls, this strategic guide to risk management frameworks provides valuable context.
Capital management is a continuous discipline, not an annual exercise. To make informed decisions, leadership requires clear, actionable intelligence. Data platforms like Visbanking transform mountains of complex regulatory data into the strategic insights necessary for effective governance.
Deconstructing the Core Components of Bank Capital
To effectively manage capital, one must understand its distinct layers. A bank's capital structure is not a single wall but a tiered defense, with each layer designed to absorb losses in a specific order and at a different cost.
At the core is Common Equity Tier 1 (CET1) capital. This is the highest-quality, most loss-absorbent capital, comprising primarily common stock and retained earnings. As the ultimate shock absorber with no servicing costs or maturity date, CET1 ensures a bank remains a going concern even under severe stress.
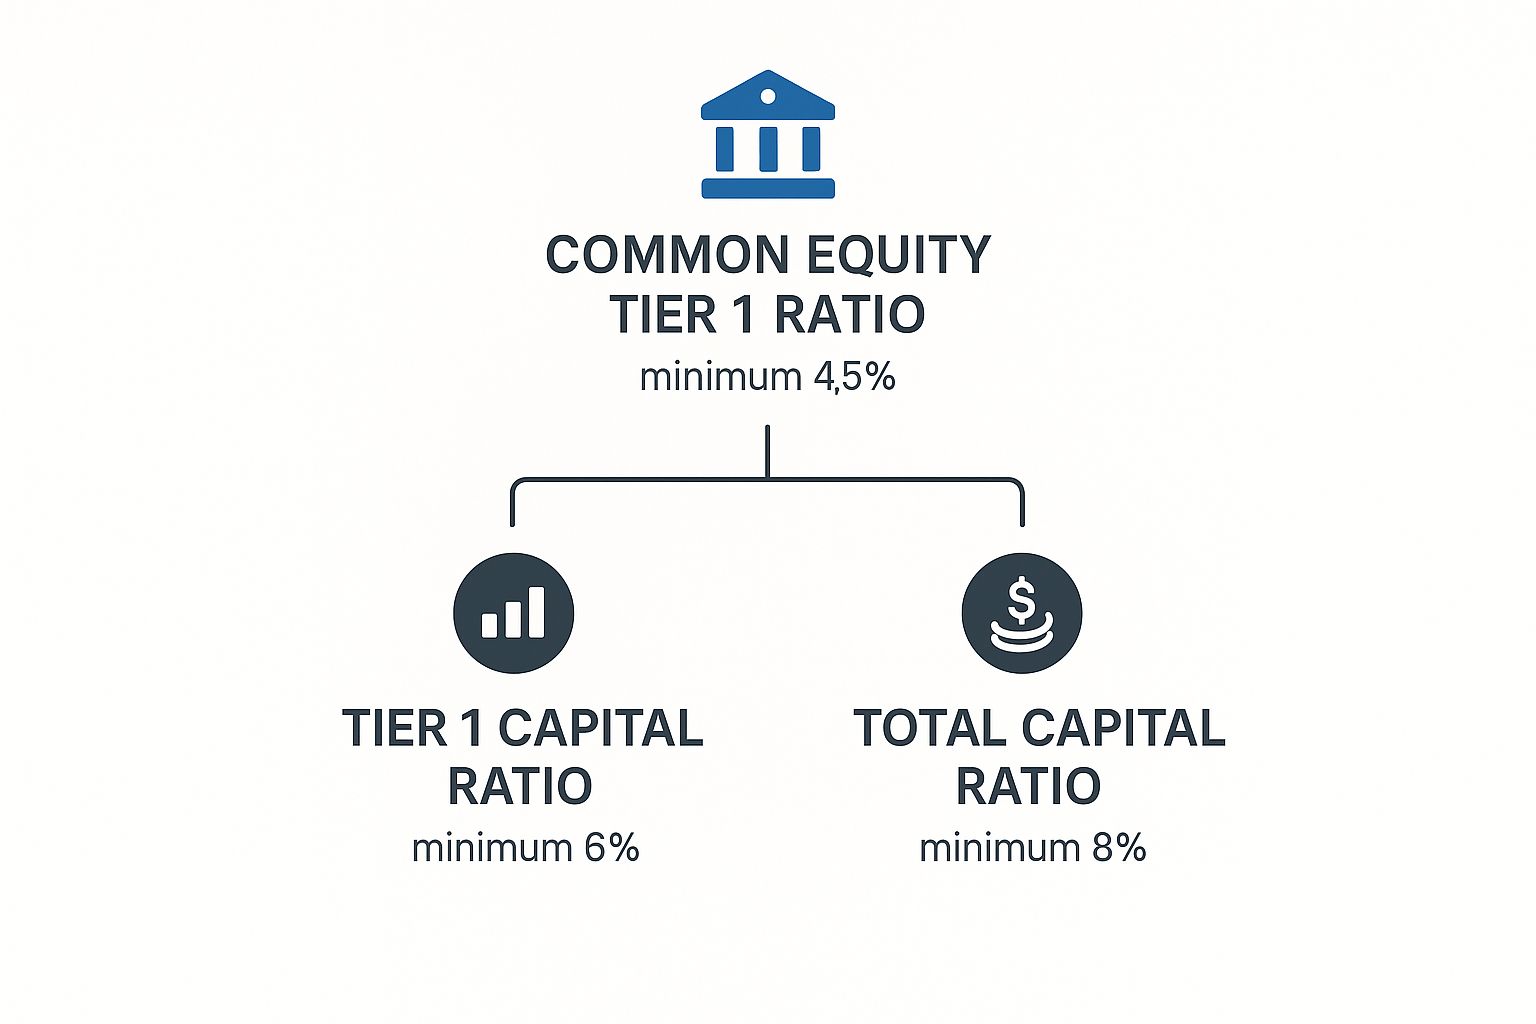
As this visualization shows, each tier builds upon the previous one, creating a cumulative buffer against the bank's risk-weighted assets.
The Supplementary Tiers: AT1 and T2
Beyond CET1, supplementary layers enhance loss-absorption capacity, albeit with different characteristics and costs.
- Additional Tier 1 (AT1) Capital: Typically consists of instruments like perpetual preferred stock. It is subordinate to deposits but senior to common equity. AT1 can support a bank during periods of stress without triggering insolvency but is more expensive than CET1.
- Tier 2 (T2) Capital: Represents the outer layer of defense. Composed of instruments such as subordinated debt and a portion of loan loss reserves (up to 1.25% of risk-weighted assets), T2 is designed to absorb losses in a "gone-concern" scenario to protect depositors. T2 instruments have a fixed maturity, making them less permanent than Tier 1 capital.
The decision to issue subordinated debt (T2) versus preferred stock (AT1) is a direct trade-off between the bank's cost of funds, its risk profile, and its resilience under pressure. This is a strategic choice, not merely a financial one.
Post-crisis regulations, notably Basel III, formalized these structures, requiring a minimum total capital of 8% of risk-weighted assets. For globally systemically important banks (G-SIBs), additional buffers can push this requirement toward 13%. Despite these rules, bank equity levels remain far below those of non-financial corporations, where 50% equity is common. A deeper analysis of bank capital historical trends reveals why leverage continues to be a central topic in banking.
This table provides a concise strategic overview of the capital tiers.
Strategic Overview of Regulatory Capital Tiers
| Capital Tier | Primary Components | Key Function | Strategic Implication for Executives |
|---|---|---|---|
| Common Equity Tier 1 (CET1) | Common Stock, Retained Earnings | Highest quality loss absorption while the bank is a "going concern" | The foundation of resilience; a higher CET1 ratio signals stability but can dilute ROE. |
| Additional Tier 1 (AT1) | Perpetual Preferred Stock, Hybrids | Provides extra loss absorption capacity under stress, senior to equity | A flexible tool to bolster Tier 1 capital, but more expensive than CET1. Balances strength and cost. |
| Tier 2 (T2) | Subordinated Debt, Loan Loss Reserves | Absorbs losses in a "gone-concern" or failure scenario to protect depositors | The cheapest form of regulatory capital; used to optimize capital structure and ROE, but offers less protection for a living bank. |
Data-Driven Capital Structure Decisions
The optimal capital mix is not a universal formula; it is a strategic decision informed by data. The right structure balances resilience, cost, and growth appetite.
For example, a bank pursuing aggressive loan growth requires a robust CET1 base to support the corresponding increase in risk-weighted assets without diluting its capital ratios. Conversely, a bank focused on maximizing return on equity may strategically utilize more Tier 2 capital due to its lower cost relative to equity.
This is where peer benchmarking becomes indispensable. Using a platform like Visbanking allows executives to analyze their capital structure against a precisely defined peer group. If peer institutions consistently maintain higher CET1 ratios, it signals a market or regulatory expectation for greater resilience. This data-driven insight transforms capital planning from a compliance exercise into a strategic imperative.
The Strategic Importance of Risk-Weighted Assets
Capital is only one side of the equation. The denominator, Risk-Weighted Assets (RWA), represents the tangible manifestation of a bank's risk appetite and is a powerful lever for optimizing financial performance.
RWA methodology assigns different weights to assets based on their perceived credit risk. Cash and U.S. Treasury securities carry a 0% risk weight, requiring no capital backing. A standard commercial loan, however, is typically assigned a 100% risk weight, requiring a full capital allocation.

This framework compels a critical strategic question for every asset decision: Does the expected return justify the capital it consumes?
Managing the Denominator as a Strategic Lever
Optimizing the asset mix is as crucial as managing capital levels. A dollar of capital can support a significantly larger portfolio of low-risk assets than high-risk ones. This dynamic has direct implications for growth, profitability, and shareholder returns.
Consider two banks, each with $100 million in Tier 1 capital and a target 10% Tier 1 Capital Ratio:
- Bank A originates $200 million in high-quality residential mortgages with an average 50% risk weight. Its RWA is $100 million ($200M * 50%).
- Bank B originates $100 million in unsecured commercial loans with a 100% risk weight. Its RWA is $100 million ($100M * 100%).
The takeaway is clear. Bank A supported twice the asset volume with the same amount of capital. This superior capital efficiency creates capacity that can be deployed to support further lending, invest in technology, or return value to shareholders.
From Risk Weights to Actionable Intelligence
This principle applies across the entire balance sheet. The challenge for executives is to accurately model how shifts in lending and investment strategy will impact the bank’s overall capital position. This requires robust data intelligence.
A proactive, data-driven approach includes:
- Portfolio Stress Testing: Modeling how an economic downturn could alter the risk profile of the loan book and inflate RWA.
- Strategic Planning: Quantifying the capital impact of a new lending product before committing resources.
- Pricing Discipline: Ensuring loan pricing covers not only credit risk and operational costs but also the "cost" of the capital required.
RWA optimization is not about risk avoidance. It is about taking the right risks—those that are consciously chosen, appropriately priced, and supported by a clear understanding of their capital impact.
This focus intensified globally after the 2008 financial crisis. An analysis of global banking capital trends shows that while banks in G7 countries significantly increased their capital ratios, U.S. banks have maintained a consistently strong Tier 1 capital position through strategic balance sheet management.
Mastering the denominator of capital ratios provides a significant competitive advantage. Using precise data intelligence, executives can build a more efficient balance sheet that generates a higher return for every dollar of capital held. Platforms like Visbanking provide the tools to benchmark RWA density against peers, identifying opportunities to optimize the asset mix and drive smarter capital decisions.
Calculating and Interpreting Key Capital Ratios
Here, abstract concepts become tangible measures of your bank’s financial health. For executives and directors, the critical skill is not merely knowing the formulas but translating these percentages into a coherent narrative about financial strength, risk appetite, and growth capacity.
The formulas are straightforward, comparing a specific component of capital to risk-weighted assets (RWA):
- Common Equity Tier 1 (CET1) Ratio = CET1 Capital / RWA
- Tier 1 Capital Ratio = Tier 1 Capital / RWA
- Total Capital Ratio = Total Capital / RWA
The true value lies in understanding what these numbers communicate to regulators, investors, and internal leadership.

A Practical Example
Consider a hypothetical institution, "First National Commercial Bank," with the following profile:
- CET1 Capital: $120 million
- Additional Tier 1 Capital (AT1): $25 million
- Tier 2 Capital: $30 million
- Risk-Weighted Assets (RWA): $1.2 billion
The resulting capital ratios are:
- CET1 Capital Ratio: ($120M / $1,200M) = 10.0%
- Tier 1 Capital Ratio: (($120M + $25M) / $1,200M) = 12.08%
- Total Capital Ratio: (($120M + $25M + $30M) / $1,200M) = 14.58%
While First National is comfortably above regulatory minimums, the analysis cannot end there. The strategic question for its board is: what does a 12.08% Tier 1 Capital Ratio enable us to do? For a deeper analysis, our guide on why the Tier 1 capital ratio matters explores this in detail.
Interpreting the Ratios for Strategic Action
A ratio is never simply "good" or "bad"; its meaning is derived from market context, peer performance, and the bank's strategic objectives.
First National's 10.0% CET1 ratio signals a solid cushion of high-quality capital, indicating it can absorb significant, unexpected losses. It is a powerful signal of resilience. However, the trend is as important as the absolute number. Is the ratio increasing, suggesting conservatism or capital hoarding? Or is it decreasing, signaling aggressive growth, capital returns, or deteriorating asset quality?
The executive's critical task is to understand the why behind the movement. Is a decline in the CET1 ratio the result of a deliberate strategic decision to deploy capital for growth, or is it an early warning sign of weakening fundamentals?
One is a sign of strategic control; the other is a red flag. Answering this requires looking beyond the headline number and digging into the drivers within the loan and investment portfolios. This is precisely why data intelligence tools are essential. A platform like Visbanking enables leadership to analyze trends, benchmark against a curated peer group, and model the impact of future strategic moves. It transforms capital ratios from rearview mirror metrics into a powerful navigational tool.
Benchmarking Your Capital Ratios Against Peers
Your bank’s capital ratios are not internal metrics. They are a public declaration of your strategy to the market, regulators, and competitors. Are you over-capitalized and sacrificing returns, or are you operating too leanly, exposing the institution to undue risk?
Answering these questions requires rigorous peer benchmarking. This means moving beyond a simple list of local competitors to construct a meaningful peer group based on asset size, business model, and geographic focus to ensure an apples-to-apples comparison.
From Data Points to Strategic Insights
The purpose of benchmarking is to identify variances and understand their root causes. A higher RWA density compared to peers may indicate a riskier loan portfolio or a less capital-efficient asset mix. A top-quartile CET1 ratio could signal fortress-like strength or inefficiently deployed 'lazy capital' that is depressing return on equity.
Consider a bank with a 12.5% CET1 ratio. This appears strong in isolation. However, if a benchmark analysis against a custom peer group of top-performing banks reveals an average of 10.8%, a strategic question emerges. That 170-basis-point gap represents a significant pool of capital that could be deployed to:
- Fund a strategic acquisition.
- Invest in critical technology to enhance efficiency.
- Support a targeted expansion into a high-return lending vertical.
Without peer context, this opportunity remains invisible. This is how a powerful data platform provides a competitive edge, converting public call report data—available through resources like the FDIC Bank Find service—into a clear strategic roadmap.
The following table illustrates how benchmarking can surface actionable insights.
Hypothetical Peer Group Capital Ratio Comparison
| Metric | Your Bank | Peer Average | Top Quartile Peer | Strategic Insight |
| :--- | :--- | :--- | :--- |
| CET1 Ratio | 12.5% | 10.8% | 10.2% | Potential for capital deployment; are we too conservative? |
| RWA Density | 75% | 68% | 65% | Our assets require more capital; indicates higher risk or less efficiency. |
| Return on Equity | 9.2% | 11.5% | 12.8% | The peer group is generating higher returns with less capital. |
The narrative is clear: "Your Bank" holds more capital against a riskier or less efficient asset base, resulting in subpar profitability relative to its peers. This is a board-level insight.
Benchmarking transforms capital management from a defensive, compliance-driven exercise into an offensive, strategic discipline. It forces a justification of the bank's capital position not just against regulatory minimums, but against the performance of its most successful competitors.
This discipline is critical as regulations evolve. Understanding your current position provides the context to prepare for future requirements, such as the bank capital rule changes proposed by U.S. regulators. Benchmarking drives smarter questions and ensures your capital strategy is not just compliant, but competitive.
Turning Capital Insights Into Executive Action
Data is inert until it informs a better decision. For bank executives, mastering capital ratios separates a compliance mindset from a strategic one. It is about translating balance sheet metrics into tangible actions—how a loan is priced, the structure of a dividend policy, or the viability of an M&A transaction.
Effective capital management is a daily discipline, not a quarterly fire drill. The objective is to ensure every dollar of capital is working efficiently, generating returns while fortifying the institution against market volatility. This requires a forward-looking perspective grounded in data.
From Monitoring to Execution
With a firm grasp of the data, the conversation about capital transforms. Instead of merely reporting that the CET1 ratio is 11.5%, leadership can articulate how that capital level directly supports specific strategic initiatives.
Consider a bank evaluating an acquisition. A compliance-focused approach would simply run pro-forma numbers to ensure they clear regulatory hurdles. A data-driven, strategic team models the deal's impact on RWA density, projects the combined entity's capital generation capacity, and benchmarks the new structure against a revised peer group.
The question must shift from, "Are we compliant?" to, "Is our capital position optimized to win?" This forces a more sophisticated analysis of the trade-offs between risk, return, and growth.
This proactive stance is more critical than ever. As a 2023 analysis noted, the global banking industry's CET1 ratio stood at approximately 12.8% of risk-weighted assets. While this signals resilience, it also intensifies the competition for capital efficiency. You can see for yourself how capital strength is driving returns in global banking.
A Framework for Decision-Making
An effective capital strategy is not confined to a spreadsheet; it is embedded in the fabric of executive decision-making.
- Loan and Asset Pricing: Pricing models must account for the cost of regulatory capital required to hold an asset, in addition to credit risk and funding costs.
- Dividends and Buybacks: Capital distribution plans should be informed by peer benchmarks and stress tests to satisfy shareholders without compromising stability and growth capacity.
- Strategic Growth: Before entering a new market, launching a product, or executing an acquisition, the precise capital impact must be modeled to eliminate surprises.
Ultimately, capital ratios should be treated as dynamic levers for steering the institution. An intelligence platform that monitors your position and benchmarks it against the market provides the clarity and confidence needed to make decisive calls.
Explore how Visbanking provides the critical intelligence to benchmark your performance and drive decisive action.
Burning Questions on Bank Capital
Effective management begins with clear understanding. For bank leadership, mastering the core capital metrics and their strategic implications is non-negotiable. Here are answers to common questions that arise in the boardroom.
How Does the Tier 1 Leverage Ratio Differ from Risk-Based Ratios?
The Tier 1 Leverage Ratio is a simple, non-risk-weighted backstop. It measures Tier 1 capital against total average assets, acting as a blunt constraint on balance sheet growth regardless of asset composition. Risk-based ratios, such as the CET1 ratio, are more nuanced. They measure capital against risk-weighted assets (RWA), directly linking capital requirements to the specific risks undertaken in the loan and investment portfolios. Both must be managed in concert; the leverage ratio controls overall size, while risk-based ratios ensure capitalization is adequate for the risks assumed.
What Are the Strategic Implications of Capital Buffers?
Capital buffers, such as the Counter-Cyclical Capital Buffer (CCyB) or the G-SIB surcharge, are mandatory layers of capital held above regulatory minimums. Strategically, they function as governors on risk appetite. While they can constrain return on equity by sequestering capital, their primary purpose is to ensure stability. Breaching a capital buffer is a significant regulatory flag that can restrict discretionary payments like dividends and bonuses—a scenario every board strives to avoid.
Is Holding Excess Capital a Good Strategy?
Maintaining capital levels significantly above minimums can create a fortress balance sheet, providing a substantial safety cushion and a war chest for strategic opportunities, such as acquiring a distressed competitor.
The challenge, however, is that this capital can be a drag on return on equity (ROE) if not deployed efficiently. The optimal level is a strategic decision that balances fortress-like safety with shareholder returns.
This is where rigorous peer benchmarking is essential. It provides the context to determine whether high capital levels constitute a true competitive advantage or are merely depressing performance.
How Does Interest Rate Risk Affect Capital Ratios?
Significant movements in interest rates can cause substantial fluctuations in the market value of a bank's assets and liabilities, particularly fixed-income securities in the investment portfolio. For most banks, unrealized losses on available-for-sale (AFS) securities flow through to accumulated other comprehensive income (AOCI), which can directly reduce regulatory capital and compress ratios. This elevates proactive asset-liability management (ALM) and robust stress testing from routine functions to strategic imperatives. Leadership must model the impact of various rate scenarios on capital to avoid having market volatility dictate the bank's strategic options.
Your bank's performance is defined by the decisions you make every day. At Visbanking, we provide the critical intelligence to benchmark your performance, understand your competitive landscape, and turn complex data into decisive action. Explore how our platform can sharpen your strategic edge.
Latest Articles

Brian's Banking Blog
Customer Churn Prediction: A Practical Guide for Banks

Brian's Banking Blog
Social Network Analysis for Banking: A Practical Guide

Brian's Banking Blog
How to Increase ROE: A Data-Driven Playbook for Bank Leaders

Brian's Banking Blog
What Is SEC EDGAR and How Banks Use the Data

Brian's Banking Blog
What Is Value at Risk and Why Bank Leaders Rely on It

Brian's Banking Blog