A Strategic Guide to Bank Capital Ratios for Executives
Brian's Banking Blog
Bank capital ratios are the definitive metric for regulators, investors, and executives gauging a bank's financial strength and its capacity to absorb unexpected losses. In essence, a capital ratio measures a bank's own capital against its risk-weighted assets. It is the financial cushion that protects depositors and preserves systemic stability. A higher ratio signals resilience; a lower one demands immediate strategic attention.
For a leadership team, these are not mere compliance figures. They are the fundamental drivers of strategic capacity.
Using Bank Capital Ratios as a Strategic Tool

Treating bank capital ratios as a regulatory compliance exercise is a significant strategic miscalculation. For any forward-thinking bank leader, these metrics are more than a defensive shield. They are a powerful tool for calibrating risk appetite, assessing resilience, and defining competitive positioning.
When capital adequacy is viewed as a compliance checkbox, leadership overlooks its direct impact on the bank's operational and growth potential. Every significant decision—from launching a new lending product to expanding into a new market—is either enabled or constrained by your capital position.
Moving Beyond Compliance to Competitive Insight
Transitioning from a compliance mindset to a strategic one begins with interpreting the narrative told by your numbers. Your bank’s Common Equity Tier 1 (CET1), Tier 1, and Total Capital ratios are not just data points for a regulatory filing. They are direct indicators of your bank's capacity to:
- Withstand Economic Headwinds: Robust capital levels provide the necessary buffer to absorb loan losses during a downturn without jeopardizing solvency.
- Execute on Growth Opportunities: A strong capital base enables confident credit extension, asset acquisition, or technology investments while less-capitalized competitors are forced to retrench.
- Manage Shareholder Returns: Effective capital management has a direct impact on return on equity (ROE) and the ability to sustain dividend payments.
The critical importance of this was demonstrated in the aftermath of the 2007-08 financial crisis. Global regulators, particularly in G7 nations, increased capital requirements to fortify the banking system. Between 2009 and 2021, banks significantly enhanced their loss-absorption capacity. U.S. banks, for example, maintained an average 8.5% Tier 1 capital to total assets ratio, signaling a clear focus on resilience. A detailed analysis of these post-crisis capital trends and their implications is available from the OCC.
A bank that manages only to the regulatory minimum is perpetually on the defensive. True strategic advantage is gained by using capital as a tool to dictate terms on risk and growth, far above the baseline.
By proactively managing bank capital ratios with precise data intelligence, executives can navigate market volatility and unlock sustainable growth. The objective is not merely to stay above the regulatory floor, but to optimize your capital position relative to peers. Using robust benchmarking data from platforms like Visbanking, you can precisely assess your standing and convert a compliance burden into a source of strategic foresight.
Deconstructing The Core Capital Ratios
Bank executives must be fluent in the language of capital ratios—what they measure and what they signal. These metrics define your institution's resilience, risk capacity, and operational freedom. They represent distinct but interconnected layers of financial strength.
CET1, Tier 1, and Total Capital
At the core of a bank’s capital structure is the Common Equity Tier 1 (CET1) ratio. This represents the purest form of capital: common stock, retained earnings, and other comprehensive income. It is the highest-quality, most loss-absorbing capital available. A strong CET1 ratio is a powerful signal to regulators and the market of a bank's ability to withstand a severe economic shock.
Building upon this is the Tier 1 Capital ratio, which includes all CET1 capital plus other high-quality, loss-absorbing instruments, such as qualifying preferred stock. It remains a measure of high-grade capital, providing a broader view of a bank's ongoing viability. For a deeper analysis of this metric, our guide on why the Tier 1 capital ratio matters details its role in regulation and institutional safety.
The image below illustrates the composition of capital requirements under the Basel III framework, showing how each tier builds upon the last.
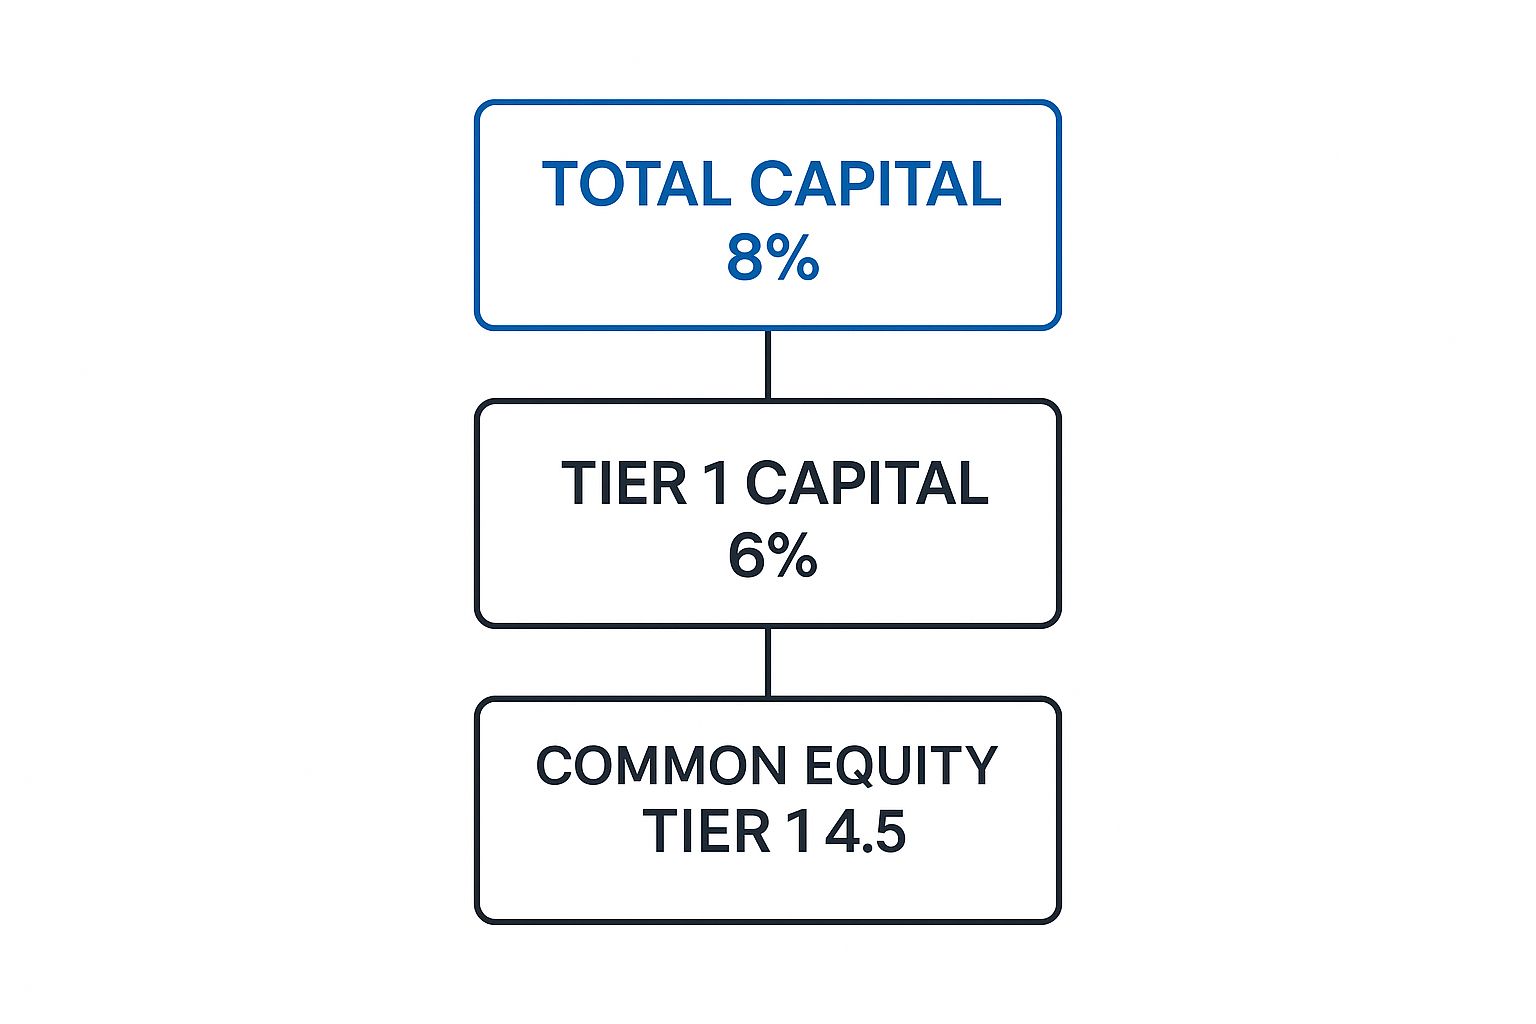
This visual clarifies that CET1 forms the non-negotiable foundation, with Tier 1 and Total Capital providing successive layers of protection.
How The Math Works
The capital itself is only half of the equation. Each tier is measured against the bank's Risk-Weighted Assets (RWA). The RWA denominator makes the ratio meaningful by adjusting asset values based on their inherent risk.
The formulas are direct:
- CET1 Capital Ratio = Common Equity Tier 1 Capital / Risk-Weighted Assets
- Tier 1 Capital Ratio = Tier 1 Capital / Risk-Weighted Assets
- Total Capital Ratio = (Tier 1 Capital + Tier 2 Capital) / Risk-Weighted Assets
Tier 2 capital is the final layer, comprising subordinated debt and general loan loss reserves. It provides a supplementary cushion but is considered less reliable than Tier 1 capital.
Consider a practical example. "Executive Bank" reports the following:
- CET1 Capital: $120 million
- Additional Tier 1 Capital: $30 million
- Tier 2 Capital: $50 million
- Risk-Weighted Assets: $1.5 billion
Its capital ratios are calculated as:
- CET1 Capital Ratio: $120M / $1.5B = 8.0%
- Tier 1 Capital Ratio: ($120M + $30M) / $1.5B = 10.0%
- Total Capital Ratio: ($120M + $30M + $50M) / $1.5B = 13.3%
Executive Bank is comfortably above the regulatory minimums. However, merely meeting these thresholds is not the strategic goal. True insight is derived from benchmarking these figures against peers.
This table summarizes the essential aspects of each primary capital ratio.
Key Capital Ratios at a Glance
| Capital Ratio | Primary Components (Numerator) | Denominator | Strategic Purpose |
|---|---|---|---|
| CET1 Capital Ratio | Common stock and retained earnings | Risk-Weighted Assets (RWA) | Measures the highest-quality capital; core indicator of a bank's ability to absorb losses. |
| Tier 1 Capital Ratio | CET1 + qualifying preferred stock and other instruments | Risk-Weighted Assets (RWA) | A broader measure of high-quality capital, reflecting ongoing operational viability. |
| Total Capital Ratio | Tier 1 + Tier 2 capital (e.g., subordinated debt) | Risk-Weighted Assets (RWA) | The most comprehensive view of a bank's capital adequacy, including supplementary capital cushions. |
| Leverage Ratio | Tier 1 Capital | Average Total Consolidated Assets | A non-risk-based backstop to prevent excessive leverage, regardless of asset risk profile. |
A firm grasp of these distinctions is fundamental to effective capital planning and communicating your bank's financial health to stakeholders.
The Leverage Ratio: A Different Perspective
Finally, the Leverage Ratio provides a crucial, non-risk-based backstop. It is calculated by dividing Tier 1 capital by the bank’s average total consolidated assets.
The Leverage Ratio acts as a safeguard, ensuring a bank does not become overextended, even with a portfolio of assets assigned low risk weights. It is a raw measure of leverage that prevents a dangerous buildup of systemic exposure.
This ratio gained prominence after the financial crisis as regulators sought to prevent banks from accumulating assets like Treasury securities—which carry a zero-risk weighting for RWA-based ratios—without an adequate capital buffer. For some of the largest banks, the leverage ratio is now the primary constraint on growth.
Mastering these ratios is not an academic exercise; it is the foundation of strategic capital management. With a clear picture of your bank's capital structure, you can leverage data intelligence platforms to benchmark these metrics against true peers and transform a compliance requirement into a competitive advantage.
Why Your Strategy Lives and Breathes in Risk-Weighted Assets

In executive and board-level discussions about capital ratios, the focus often gravitates toward the numerator—the amount of CET1 or Tier 1 capital. However, the true narrative of a bank's strategy is found in the denominator: Risk-Weighted Assets (RWA).
This figure is far more than a regulatory line item. It is a direct reflection of your bank's business model, risk appetite, and strategic priorities. RWA is the engine that dictates your capital requirements. The system assigns a specific risk weight to every asset on your balance sheet. A U.S. Treasury bond receives a 0% weight. A speculative commercial construction loan or a portfolio of non-performing assets could be weighted at 150% or higher.
The objective is to ensure capital requirements are directly proportional to the risks undertaken. This is where strategy becomes tangible. Every loan originated, every investment purchased, and every new market entered directly impacts your RWA.
How Your Asset Mix Tells Your Strategic Story
Consider two banks, each with $1 billion in total assets. Their capital ratios, driven by strategic choices, will tell very different stories.
Bank A (The Conservative Lender): This institution focuses on fundamentals. Its balance sheet consists primarily of high-quality residential mortgages, stable municipal bonds, and a significant holding of Treasury securities. This low-risk profile results in a lean RWA of $700 million.
Bank B (The Growth-Oriented Lender): This institution is pursuing higher yields through aggressive commercial real estate lending, construction financing, and small business loan expansion. This riskier strategy inflates its RWA to $950 million.
Assume both banks hold $95 million in Tier 1 capital. The impact on their ratios is stark.
Bank A maintains a 13.6% Tier 1 Capital Ratio, providing substantial capacity for growth, dividends, or strategic initiatives. Bank B, however, operates at a much tighter 10.0%. It is closer to regulatory minimums and possesses far less strategic flexibility. This is not an accounting exercise; it is the direct mathematical consequence of strategic decisions. Bank B's high-risk, high-reward model demands a thicker capital cushion, tying up resources that could otherwise be deployed.
Using RWA Modeling to Make Smarter Decisions
Knowing your current RWA is table stakes. Strategic leadership involves modeling how future decisions will impact this number before capital is committed.
Suppose your executive team is considering a major expansion of its commercial and industrial (C&I) lending portfolio. Historically, this required cumbersome spreadsheet analysis and educated guesses. In today's market, such guesswork is a liability. A dynamic, data-driven approach is essential.
Your RWA is the cost of your strategy expressed in capital terms. Every basis point increase in RWA density (RWA divided by Total Assets) must be justified by a corresponding increase in expected return.
This is where a platform like Visbanking provides a decisive advantage. You can simulate the precise impact of adding $100 million in new C&I loans with an average 100% risk weight. The pro-forma effect on your RWA and all capital ratios is immediately visible.
This enables you to obtain concrete answers to critical questions:
- How does this initiative impact our CET1 ratio and our buffer above the regulatory minimum?
- Do the projected returns on these new loans justify the capital required to support them?
- How will our new RWA density compare to peers already active in this market?
This level of foresight transforms capital planning from a reactive, compliance-driven task into a proactive, strategic weapon. It provides executives the confidence to make bold decisions, backed by a clear understanding of the capital consequences.
To see how your institution's RWA and capital position stack up, you can benchmark your performance against peers with our data tools.
How Do You Stack Up? Benchmarking Your Capital Position
A bank’s capital ratios are meaningless in isolation.
An 11% Tier 1 ratio may seem secure, but if direct competitors operate efficiently at 9.5%, you could be sacrificing shareholder returns. Conversely, an 8.5% ratio appears precarious if the peer average is 10%, inviting increased regulatory scrutiny.
Strategic insight emerges when you know precisely where you stand. Peer benchmarking transforms abstract numbers into a competitive roadmap, compelling leadership to address critical questions. Are we overly conservative, constraining growth to maintain an excessive capital buffer? Or are we operating with insufficient cushion, exposing the bank to undue risk?
The answers shape everything from growth initiatives and dividend policy to survivability in the next economic downturn. Without this context, you are operating blind.
What Peer Ratios Reveal About Strategy
Consider two regional banks of similar size and business mix. Bank A has a Common Equity Tier 1 (CET1) ratio of 12%. Its rival, Bank B, operates at a leaner 9.5%. This is not merely a numerical difference; it signals two distinct strategic playbooks.
- Bank A (12% CET1): This institution is prioritizing fortification. Its larger capital cushion may indicate a conservative risk appetite, preparation for a recession, or positioning for a major acquisition.
- Bank B (9.5% CET1): This bank is focused on capital efficiency. By operating with a smaller buffer, it can enhance its Return on Equity (ROE), potentially leading to higher dividends or increased reinvestment in technology and lending programs.
Neither strategy is inherently superior, but the divergence demands analysis. Bank A's board must question whether its caution is inhibiting growth. Bank B's executives must be certain their risk models justify the thinner margin of safety.
Benchmarking isn’t about conforming to the average. It’s about understanding the strategic bets your peers are making. It provides the context to either defend your capital strategy or recognize the need for adjustment.
This dynamic extends globally. World Bank data reveals significant variations in bank capital-to-asset ratios. Emerging markets like Argentina (18.3%) and Armenia (13.7%) maintain large capital buffers to manage economic volatility. In contrast, developed markets like Australia (5.9%) and Belgium (5.7%) operate with leaner capital structures. Exploring these global variations in bank capital adequacy provides a broader perspective.
From Stale Data to Smart Decisions
Historically, meaningful peer analysis was a cumbersome process reliant on delayed quarterly call reports. This meant any analysis was outdated upon completion. In today's dynamic market, such a lag is a significant competitive handicap.
Modern data intelligence tools fundamentally change this paradigm.
Instead of analyzing last quarter's data, you gain a live, granular view of the current landscape. You can look beyond a competitor's headline CET1 ratio to dissect the underlying drivers—their RWA density, asset composition, and growth trends. You uncover the why behind their numbers.
This enables a shift from simple comparison to sophisticated strategic modeling. You can filter peer groups by asset size, geography, or business model to ensure an apples-to-apples comparison. With this clarity, you can answer tough questions with confidence and build a capital strategy that is both prudent and powerful.
To see how your bank's capital ratios truly measure up, you need a tool that delivers instant, accurate peer analysis. Start by exploring how Visbanking’s data intelligence can benchmark your performance and turn competitive data into your next strategic advantage.
Navigating Regulatory Buffers and Capital Efficiency

Falling below regulatory capital minimums is a strategic failure with immediate and severe business consequences. Meeting these minimums is merely the entry point; the strategic game is played in the buffer zones above them.
The most critical is the Capital Conservation Buffer (CCB). This is a mandatory capital cushion, typically 2.5% of risk-weighted assets (RWA), that must be maintained on top of minimum requirements. Breaching this buffer triggers automatic regulatory action. Regulators will immediately restrict capital distributions, terminating your ability to pay dividends, execute share buybacks, or award discretionary bonuses. This creates a high-stakes balancing act between safety and performance.
The Tangible Cost of Inefficiency
A board may be inclined to maintain an excessive capital cushion as a precautionary measure. While this feels prudent, such capital inefficiency imposes a direct cost on shareholders.
Holding an extra 100 basis points of CET1 capital not justified by the bank's risk profile or strategic plan directly suppresses your Return on Equity (ROE). For a bank with $5 billion in RWA, that extra 1% represents $50 million in dormant capital. These funds could have been deployed into profitable new loans or returned to shareholders. This is a tangible opportunity cost.
Conversely, operating too close to the regulatory floor is a significant gamble. A minor recession or an unexpected rise in credit losses could push you into the CCB, triggering regulatory constraints precisely when financial flexibility is most needed.
Finding the Strategic Sweet Spot
The objective is optimization: maintaining sufficient capital to satisfy regulators and withstand a severe stress event, but no more than is strategically necessary. This requires precise data intelligence.
The optimal capital level is not a fixed number set annually. It is a dynamic target that shifts with your risk appetite, growth objectives, and the competitive environment. It is a balance that cannot be found by reviewing static quarterly reports.
The pendulum on capital adequacy has always swung. In the 19th century, U.S. banks funded over half their assets with equity. In the years preceding the 2008 crisis, that figure had fallen below 2% for many, contributing to systemic fragility. The subsequent Basel III framework established much stricter floors, but the core challenge for executives remains: balancing safety with shareholder returns in a dynamic economy.
Effective management requires a clear view of your position relative to peers and the ability to model strategic moves in advance. This is why a platform like Visbanking is essential. It provides the tools to move beyond estimation. You can analyze how a new lending initiative will impact RWA, model capital levels under various economic scenarios, and benchmark your buffers against a curated peer group. For a complete analysis, see our guide to modern bank capital requirements.
With this level of insight, you can defend your capital plan with confidence in any board meeting or regulatory review, knowing that shareholder capital is being deployed with maximum efficiency.
Turning Capital Data into Action
Bank capital ratios are more than regulatory metrics; they are the vital signs of your institution's health, indicating your capacity for growth and resilience against shocks. The strategic value is unlocked when this knowledge is translated into decisive action.
Mastering your capital position requires excelling in four key areas:
- Strategic Interpretation: Understanding what your CET1, Tier 1, and Total Capital ratios reveal about your bank's resilience.
- RWA Management: Recognizing that strategic leverage lies not just in raising capital, but in optimizing Risk-Weighted Assets.
- Competitive Benchmarking: Gaining an accurate assessment of your position by comparing against a relevant peer group.
- Capital Optimization: Balancing the need for a fortified balance sheet with the imperative to deliver strong shareholder returns.
In today's market, decisions based on last quarter's data are a competitive disadvantage. You need a bridge from theory to execution, and that bridge is built with data intelligence.
From Data Points to Strategic Moves
Traditional capital planning methods are no longer sufficient. To execute bold strategies with confidence, you need more than a static report—you require a live, interactive environment to model future scenarios on demand. This is not an optional enhancement; it is a core discipline, similar to the principles underlying a robust guide to your model risk management framework.
Consider these questions: What is the impact on your CET1 ratio if you acquire a $50 million C&I loan portfolio? How would a change in your asset mix affect your RWA density relative to your top five competitors? Answering these questions in seconds transforms capital planning from a reactive task into a competitive weapon.
Waiting for the next call report to assess your standing is like driving while looking only in the rearview mirror. You must look ahead, anticipate market shifts, and seize opportunities before your competitors.
A dedicated intelligence system transforms dense regulatory requirements into a clear dashboard for action. It allows your leadership team to move beyond spreadsheet management and focus on steering the bank toward intelligent, sustainable growth.
The necessary data already exists. The challenge has always been accessing it in a way that fuels rapid, informed decisions. At Visbanking, we provide the tools to benchmark your capital in real-time, model your next strategic move, and turn compliance into a source of foresight. Explore our platform to see how data intelligence can redefine your capital strategy.
A Few Lingering Questions on Capital Ratios
Even for seasoned executives, certain questions consistently arise during strategic discussions. Here are direct answers to the most common ones.
What Is a Good CET1 Ratio
There is no universal "good" Common Equity Tier 1 (CET1) ratio. The appropriate ratio is contingent on your bank's specific context: its business model, risk appetite, and, most importantly, its position relative to peers.
For example, a commercial real estate lender with a significant portfolio of assets carrying a 150% risk weight requires a more substantial capital buffer than a custodial bank whose balance sheet is dominated by low-risk assets. A 12% CET1 ratio might be appropriate for the CRE lender, whereas the custodial bank could operate safely and efficiently at 9%. The critical question is not "what is a good number?" but rather, "what is the right number for our strategy, and how does it compare to our competitors'?"
How Often Should We Review Our Capital Plan
While regulatory reviews are periodic, strategic capital planning must be a continuous process. A capital plan reviewed only annually is already obsolete.
Your capital plan should be a dynamic document, revisited whenever a significant event occurs: a potential acquisition, a new product launch, a sudden shift in the economic outlook, or a major competitive move. Modern data platforms enable this conversation to be ongoing, not confined to regulatory reporting cycles.
A capital plan reviewed only for regulatory filings is a compliance document. A capital plan integrated into every strategic decision is a competitive weapon.
What Is RWA Density and Why Does It Matter
Risk-Weighted Asset (RWA) density is a simple yet powerful metric calculated by dividing total RWA by total assets (RWA / Total Assets). It provides a single percentage that summarizes the overall risk profile of your balance sheet.
It answers a fundamental question: for every dollar of assets on our books, how much risk-weighted capital support is required?
A bank with a low RWA density—for instance, 65%—is likely pursuing a conservative strategy with a portfolio heavy in government securities and prime mortgages. A bank with a high density of 85% is taking on more risk in pursuit of higher returns. Neither strategy is inherently superior, but they represent fundamentally different risk-return trade-offs.
Monitoring your RWA density against peers provides an instant snapshot of your relative risk appetite. A rising RWA density should trigger an immediate board-level discussion: do the potential returns justify the incremental risk?
Your capital strategy should not be based on outdated reports. Visbanking provides the real-time data intelligence you need to benchmark against peers, model strategic decisions, and turn capital planning into a decisive advantage. Explore our Bank Intelligence and Action System today.
Latest Articles

Brian's Banking Blog
Customer Churn Prediction: A Practical Guide for Banks

Brian's Banking Blog
Social Network Analysis for Banking: A Practical Guide

Brian's Banking Blog
How to Increase ROE: A Data-Driven Playbook for Bank Leaders

Brian's Banking Blog
What Is SEC EDGAR and How Banks Use the Data

Brian's Banking Blog
What Is Value at Risk and Why Bank Leaders Rely on It

Brian's Banking Blog