Regulatory Capital for Banks: A Strategic Guide for Directors
Brian's Banking Blog
For bank directors, regulatory capital is not merely a line item on a compliance checklist; it is the bedrock of the institution's stability and the primary lever for strategic action. Viewing it as a purely defensive shield is a critical error. A well-managed capital base is an offensive tool—one that fuels growth, sharpens competitive positioning, and builds unwavering investor confidence.
This guide moves beyond compliance to provide actionable insights for executives who understand that capital efficiency is a direct driver of shareholder value.
Why Regulatory Capital Is a Strategic Asset

At its core, regulatory capital is the fund a bank must hold to absorb unexpected losses and protect depositors. It is the foundation of a sound financial system. For the executive team, however, viewing capital solely through a regulatory lens is a significant missed opportunity.
A robust capital position enables a bank to withstand economic downturns, seize acquisition opportunities while competitors are constrained, and finance the technology that secures its future. The true value lies not in meeting minimums, but in strategic deployment.
The Shift from Compliance to Competitive Edge
Historically, capital adequacy was a pass/fail test. Today, the focus in leading boardrooms has shifted decisively to capital efficiency. The objective is to ensure every dollar of capital generates the maximum possible risk-adjusted return.
This requires a granular understanding of how business decisions directly impact capital requirements. Consider two banks, each with $10 billion in assets. Bank A holds a portfolio dominated by low-risk government securities. Bank B is heavily weighted toward higher-risk commercial real estate loans. Bank B will be required to hold significantly more capital against its assets—capital that is then unavailable for growth initiatives.
This is not a technicality; it is a strategic decision with profound implications for profitability and shareholder value. Mastering this trade-off is a hallmark of modern bank leadership.
Data-Driven Capital Decisions
Achieving the optimal balance between risk and return hinges on data intelligence. Leading institutions have moved beyond static quarterly reports. They now leverage dynamic data platforms to model, stress-test, and fine-tune their capital structures in near real-time.
A forward-thinking approach to managing bank regulatory capital involves:
- Proactive Modeling: Simulating the impact of a new loan product or a market shift on capital ratios before committing resources.
- Strategic Benchmarking: Analyzing how capital allocation and risk-weighted asset (RWA) density compare against a curated peer group to identify operational inefficiencies.
- Enhanced Risk Assessment: Moving beyond broad categories to gain a microscopic view of risk concentrations across the entire balance sheet.
This data-first methodology transforms a regulatory necessity into a distinct competitive advantage. It empowers leadership to anticipate market and regulatory shifts, making capital decisions that both protect and grow the institution.
To assess how your bank's capital structure compares, Visbanking’s intelligence platform provides the clarity needed to convert compliance into strategy.
Understanding The Capital Stack
Effective governance requires a complete command of the capital hierarchy. This is not textbook theory; it is the framework for your bank's strategic capacity and resilience. Each tier of capital offers a different level of defense against financial shocks.
Regulators have established a strict hierarchy, or "stack," to ensure the highest-quality, most loss-absorbing capital is deployed first in a crisis. For a director, mastering this stack is fundamental to sound risk management and strategic planning.
This infographic provides a high-level overview of the capital tiers that form your bank's financial backbone.
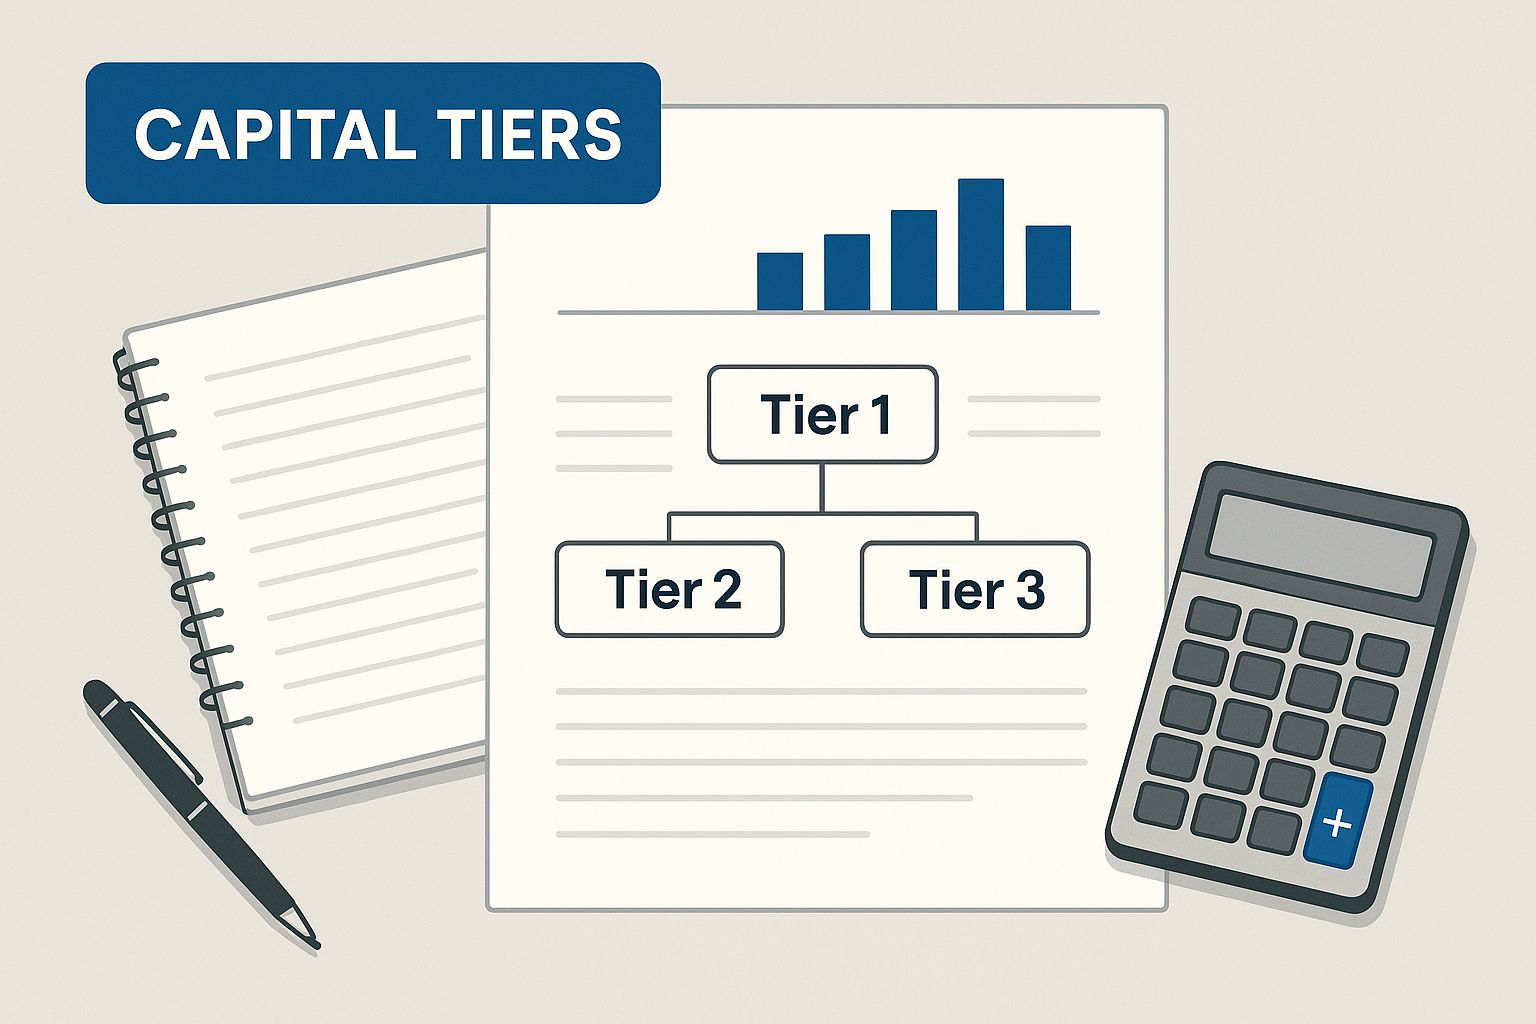
The structure clearly delineates the high-quality, loss-absorbing Tier 1 capital from the supplementary support of Tier 2, forming the core of a bank's defense mechanism.
Tier 1 Capital: The Core Defense
Tier 1 is the front line—the highest-quality capital a bank possesses. It is designed to absorb losses without triggering the bank's failure. It consists of two key components.
Common Equity Tier 1 (CET1): This is capital in its purest form and the primary defense. It comprises the bank's common stock and retained earnings. CET1 is paramount because it is permanent, carries no servicing costs, and can directly absorb losses, thereby protecting depositors.
Additional Tier 1 (AT1): This layer includes instruments, such as perpetual non-cumulative preference shares, that are also permanent but can be written down or converted to common equity if the bank reaches a predetermined trigger of financial stress.
A strong CET1 ratio signals fundamental strength to the market and regulators. For example, if a major bank reports a CET1 ratio of 15.5% against risk-weighted assets of £3 trillion, it demonstrates a substantial buffer above minimum requirements, inspiring confidence.
Tier 2 Capital: The Supplementary Buffer
Tier 2 capital is the secondary line of defense. It is a supplementary layer designed to absorb losses in the event of failure, providing a cushion for depositors and senior creditors. It is considered less reliable than Tier 1 because it is not as readily available to absorb losses on a going-concern basis.
Key Takeaway: Tier 1 capital keeps a bank operational during stress. Tier 2 capital is structured to absorb losses in a resolution scenario, protecting depositors and senior creditors from loss.
This supplementary layer includes:
- Subordinated Debt: Debt instruments with a fixed maturity that, in a liquidation, are paid only after senior debtholders.
- Loan-Loss Reserves: A portion of the bank's general allowance for loan and lease losses (ALLL) can be included, limited to 1.25% of risk-weighted assets under Basel III.
Understanding the specific capital requirements for banks in the US is non-negotiable for both compliance and strategic planning. The composition of the capital stack has direct consequences: a higher proportion of CET1 enhances resilience, lowers funding costs, and provides more firepower for growth. Conversely, over-reliance on lower-quality Tier 2 capital can be perceived as a sign of weakness by investors and regulators.
Navigating the Basel Regulatory Framework

The 2008 financial crisis fundamentally reshaped global banking regulations. For any bank director, understanding the evolution from Basel II to Basel III and the impending "Basel Endgame" reforms is essential for anticipating future requirements and ensuring institutional readiness.
The Basel Accords, developed by the Basel Committee on Banking Supervision (BCBS), establish the global standards for bank capital. While Basel II attempted to introduce more risk sensitivity, its shortcomings became evident during the crisis, leading to the far more stringent Basel III framework.
How Basel III Changed the Capital Game
The primary objective of Basel III was to strengthen the banking sector's resilience by increasing both the quantity and quality of required capital and introducing new capital buffers.
The most significant change was the heightened standard for Common Equity Tier 1 (CET1) capital. The minimum CET1 ratio was increased from 2% under Basel II to 4.5%. This forced banks to hold more high-quality, loss-absorbing capital.
Furthermore, Basel III introduced mandatory buffers that increase the effective requirements:
- Capital Conservation Buffer (CCB): An additional 2.5% buffer of CET1 capital. If a bank's capital dips into this buffer, it faces restrictions on capital distributions, such as dividends and discretionary bonuses.
- Counter-Cyclical Capital Buffer (CCyB): A flexible buffer, ranging from 0% to 2.5%, which national regulators can activate to cool excessive credit growth and mitigate systemic risk.
The combined impact is substantial. A bank subject to a fully activated CCB and CCyB faces an effective CET1 requirement of 9.5%—nearly five times the Basel II standard. For globally systemic important banks (G-SIBs), the requirements are even higher.
This table summarizes the key minimum ratios under the Basel III framework.
Key Basel III Capital Ratio Requirements
| Capital Component | Minimum Requirement | Description |
|---|---|---|
| Minimum CET1 Ratio | 4.5% | The core layer of high-quality, loss-absorbing capital. |
| Capital Conservation Buffer | 2.5% | An additional layer of CET1 capital to absorb losses during stress. |
| Minimum Tier 1 Capital | 6.0% | Includes CET1 plus other Tier 1 instruments like preferred stock. |
| Minimum Total Capital | 8.0% | Includes Tier 1 and Tier 2 capital (e.g., subordinated debt). |
| Counter-Cyclical Buffer | 0% - 2.5% | A discretionary buffer regulators can activate to curb excessive credit growth. |
These stacked requirements create a much thicker cushion to protect the financial system.
Global Rules, Local Headaches
Despite providing a global standard, Basel III implementation varies across jurisdictions. This "regulatory fragmentation" has tangible consequences for banks competing internationally.
For instance, large U.S. banks currently hold an average CET1 ratio of approximately 13%, while their EU counterparts report an aggregate of around 15.73%. However, differing national rules on risk-weighting and buffer implementation create an uneven playing field. A deeper analysis of this regulatory fragmentation highlights its impact on global finance.
These discrepancies influence capital flows, loan pricing, and a bank's competitive standing. For a board, monitoring these jurisdictional nuances is critical. It is not enough to know today's capital ratios; a forward-looking, data-backed perspective is required.
This is where data intelligence platforms like Visbanking provide a decisive edge. Leadership can benchmark capital adequacy against specific peer groups and model the impact of divergent regulatory scenarios. With such data-driven insight, navigating the Basel framework transitions from a reactive compliance exercise to a strategic advantage. Explore our data to see how your institution measures up.
How Risk-Weighted Assets Impact Your Capital
The denominator in every regulatory capital ratio is Risk-Weighted Assets (RWA). This figure is the direct link between the board’s strategic portfolio decisions and the bank's capital requirements. Mastering RWA is fundamental to balancing safety with profitability.
RWA is a methodology for adjusting a bank's assets for risk. Instead of treating all assets equally, regulators assign a "risk weight" to each asset class. This system requires banks to hold more capital against riskier assets and less against safer ones, providing a more accurate measure of a bank's true risk exposure.
From Balance Sheet Assets to RWA
The calculation is straightforward: each asset's carrying value is multiplied by its assigned risk weight to determine its contribution to total RWA. The strategic impact, however, is immense.
Consider a simplified portfolio:
- $100 million in commercial loans: Typically assigned a 100% risk weight, contributing the full $100 million to the bank's RWA.
- $100 million in first-lien residential mortgages: Considered less risky, these might carry a 50% risk weight, adding only $50 million to total RWA.
- $100 million in U.S. Treasury bonds: Deemed virtually risk-free, these have a 0% risk weight for credit risk, adding nothing to RWA.
The strategic trade-off is clear. A portfolio concentrated in commercial loans will generate a much higher RWA—and thus require significantly more capital—than one focused on government securities.
Executive Takeaway: Every asset allocation decision is a capital decision. The composition of a bank's loan and investment portfolios directly determines its RWA, which in turn dictates the amount of capital that must be held in reserve rather than deployed for growth.
The Standardized vs. Internal Models Approach
Most community and regional banks utilize the Standardized Approach, where regulators provide a fixed menu of risk weights for broad asset classes. This ensures consistency and comparability but offers limited flexibility.
The largest, most sophisticated banks may be approved to use an Internal Models-Based (IRB) Approach. This allows a bank to use its own proprietary data and risk models to calculate credit risk, subject to intense regulatory oversight. The benefit is a more precise RWA calculation that can reward superior risk management with a lower capital charge.
However, the IRB approach is a resource-intensive endeavor. For most banks, the core strategy lies in optimizing the portfolio within the constraints of the Standardized Approach. This is where data intelligence becomes a powerful tool. By calculating your RWA density (Total RWA / Total Assets) and benchmarking it against peers, you can identify strategic opportunities. A higher-than-average RWA density could indicate a riskier portfolio, or it may signal an overly conservative approach that unnecessarily ties up capital.
A detailed understanding of RWA is a cornerstone of effective balance sheet management and is critical for credible analysis. For deeper context, our guide on strategic stress testing for banks provides valuable related insights.
Ultimately, RWA is the direct link between a bank's daily operations and its long-term resilience. By actively managing the asset mix with a sharp focus on its RWA impact, executives can steer the institution toward greater capital efficiency.
Optimizing Capital with Data Intelligence
Regulatory capital has too often been treated as a static figure to be reported and archived. The most effective leadership teams, however, view it as a dynamic tool for strategic advantage. They ask the critical questions: Is our capital deployed as efficiently as possible? Where are we underperforming relative to our closest competitors? These questions cannot be answered with high-level, retrospective data.
From Reporting to Actionable Insight
True capital optimization begins with benchmarking performance against a relevant peer group. Evaluating your own capital ratios in isolation is insufficient; context is everything.
By comparing key metrics—such as capital ratios, RWA density, and capital mix—against a curated set of peer institutions, you can immediately identify outliers and unlock strategic opportunities. This is where a platform like Visbanking excels, transforming vast amounts of raw data into clear, actionable intelligence.
This screenshot demonstrates how a bank can instantly visualize its capital adequacy against a chosen peer group, providing an objective assessment of its market position.
Seeing your bank plotted on this comparative graph is a powerful diagnostic tool. It shifts the boardroom conversation from, "Are we compliant?" to, "Are we competitive?"
A Practical Example of Data-Driven Strategy
Consider a $5 billion bank with a CET1 ratio of 11.5%. On its face, this appears strong—well above the regulatory minimum.
Using a data intelligence tool, however, the management team benchmarks its RWA density for commercial real estate (CRE) loans. They discover their density is 85%, while direct peers with similar CRE portfolios are averaging only 72%.
This 13-percentage-point gap is a significant red flag that standard reports would entirely miss. It immediately forces a critical board-level discussion:
- Are our CRE risk models overly conservative, trapping excess capital?
- Is there an unidentified risk concentration within our CRE portfolio that is inflating our RWA?
- What are our peers doing differently? Are they utilizing structuring techniques or credit enhancements that we could adopt?
This single data point, unearthed through granular, comparative analysis, can initiate a strategic review that frees up millions in capital. This exemplifies the power of moving beyond a compliance-only mindset. As institutions embrace this level of intelligence, acquiring the right talent becomes paramount. This playbook on hiring for AI in the finance industry offers relevant insights for building such teams.
Integrating Intelligence into Core Banking Functions
This data-first approach to regulatory capital for banks should be woven into the fabric of decision-making across the institution.
- Capital Planning: Move beyond internal silos. Model capital needs using peer-validated assumptions for more credible and efficient forecasting.
- Stress Testing: Use peer benchmarks to validate the severity of stress scenarios. If your model projects a capital impact from a downturn that is a significant outlier compared to peers with similar portfolios, it signals a need to refine your assumptions. Our resources on banking regulatory compliance detail how these elements interrelate.
- M&A Evaluation: When assessing a potential acquisition, precisely model the pro-forma capital position of the combined entity and identify optimization opportunities before a deal is signed, adding tangible value to the analysis.
The conclusion is clear: capital management is no longer a reactive, regulator-driven task. It is a proactive, data-powered discipline that creates value. The first step is to establish an objective baseline.
Answering Key Executive Questions
As a bank director, you are accountable for the institution’s capital strategy. Answering high-stakes questions with clarity and confidence is essential for effective governance. Here, we address the critical challenges you face regarding regulatory capital.
How Much Capital Is Too Much?
This is the central strategic dilemma. While regulators set a floor, there is no single "correct" capital level. Excess capital provides a buffer against economic shocks and creates strategic flexibility for acquisitions or investments during market dislocations.
However, every dollar of idle capital is a drag on returns. A bank with an 18% CET1 ratio may be exceptionally safe, but it is almost certainly underperforming and depressing its Return on Equity (ROE). Shareholders expect their capital to be deployed efficiently. For example, if a peer group with a similar risk profile achieves a higher ROE with a 14% CET1 ratio, a bank holding 16% must question its capital strategy.
Executive Takeaway: "Too much" capital is the point at which the cost of forgone shareholder returns exceeds the benefit of incremental safety. This tipping point is unique to your bank's strategy and can only be identified through rigorous, data-driven peer analysis.
What Is the Biggest Hidden Risk We Are Missing?
For many banks, a significant unmonitored risk lies in the interconnectedness with non-bank financial institutions (NBFIs), particularly private credit and private equity funds. This sector has grown to a global AUM of €13.2 trillion in 2024, blurring the lines with traditional banking.
The primary danger is layered leverage and hidden concentrations. A bank might have several exposures that appear distinct: a capital call facility to a PE fund, a loan to one of its portfolio companies, and derivative hedges with the fund itself. Individually, each may seem manageable. However, they are all linked to the same underlying economic drivers. A downturn in that sector could stress all these positions simultaneously, revealing a massive, correlated risk that was not apparent in siloed risk reports. Regulators like the ECB have repeatedly warned that banks' risk management frameworks have not kept pace with this evolving exposure.
Director's FAQ Quick Reference
This table provides concise answers to common board-level questions, serving as a quick reference for high-level discussions.
| Question | Core Answer |
|---|---|
| Are our capital buffers just for show? | Absolutely not. Buffers like the Capital Conservation Buffer are a critical defense. Breaching them restricts capital distributions (dividends, bonuses), sending a negative signal to the market. They should be treated as part of the minimum requirement. |
| How does M&A impact our capital strategy? | An acquisition fundamentally alters your RWA profile. A core component of due diligence is modeling the combined entity's capital ratios. Benchmarking the target’s RWA density against its peers can reveal hidden risks or optimization opportunities. |
| Should we worry about regulatory arbitrage by competitors? | Yes. The rapid growth of private credit is driven, in part, by its lighter regulatory burden. NBFIs are competing for traditional lending business without the same capital constraints. Understanding this competitive pressure is vital to refining your own strategy. |
| What is the first step to better capital management? | Know where you stand. The most effective first action is a comprehensive benchmark of your capital ratios, RWA density, and profitability against a well-defined peer group. This analysis provides the essential context for all subsequent strategic decisions. |
How Can Data Change Our Capital Conversation?
Data transforms the capital discussion from a retrospective compliance exercise into a forward-looking strategic dialogue. Without objective, comparative data, boardroom conversations are based on intuition and broad industry averages. With it, you can ask—and answer—far more precise and impactful questions.
Consider this practical example: A standard report indicates your bank's Tier 1 Leverage Ratio is 9.5%, well above the 4% minimum. The discussion ends.
A data-driven approach, however, asks, "Why?" Benchmarking this ratio against peers with a similar business model reveals their average is 8.75%. This prompts a critical question: Are we more efficient, or are we simply holding more non-productive, low-return assets? Further analysis might reveal that a significant portion of your assets are in low-yield, zero-risk-weighted securities that inflate the leverage denominator without contributing meaningfully to the bottom line. This insight, unavailable from a basic compliance report, could trigger a strategic reallocation of capital into higher-yielding assets, boosting profitability without materially affecting risk-based capital ratios.
Data intelligence empowers leadership to:
- Challenge internal assumptions with external, objective evidence.
- Pinpoint specific sources of inefficiency on the balance sheet.
- Model the financial impact of capital decisions before they are made.
- Justify capital plans to regulators and investors with data-backed analysis.
This is how governance is elevated. You move from overseeing capital to actively optimizing it for shareholder value and the long-term resilience of the institution.
Your bank's success hinges on making smarter, faster decisions backed by superior intelligence. Visbanking provides the Bank Intelligence and Action System (BIAS) that empowers executives to benchmark performance, uncover risks, and transform regulatory capital from a compliance burden into a strategic weapon. Explore our platform today and see where you truly stand.
Latest Articles

Brian's Banking Blog
Database for Companies: A Bank Executive's Growth Playbook

Brian's Banking Blog
Boost Banking Profit: Data Quality Software for Executives

Brian's Banking Blog
Cross Selling Strategies in Banking: An Executive Blueprint

Brian's Banking Blog
Banking Data Solutions for Executives: 2026 Guide

Brian's Banking Blog
Credit Union Strategic Planning: A Data-Driven Playbook

Brian's Banking Blog