Optimizing Net Interest Income for Bank Profitability
Brian's Banking Blog
At its core, Net Interest Income (NII) is the primary measure of a bank's profitability. It is the difference between the revenue generated from interest-earning assets and the expense associated with interest-bearing liabilities. For bank executives, NII is not just a line item; it is the engine driving institutional performance.
Why Net Interest Income Is a Core Executive Focus

A granular understanding of Net Interest Income is fundamental to effective bank leadership. NII is the clearest reflection of an institution's strategic health and its ability to navigate changing market conditions. While the formula is straightforward, its inputs are shaped by every loan priced and every deposit account opened.
Successfully managing NII comes down to mastering the spread between what a bank earns on its assets and what it pays for its liabilities. This margin is the lifeblood of the operation.
The Core Executive Challenge
The primary challenge for bank leadership is that NII is never static. It is constantly influenced by interest rate fluctuations, competitive pressures, and macroeconomic shifts.
Recent trends in the U.S. banking system illustrate this complexity. Net interest margins (NIM) improved by approximately 6 basis points year-over-year, yet aggregate net interest income declined by 0.3%. This paradox was a direct result of rising funding costs and slowing loan growth, proving that a wider margin does not guarantee higher NII. For a detailed analysis, the OCC's Semiannual Risk Perspective provides valuable context.
A bank's success is not measured by asset growth alone, but by the profitable deployment of those assets. NII is the ultimate scorecard for this objective.
This reality underscores why quarterly reports are insufficient for active management. To protect and grow this crucial income stream, executives require clear visibility into their performance relative to the market.
This is where precise benchmarking becomes a strategic imperative. It provides the context needed to make informed decisions. With a platform like Visbanking, you can compare your bank’s performance against a curated peer group, transforming raw data into actionable intelligence.
Deconstructing the Drivers of Your NII
To effectively manage net interest income, it must be deconstructed into its core components: Interest Income and Interest Expense. These are not merely accounting figures; they are the outcomes of thousands of pricing, portfolio, and funding decisions.
This graphic provides a clear visualization of how NII is derived from these two opposing forces.
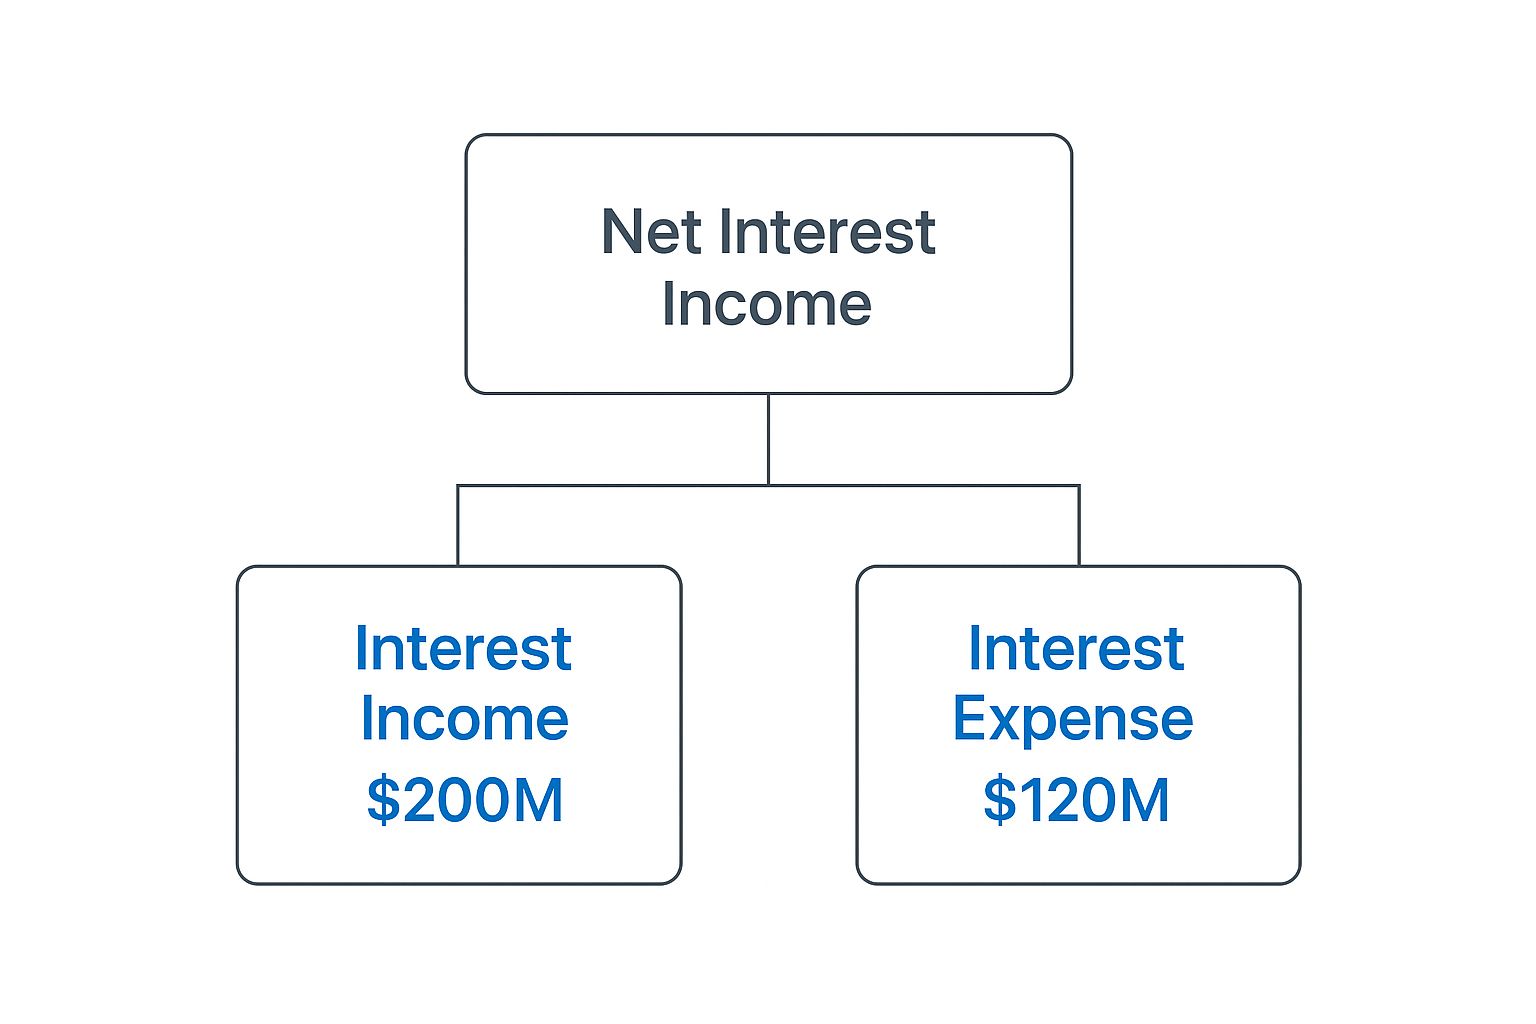
As illustrated, even robust interest income can be significantly eroded by high funding costs. The key is to achieve a strategic balance that preserves the spread.
The Anatomy of Interest Income
Your institution’s Interest Income is a direct function of your earning asset portfolio's composition and yield. The mix of commercial versus consumer loans, the duration of securities, and the pricing on new originations all shape revenue potential.
A portfolio dominated by long-term, fixed-rate assets may provide stability in a declining rate environment but will underperform significantly as rates rise. Conversely, a strong portfolio of variable-rate commercial loans can serve as a natural hedge against rising rates. Executive leadership must continuously ask: Are we being adequately compensated for the risk we are taking? How do our loan yields compare to our direct competitors? Without reliable data, these questions are unanswerable.
While NII is the primary profit engine, a deep dive into interest vs. noninterest income and expense provides a more complete view of institutional revenue streams.
The Real Cost of Interest Expense
On the liabilities side of the balance sheet, Interest Expense is determined by your cost of funds. This is a function of the deposit mix—the blend of non-interest-bearing accounts, low-cost savings, and higher-cost time deposits. Over-reliance on high-rate CDs to fund asset growth can severely compress net interest income, particularly in a competitive deposit market.
Consider a practical example. A bank has $1 billion in earning assets yielding 4.5%, generating $45 million in interest income.
- Scenario A: The bank funds growth with $400 million in CDs costing 3.5% ($14 million expense), plus other liabilities. Its total interest expense reaches $24 million, resulting in an NII of $21 million.
- Scenario B: Following a strategic initiative to grow low-cost core deposits, the bank reduces its reliance on CDs. Its blended cost of funds drops to 1.8%, cutting total interest expense to $18 million.
That $6 million difference flows directly to the bottom line, boosting NII to $27 million without any change to the asset side. This illustrates that managing NII is a constant balancing act between asset yield and funding cost.
Key Drivers of Net Interest Income
The table below outlines the primary factors influencing both income and expenses.
| Component | Key Driver | Strategic Consideration |
|---|---|---|
| Interest Income | Asset Mix: The blend of loans (commercial, consumer, real estate) and securities. | Is the portfolio composition aligned with our risk appetite and the current rate environment? |
| Asset Yield: The average interest rate earned on all earning assets. | How does our pricing compare to peers? Are we being compensated for risk? | |
| Loan Volume & Growth: The total amount of loans on the books and the pace of new originations. | Are we growing in the right segments? Is loan demand strong or weak? | |
| Interest Expense | Funding Mix: The proportion of core deposits, CDs, and wholesale borrowings. | Can we increase our share of low-cost core deposits to lower our funding costs? |
| Cost of Funds: The average interest rate paid on all interest-bearing liabilities. | Are our deposit rates competitive but sustainable? How sensitive are they to market changes? | |
| Deposit Growth: The ability to attract and retain stable, low-cost funding sources. | What is our strategy for growing core deposits in a competitive market? |
Understanding these drivers is the first step. The next is having the tools to translate understanding into action. Platforms like Visbanking provide the intelligence to benchmark funding costs and asset yields, enabling decisive leadership based on data, not intuition.
Translating NII Into Your Net Interest Margin

While Net Interest Income (NII) provides an absolute measure of profit, it lacks context for scale. A $10 billion bank will naturally generate a larger NII than a $1 billion bank. However, the raw dollar figure reveals nothing about which institution is more efficient at its core business. This is why astute bank executives focus on the Net Interest Margin (NIM).
NIM functions as the great equalizer, shifting the focus from size to operational effectiveness. By expressing net interest income as a percentage of average earning assets, it reveals how efficiently a bank converts its assets into profit.
NIM = Net Interest Income / Average Earning Assets
This ratio removes the distortion of balance sheet size and delivers a clear verdict on performance. It is the metric that allows for accurate comparison against any institution, from a local credit union to a national competitor.
Efficiency Versus Scale: A Practical Example
Consider two hypothetical institutions:
- Bank A (The Behemoth): With $20 billion in average earning assets, this bank generates $500 million in NII. Its NIM is 2.50%.
- Bank B (The Community Leader): A smaller bank with $2 billion in earning assets generates $64 million in NII. Its NIM is a much stronger 3.20%.
Despite Bank A's NII being nearly eight times larger, Bank B is the more efficient operator. For every dollar of earning assets, it generates 70 basis points more in profit. This superior performance indicates more effective loan pricing, a lower-cost funding base, or a more advantageous asset strategy. For Bank A’s leadership, this comparison should trigger an immediate strategic review.
Globally, bank NIMs often range between 2.5% and 4%, reflecting varying levels of operational efficiency. For additional context, one can explore the World Bank’s financial development data. The critical question for any leadership team is where their institution falls on that spectrum relative to its true peers. You can also learn more about calculating and interpreting Net Interest Margin in our guide.
This is where precise data intelligence becomes indispensable. Instead of relying on broad industry averages, executives must know exactly where they stand. A platform like Visbanking enables you to benchmark your NIM against a curated peer group—banks of a similar size, in your market, with a comparable business model. This clarity doesn't just identify performance gaps; it illuminates the path to margin expansion and turns data into decisive action.
Pulling the Right Levers to Boost Net Interest Income
Knowing your bank's Net Interest Income is a baseline requirement. Actively managing it is how effective leaders create shareholder value. To grow NII, executives must pull specific, powerful levers that influence both sides of the balance sheet. A passive, reactive posture guarantees margin compression. Proactive management is the only path to sustainable profitability.
The most effective strategies require discipline and, critically, accurate data. Mastering these levers enables consistent outperformance, regardless of the interest rate environment.
Master Your Asset and Liability Management
Asset and Liability Management (ALM) is the discipline of structuring the balance sheet to capitalize on interest rate movements while mitigating risk. It hinges on intentionally managing the duration and repricing characteristics of both assets and liabilities.
For example, in a rising rate environment, an effective ALM strategy would involve shortening the duration of fixed-rate assets and increasing the allocation to variable-rate loans. This allows the asset portfolio to reprice upward more quickly. Concurrently, the bank would aim to lock in lower-cost, long-term funding—such as fixed-rate CDs—to protect interest expenses from rising in tandem with the market.
Implement Data-Driven Pricing
Setting loan and deposit rates based on intuition or outdated market surveys is a critical error. A data-driven pricing strategy relies on real-time market intelligence to optimize yields without sacrificing market share. This requires knowing precisely how your rates compare to relevant competitors.
Imagine a community bank with a $500 million auto loan portfolio yielding 5.75%. Using a platform like Visbanking, its executive team discovers that direct peers in their region are averaging 5.90% on similar credits. That 15-basis-point gap represents a significant opportunity.
Armed with this data, the bank can confidently adjust its pricing, knowing it is aligning with the market, not exceeding it. This seemingly minor adjustment could add $750,000 directly to its annual net interest income.
This is not about aggressive price hikes. It is about making informed, incremental adjustments that ensure the bank is being fairly compensated for its risk.
Fine-Tune Your Portfolio and Funding Mix
The final lever involves the deliberate management of portfolio composition. Shifting the asset mix toward higher-yielding products or the funding mix toward lower-cost sources can fundamentally improve the NII profile. This requires a sharp understanding of the risk-return profile of each asset class and the true cost of each funding channel.
For example, a bank may identify an over-concentration in low-margin residential mortgages. A strategic decision to expand its commercial and industrial (C&I) loan book, which typically offers higher yields, can systematically raise the overall asset yield. On the liability side, a focused campaign to attract low-cost core deposits reduces reliance on expensive brokered deposits or CDs, directly lowering interest expense.
Executing these strategies effectively requires clear, actionable data. Without the ability to benchmark portfolio yields, funding costs, and asset mix against a relevant peer group, you are operating blind. Visbanking’s data intelligence illuminates these opportunities and empowers your team to pull the right levers at the right time.
How Economic Shifts Put Your NII at Risk

Bank performance is perpetually subject to external economic forces. Federal Reserve policy, market competition, and shifts in the yield curve can compress margins with alarming speed. Without adequate preparation, your net interest income is vulnerable.
The first step toward building a resilient balance sheet is understanding these dynamics. When a central bank alters its policy rate, the impact is not uniform. The key variable is the velocity at which your asset yields adjust relative to your funding costs. This timing differential—or gap—is the essence of asset-liability management and dictates performance through an interest rate cycle.
Wrestling with Market Dynamics
In a rising rate environment, asset-sensitive institutions—where assets reprice faster than liabilities—see their NII expand. Conversely, liability-sensitive banks are caught in a margin squeeze as their funding costs accelerate faster than their asset yields.
An inverted yield curve introduces another significant challenge, compressing margins when the cost of short-term funding rises above the yield on long-term assets.
Finally, competition exerts constant pressure. Digital-first banks often use aggressive deposit pricing to attract funding, forcing a difficult choice: match their rates and accept NII compression, or hold firm and risk losing core deposits. The impact is significant: worldwide net interest income of digital banks has nearly doubled since 2017 to approximately $1.5 trillion and is forecast to exceed $2 trillion by 2029. You can explore the growth of digital bank NII to grasp the scale of this industry shift.
You cannot control the Federal Reserve or your competitors. You can control your institution's preparedness and response.
The only effective defense is a proactive strategy built on robust data. You must be able to model how various rate scenarios will impact your balance sheet, understand your specific interest rate sensitivities, and benchmark your deposit costs against the competitors vying for the same customers. This is the difference between being a victim of the market and strategically outmaneuvering it.
Here, the right intelligence tools are essential. A powerful platform allows you to benchmark performance and stress-test your balance sheet against potential scenarios. Tools like Visbanking provide the clarity to turn economic uncertainty from a threat into a strategic advantage, enabling you to protect your net interest income regardless of market conditions.
Using Data Intelligence for Superior NII Management
In today's competitive market, managing net interest income with intuition and historical reports is no longer sufficient. To drive growth, leadership must move beyond rearview-mirror analysis. Proactive management demands real-time, granular insights delivered by modern banking intelligence platforms.
This represents a critical shift from historical reporting to forward-looking strategic management. It provides executives with the clarity to make confident, data-backed decisions that protect and grow the bank's primary profit engine. It is how you find definitive answers to your most pressing strategic questions.
From Reporting to Action
Effective NII management is about converting raw data into decisive action. This involves specific, high-value applications with a direct impact on the bottom line.
Consider these practical applications:
Peer Benchmarking: Go beyond broad industry averages. Measure your NIM, loan yields, and funding costs against a handpicked group of your true competitors. If a rival achieves a 3.40% NIM while yours is 3.15%, data intelligence can pinpoint exactly which asset classes or funding sources are causing the disparity.
Performance Diagnostics: Identify specific loan categories that are underperforming. Data may reveal that while your commercial real estate portfolio is strong, your auto loan yields lag the peer median by 25 basis points. This is not a statistic; it is a clear directive for repricing.
Strategic Stress-Testing: Model the impact of sudden rate shocks on your balance sheet and NII. Understanding your institution's unique sensitivities allows you to build a balance sheet engineered to weather—or even capitalize on—market volatility.
This level of detail transforms NII management from a passive, backward-looking exercise into an active, strategic function. For any executive seeking a competitive edge, understanding the full capabilities of modern banking data analytics is a critical first step.
The objective is to know where you stand, where you are headed, and what specific actions will get you there. Data intelligence provides the roadmap.
With a platform like Visbanking, you gain direct access to this level of intelligence. We provide the tools to benchmark your performance with surgical precision, uncover hidden opportunities within your own balance sheet, and test your strategy against future uncertainty. It is about empowering your team to drive superior NII results.
Answering Your Toughest Questions About Net Interest Income
During strategic planning, discussions around net interest income invariably converge on a few crucial questions. The following addresses the key issues confronting bank executives and boards.
How Can We Increase NII in a Falling Rate Environment?
This is where proactive Asset and Liability Management (ALM) is your primary defense. The strategy is to act ahead of the market, not in reaction to it.
Before rates decline, the focus must be on extending the duration of assets to lock in higher yields. Simultaneously, you should be securing low-cost, long-term funding to insulate interest expenses from future volatility. Waiting for the market to move means the opportunity has already been lost.
What Is a Good Net Interest Margin?
A "good" NIM is entirely relative. The only meaningful benchmark is how your margin compares to that of your direct competitors. The goal is not an arbitrary percentage but consistent performance in the top quartile of your true peer group.
Achieving this requires a disciplined, ongoing benchmarking process. You must know exactly where you stand in the market to identify opportunities for margin expansion. Without this competitive context, performance metrics are merely numbers in a vacuum.
For example, a 3.25% NIM may appear solid in isolation. But if your top five local competitors are averaging 3.50%, you are leaving significant value on the table. Data intelligence closes this gap by revealing which specific loan or deposit products are suppressing your performance.
How Quickly Should Our Deposit Costs React to Rate Hikes?
This is determined by your bank's unique deposit beta—a measure of how sensitive your deposit costs are to changes in market rates. There is no universal answer; your beta is a function of your specific deposit composition and customer loyalty.
Rather than guessing, you must use data to understand your institution's precise beta. Knowing this figure enables surgical pricing decisions that balance profitability with customer retention. It ensures you are not overpaying for funds or losing core depositors when the rate cycle turns.
At Visbanking, we deliver the data intelligence that gives bank leadership the confidence to answer these questions decisively. Our platform allows you to benchmark every component of your net interest income against the peers that matter, helping you turn complex data into clear, actionable strategy. Explore our Bank Intelligence and Action System today.
Related Articles

Visbanking Blog
Revolutionize Your Banking Operations with Data-Driven Insights from BIAS

Visbanking Blog
Explore Banking Data: Financial Analysis with VISBANKING

Visbanking Blog
Net Interest Margin Secrets: How Top Banks Maximize Profits

Visbanking Blog
How Bank Efficiency Ratios Reveal Hidden Operational Costs

Visbanking Blog
Banking Data Analytics: Turning Information Into Profit

Visbanking Blog