How to Measure Employee Engagement: A Data-Driven Guide for Banking Executives
Brian's Banking Blog
Employee engagement in banking must be measured by its direct impact on financial performance. The traditional approach—annual, subjective surveys—is insufficient for the data-driven rigor required to manage a modern financial institution. The focus must shift to quantifiable metrics that connect human capital to tangible outcomes: employee turnover costs, loan origination efficiency, and customer retention.
The objective is to establish a clear, data-backed link between your talent strategy and the bank's bottom line.
Why Traditional Engagement Metrics Fail in Banking
Bank leadership operates on quantifiable risk and return. Employee engagement, however, is often relegated to a subjective HR initiative, creating a significant strategic blind spot.
Generic annual surveys provide a snapshot of a moment that has already passed. The data is often stale upon arrival, reflecting yesterday's sentiment, not today's operational challenges. This is not the timely, actionable intelligence required to manage a high-performance banking workforce.
This dated approach leaves critical questions unanswered. Why is one branch exceeding its cross-sell targets by 15% while a demographically similar branch is lagging? Is the high turnover in your mortgage division—costing an estimated $250,000 annually—a symptom of poor management or inefficient processes? Annual surveys might reveal "satisfaction" levels, but they cannot diagnose performance drivers or predict risk with the necessary precision.
The True Cost of Ambiguous Data
Disengagement is not a soft problem; it has hard costs that erode profitability. These costs manifest in several key areas:
- Elevated Turnover: Replacing a single experienced commercial lender can cost upwards of $100,000 in recruitment, training, and lost productivity. When this occurs across multiple departments, it becomes a significant and preventable financial drain.
- Reduced Productivity: A disengaged loan officer or compliance analyst operates at a lower capacity. This translates to slower loan processing, increased error rates, and potential regulatory exposures.
- Customer Attrition: An unmotivated relationship manager cannot deliver the service that builds loyalty and protects your deposit base. A decline in engagement often precedes a dip in your Net Promoter Score (NPS).
The fundamental issue is that traditional engagement scores exist in an HR silo, disconnected from the bank's operational and financial data streams. It is impossible to draw a direct line from a team's self-reported 'happiness' to its actual contribution to the P&L.
Shifting to a Data-Driven Framework
Measuring engagement effectively begins with a structured survey, but that is only the starting point. Global employee engagement recently fell to 21%, a decline estimated to cost the global economy $7.8 trillion in lost productivity. You can explore the full findings on why employee engagement is a critical economic factor to understand the scale of this issue.
While instruments like Gallup’s Q12 provide a solid baseline, their value is unlocked only when integrated into a broader data ecosystem.
The future of talent management in banking lies in connecting disparate data sets. By combining survey feedback with objective performance data from your core systems, you eliminate guesswork. Business intelligence platforms like Visbanking are engineered for this purpose, enabling you to tie human capital analytics directly to financial outcomes.
This approach translates engagement into the language of the C-suite: its direct impact on efficiency, risk, and profitability. It is time to stop guessing and start benchmarking with Visbanking's data to gain the clarity required for decisive action.
Building a Quantitative Measurement Framework
Measuring employee engagement must be a disciplined, quantitative exercise. For bank leadership, the objective is not to gauge "happiness" but to determine if the workforce is sufficiently engaged to execute the bank's strategic objectives.
An effective framework connects employee sentiment directly to financial and operational performance. It provides a comprehensive view—integrating historical results with predictive indicators—enabling leadership to anticipate challenges before they impact the bottom line.
Too often, banks are caught in a detrimental cycle: generic surveys yield ambiguous data, which leads to misguided decisions and wasted resources.
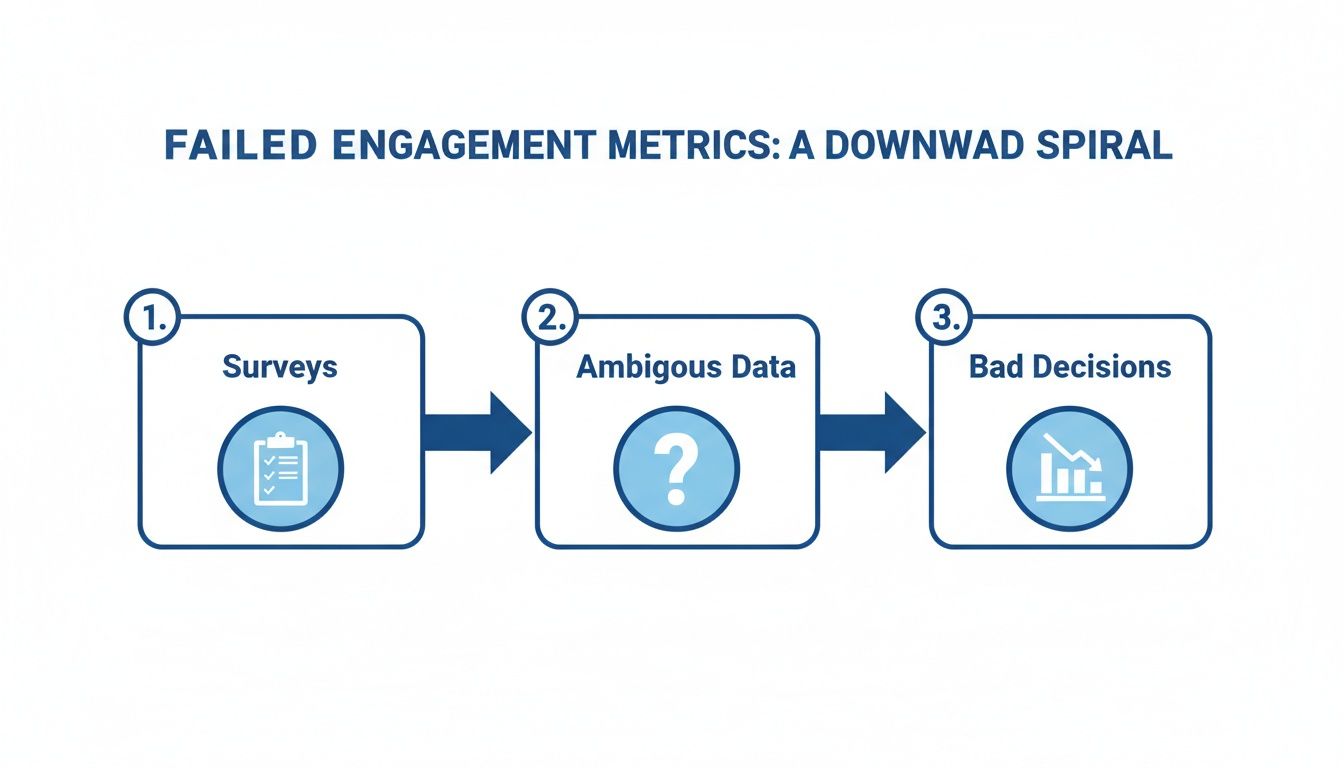
Without a structured framework, you are merely collecting noise. With one, you receive a clear, actionable signal.
A Three-Tiered Model for Banking
To create a clear, actionable picture, metrics should be organized into three distinct layers. This model provides a balanced view, blending historical data with predictive insights to enable confident, proactive management.
Lagging Indicators: These are rearview-mirror metrics that report past outcomes. Key examples include the voluntary employee turnover rate and the Employee Net Promoter Score (eNPS). A 20% turnover rate in your commercial lending division is a lagging indicator—it confirms a problem that has already taken root and incurred costs.
Real-Time Indicators: This is your operational dashboard, providing a live snapshot of current activity. These metrics are captured through frequent pulse surveys, system usage data (e.g., CRM or core platform logins), and sentiment analysis from internal communications. A sudden 30% drop in CRM activity among your relationship managers is a real-time signal of potential disengagement or process friction.
Leading Indicators: These are forward-looking metrics that measure the inputs driving future success. They include internal mobility rates, participation in new training programs, and manager effectiveness scores. For instance, an internal promotion rate of 15%—versus a peer average of 8%—signals a healthy talent pipeline and is a strong predictor of lower future turnover.
To operationalize this, we have developed a scorecard framework as a starting point for building a comprehensive view of engagement at your institution.
The Banking Engagement Metrics Scorecard
This tiered framework helps select metrics that provide a complete picture of employee engagement, from historical outcomes to predictive signals.
| Metric Category | Example Metric | Measurement Frequency | Business Impact |
|---|---|---|---|
| Lagging Indicator | Voluntary Turnover Rate (by branch/dept) | Quarterly/Annually | Direct cost of replacement ($20,000–$100,000+ per employee), loss of institutional knowledge, impact on customer relationships. |
| Lagging Indicator | Employee Net Promoter Score (eNPS) | Semi-Annually | Overall loyalty and advocacy; strong correlation with customer satisfaction and brand reputation. |
| Real-Time Indicator | Pulse Survey Scores (on strategic topics) | Monthly/Bi-weekly | Immediate feedback on change initiatives, leadership communication, or team morale. |
| Real-Time Indicator | CRM/Core System Adoption Rate | Weekly/Daily | Indicator of tool effectiveness and employee adherence to key operational processes. |
| Leading Indicator | Internal Mobility & Promotion Rate | Quarterly | Signals a strong talent pipeline, career growth opportunities, and improved long-term retention. |
| Leading Indicator | Training Program Participation | Per Program/Quarterly | Measures investment in employee skills, readiness for new regulatory requirements, and adaptability. |
This scorecard is not a compliance exercise; it is a tool for connecting talent strategy to business results. It transforms abstract sentiment into concrete data points for decisive action.
Customizing the Framework to Strategic Goals
A generic model is insufficient. The power of this framework is realized when these KPIs are tied directly to your bank's specific strategic goals. A sophisticated understanding of what is business intelligence analytics is critical here—it enables the conversion of disparate data into a cohesive narrative that guides executive decisions.
Consider a community bank with a strategic goal of increasing its cross-sell ratio by 15% this fiscal year. A generic engagement survey offers no value. Instead, a targeted scorecard is required.
Leadership could correlate branch-level eNPS scores with their actual cross-sell volumes. They could then track participation in new product knowledge training (a leading indicator) and monitor CRM usage for logging customer follow-ups (a real-time indicator).
Engagement ceases to be a vague HR concept and becomes a measurable driver of revenue.
If Branch A has an eNPS score 20 points lower and a cross-sell ratio 30% lower than Branch B in a similar market, you have a data-backed directive to investigate. The data does not provide the answer, but it isolates the problem with precision.
By adopting a structured, quantitative approach, leadership can manage human capital with the same discipline applied to the bank's loan portfolio, making smarter talent decisions that drive performance.
Look Beyond Surveys: Capture Real Behavioral Data
Surveys provide valuable sentiment data, but they represent a small, often delayed, piece of the overall picture. Bank executives do not manage credit risk or drive growth with infrequent, subjective data. The same logic must be applied to talent management.
The key to understanding workforce dynamics is to analyze the objective, high-frequency behavioral data generated by the systems your teams use daily.
Your institution is already producing a wealth of this information. Core banking platforms, CRM software, learning management systems (LMS), and internal communication tools are constantly generating digital signals. These are not opinions; they are facts about how work is being executed.

When analyzed correctly, this operational data provides the early warnings and performance indicators that a survey could never capture. It offers a continuous, objective view into your workforce, revealing patterns that signal friction or momentum long before they appear in a quarterly P&L statement.
Uncover the Signals in Your Existing Systems
Each system within your bank's technology stack offers a distinct and valuable lens through which to view engagement.
- Core Banking & CRM: Consistent, high-quality data entry in the CRM is a sign of diligence and process adherence. A sudden drop in a relationship manager's activity or a spike in data entry errors can be an early indicator of burnout or a broken workflow.
- Learning Management Systems (LMS): Are loan officers completing compliance modules ahead of schedule, or are they consistently delinquent? A decline in LMS logins or completion rates can be a leading indicator of disengagement within a critical, revenue-generating unit.
- Internal Communication Tools: High participation in specific channels on platforms like Teams or Slack can indicate strong cross-departmental collaboration. A decline in this interaction may signal the emergence of information silos.
These are not subjective feelings; they are measurable behaviors. When you track metrics like voluntary turnover, internal promotions, and learning activity, you achieve a much sharper, more accurate picture of your workforce's health. It is no surprise that studies confirm engaged teams have approximately 21% less turnover and are significantly more productive.
Case Study: Connecting CRM Activity to Performance
Imagine a regional bank struggling to understand performance disparities among its commercial lending teams. The annual survey was inconclusive—all teams reported similar "satisfaction" levels.
An analysis of operational data, however, revealed a different story.
By pulling three months of CRM activity—call logs, meeting notes, proposal submissions—and mapping it against loan origination volume, a clear pattern emerged. They also layered in recent pulse survey scores related to manager support.
The top-performing teams were not simply making more calls. Their CRM entries were 35% more detailed, and they logged 50% more follow-up activities within 48 hours. Furthermore, their pulse surveys consistently showed higher scores for "clarity of expectations" from their managers.
This insight is invaluable. The issue with the underperforming teams was not a lack of effort; it was the absence of a disciplined sales process, likely stemming from unclear leadership direction. The solution is not an employee appreciation event; it is targeted coaching on the sales process and improved training for managers.
This is the power of combining human capital data with operational data. You replace guesswork with precise, effective action.
Of course, surveys retain a role in gathering qualitative feedback. It is worth reviewing essential workplace satisfaction survey questions to ensure you are asking the right things.
Ultimately, integrating these objective data streams provides a complete, multi-dimensional view. It empowers bank leaders to diagnose problems accurately, allocate resources for maximum impact, and build a culture of high performance based on evidence, not intuition.
Connecting Engagement Metrics to Financial Performance
For any talent engagement strategy to gain traction at the executive level, it must be articulated in financial terms. Metrics remain abstract until they are tied directly to the bank's profit and loss statement. This is the critical step where "engagement" transitions from an HR concept to a hard asset—a driver of profitability that the board cannot ignore.
The objective is to move beyond simple correlation. It is not enough to state that "engaged employees are more productive." You must prove it with your bank's own data. This requires integrating human capital analytics with the financial and operational data that drive decisions, from FDIC call reports to internal performance dashboards.
Modeling the Financial Impact of Turnover
Employee turnover is one of the most direct and significant financial drains resulting from disengagement. Quantifying this cost is the most effective way to capture executive attention.
Consider a mid-sized community bank with 500 employees. Assume its voluntary turnover for branch staff is 15%, meaning 75 employees depart annually. With a conservative all-in replacement cost of $20,000 per employee—covering recruitment, hiring, training, and lost productivity—the bank incurs a $1.5 million annual expense.
A targeted engagement initiative that reduces this turnover by just 5 percentage points—from 15% to 10%—prevents 25 employees from leaving. This translates to $500,000 in direct, annual savings that flow straight to the bottom line.
Framed this way, engagement is not an HR expense. It is a source of significant operational efficiency and a core component of sound financial management.
Correlating Engagement with Core Banking KPIs
Beyond turnover, engagement directly impacts the KPIs that drive revenue and customer loyalty. The goal is to build models that connect engagement scores from specific teams or branches to their actual business results.
A unified data platform provides a decisive advantage here. By merging HR data with operational metrics, you can answer critical business questions:
- Loan Origination: Do branches with higher eNPS scores also generate higher loan volumes per employee? A model might show that a 10-point increase in engagement correlates directly with a 5% increase in loan volume, making the ROI of engagement initiatives clear.
- Cross-Sell Ratios: Map team-level engagement scores against their cross-selling success. You might discover that your most engaged teams have a cross-sell ratio that is 25% higher than their disengaged peers.
- Net Promoter Score (NPS): Analyze the link between employee engagement in a specific branch and the customer NPS scores for that same location. The data will consistently show that highly engaged teams create more loyal customers, which protects and grows your deposit base.
To execute this effectively, executives must know how to analyze financial statements. This skill allows them to see precisely how an investment in human capital appears on the balance sheet.
From Insight to Competitive Advantage
Connecting these data points is a strategic necessity. When you can prove that a specific manager's leadership style results in higher team engagement and an additional $2 million in loan revenue, you have moved beyond subjective feedback. You are now operating on data-driven talent management.
This level of insight enables precise, high-impact decisions. You can identify which leadership behaviors to replicate across the organization, which processes are causing burnout, and where to allocate training resources for the greatest return. It also underscores why robust performance measurement systems that track both financial and human capital metrics are so critical.
Your workforce is not an expense line; it is the engine that creates value. By rigorously measuring engagement and tying it to financial outcomes, bank leaders can manage their human capital with the same discipline they apply to their loan portfolio. This is how you build a more resilient, profitable, and competitive institution.
Using Benchmarking to Turn Data Into Decisions
Internal engagement metrics provide a view of your bank, but it is an incomplete one. Data in a vacuum lacks context. Its meaning is only revealed through comparison against the competitive landscape. For any banking executive focused on market leadership, peer benchmarking is not optional.

Benchmarking is what separates a hypothesis from a data-driven strategy. It contextualizes your performance, answering the critical question: "How are we performing relative to our direct competitors?"
Without this context, you are operating blind. A high turnover rate could signal an internal crisis or reflect a broader market trend affecting all players.
The Power of a Relevant Peer Group
Consider a practical example. Your bank's voluntary turnover for loan officers reached 10% last year. In isolation, this figure is alarming, suggesting potential issues with compensation, management, or culture.
However, if benchmarking data revealed that the average turnover for banks of a similar asset size in your region was 14%, the narrative changes entirely.
Your 10% rate is not a crisis; it is a competitive advantage. The strategic conversation shifts from "How do we fix this problem?" to "What are we doing right, and how can we amplify it?" This is the clarity that benchmarking provides.
A robust analysis requires comparing key metrics against a carefully selected peer group—institutions with a similar asset size, geographic footprint, and business model. You should be comparing metrics such as:
- Productivity Ratios (e.g., loans per employee)
- Compensation and Benefits (as a percentage of non-interest expense)
- Voluntary vs. Involuntary Turnover Rates
- Staffing Levels (e.g., employees per branch or per $1 million in assets)
Data intelligence platforms like Visbanking are designed for this. They provide access to aggregated, anonymized data from thousands of institutions, allowing you to see precisely where you stand.
From Intuition to Data-Driven Strategy
For too long, critical talent decisions in banking have been guided by institutional inertia and intuition. Benchmarking replaces this guesswork with an objective, evidence-based strategy.
When the board questions back-office efficiency, anecdotes are insufficient. With a platform like Visbanking, you can present hard numbers instantly.
You might find your bank operates with 15% fewer FTEs per $100 million in assets than the peer average. This data point reframes the entire conversation, demonstrating superior operational leverage backed by market evidence.
This is how you make smarter decisions. You gain the context needed to interpret your own data, set realistic strategic goals, and allocate resources for maximum impact. You can identify where you lag the competition and must invest, and—equally important—where you lead the pack and can press your advantage.
Measuring internal engagement is the first step. The strategic advantage comes from understanding how your performance stacks up against the banks you compete with daily for talent and market share. To truly understand your performance, you must understand the landscape.
Burning Questions on Bank Employee Engagement
As leadership begins to implement a data-first employee engagement program, several critical questions consistently arise. Here are the direct answers that every bank executive requires.
What Metrics Actually Matter for a Bank?
No single metric is sufficient. The goal is a balanced dashboard that provides a complete view of workforce health, indicating both past performance and future trajectory.
Organize your metrics into three categories:
Lagging Indicators (The Rear-View Mirror): These report what has already occurred. The most critical are your voluntary turnover rate and the Employee Net Promoter Score (eNPS). A 25% turnover rate in your lending department is a clear signal of a pre-existing problem, while a low eNPS score indicates that employee loyalty has already eroded.
Real-Time Indicators (The Live Feed): These measure what is happening now. Focus on pulse survey results on specific initiatives and hard system usage data. A sharp decline in CRM logins among your relationship managers provides an unbiased, immediate view of operational adherence.
Leading Indicators (The Crystal Ball): These predict future outcomes. Closely monitor internal mobility rates and professional development participation. Promoting from within builds a robust talent pipeline and is a strong predictor of higher retention among top performers. The key is to select metrics tied directly to the bank's strategic objectives—be it loan growth, operational efficiency, or customer retention.
How Often Should We Be Measuring This Stuff?
The annual employee survey is an outdated model. It is a relic of a past era.
While a comprehensive survey every 12-24 months can be useful for identifying long-term trends, an effective management strategy requires a much higher cadence.
Implement quarterly pulse surveys. These are brief, focused, and provide immediate feedback on timely issues. Following the rollout of a new compliance process, for instance, a quick survey can identify friction points before they disrupt operations.
More importantly, behavioral data from core systems—CRM, LMS, and internal communications—should be monitored continuously. A sudden drop in training course completions for new tellers is an early warning signal that requires immediate attention, not a line item in next year's annual review. This transforms engagement from a static report into a dynamic management tool.
How Do I Prove This Actually Impacts the Bottom Line?
You stop positioning engagement as an HR initiative and start tying it directly to the P&L statement.
Begin with turnover. A 5% reduction in turnover may sound like a soft HR metric, but it represents hard-dollar savings. Calculate the fully loaded cost to replace an employee—recruitment fees, training hours, lost productivity. A $500,000 annual savings from improved retention commands attention in the boardroom.
Beyond cost savings, you must connect engagement to revenue generation. Map the engagement scores of your branches against their sales volumes, cross-sell ratios, and customer satisfaction scores.
When you can demonstrate that branches with a 10-point higher eNPS also generate 8% more in non-interest income per employee, engagement is no longer a "nice-to-have." It is a core component of your growth strategy.
By drawing these direct financial lines, you can manage your human capital with the same fiscal discipline you apply to your loan portfolio.
Knowing where you stand is the first step. Visbanking provides the peer benchmarks and integrated data to move from intuition to true insight, connecting your talent strategy directly to your financial performance.
💡 Stop just collecting data. Start making it work for you. Let’s transform banking, together. 💡
Explore how our data can sharpen your bank's competitive edge.
Related Articles

Visbanking Blog
Make More Informed Decisions with BIAS, the Data-Driven Banking Solution

Visbanking Blog
SURVEY SAYS BANK EXECS SUPPORT INDUSTRY PURSUIT OF ‘SOCIAL GOOD’

Visbanking Blog
BIAS: The Smart Choice for Banking Intelligence and Action

Visbanking Blog
BIAS: The Smart Choice for Banking Intelligence and Action

Visbanking Blog
BIAS: Your Competitive Edge in Banking Data Driven Strategy

Visbanking Blog