How to Forecast Cash Flow for Strategic Banking Decisions
Brian's Banking Blog
Forecasting cash flow is not an accounting exercise. It is a strategic discipline for mapping capital inflows and outflows to anticipate liquidity needs and optimize capital deployment.
The process is straightforward in concept: aggregate historical data, run it through a predictive model, and stress-test the results. In execution, it provides a forward-looking view of your bank’s financial health, shifting leadership from reactive reporting to proactive strategy.
Why Cash Flow Forecasting Is a Strategic Imperative

In a volatile market, managing liquidity with historical averages is no longer defensible. What was once a back-office task has moved to the boardroom.
Accurate forecasting is the bedrock of modern liquidity and risk management. It directly impacts a bank's capacity to capitalize on market opportunities while satisfying regulatory requirements. The objective is to build a framework that converts vast, complex data into clear, decisive actions.
This framework is built on three pillars:
- Granular Data Aggregation: Pulling comprehensive data from every corner of the bank—from loan prepayment schedules to deposit volatility.
- Predictive Modeling: Employing models that anticipate future cash movements with statistical confidence, moving beyond simple linear projections.
- Technology Integration: Leveraging platforms that automate data collection and transform forecasts into dynamic, actionable intelligence.
The Shift from Reporting to Proactive Decision-Making
For many institutions, forecasting remains a static, spreadsheet-driven process—an approach riddled with risk. It often fails to detect market shifts or internal changes until it is too late. A strategic approach treats forecasting as a dynamic, continuous process.
Consider the 13-week cash flow forecast, a globally recognized tool. It tracks actual cash movements weekly, providing an essential snapshot of operational cash. The focus is on real inflows and outflows, not accounting accruals. While common in other industries, its principles are critical for banking, where a timing mismatch can cause significant instability. You can dig deeper into common forecasting methods on statement.io to explore the mechanics.
The table below contrasts the legacy method with a modern, data-intelligent approach.
Forecasting Maturity Levels: From Basic to Strategic
This summary compares the traditional, spreadsheet-heavy method with a modern, data-intelligent approach. For banking executives, understanding this distinction is key to unlocking a true strategic advantage.
| Attribute | Traditional Approach (Static) | Strategic Approach (Dynamic) |
|---|---|---|
| Data Source | Manual entry from siloed systems | Automated aggregation from all core systems |
| Frequency | Monthly or quarterly | Real-time, weekly, or daily |
| Methodology | Simple extrapolation of historical trends | Predictive modeling, scenario analysis |
| Output | Static report (e.g., Excel, PDF) | Interactive dashboard with drill-down capabilities |
| Focus | Backward-looking reporting | Forward-looking, proactive decision-making |
| Integration | Isolated from other strategic functions | Fully integrated with risk and capital planning |
Migrating from the "Traditional" column to the "Strategic" one represents a fundamental change in how the bank is managed.
A forecast is not a report on what might happen. It is an analytical tool that dictates what actions must be taken. Its value is derived from driving timely, informed decisions at the highest levels.
Ultimately, mastering the cash flow forecast provides a distinct competitive edge. It gives leadership the confidence to answer difficult questions about capital allocation, risk exposure, and growth.
This is where platforms like Visbanking’s BIAS provide critical value. By adding an external layer of context, they allow you to benchmark your forecasts against peer data. An internal projection is no longer an isolated estimate—it becomes a validated strategic instrument.
Building a Defensible Data Foundation for Your Forecast
A cash flow forecast is only as reliable as the data it is built upon. Models founded on inaccuracies, gaps, or simplistic averages will produce outputs unfit for strategic decision-making.
For bank executives, ensuring data integrity is not an IT problem; it is a core business function that directly impacts risk management and capital allocation.
Look Inside First: Consolidating Your Internal Data
The most powerful predictive information resides within your own systems. The essential work is aggregating it into a single, clean, and usable dataset at a granular level.
Key internal data points include:
- Loan Payment and Prepayment Schedules: Move beyond a simple portfolio-wide average. A useful forecast segments this data by loan type, risk rating, and customer tenure to model cash inflows with precision.
- Deposit Volatility and Runoff Trends: Analyze historical data to understand how different deposit types—non-interest-bearing DDAs versus high-yield savings—react in various market conditions. This is essential for accurately predicting outflows.
- Operational Expense Projections: Track all fixed and variable costs. Payroll, rent, and software subscriptions are often predictable but must be included for a complete financial picture.
- Non-Interest Income Streams: Model fee income from services like wealth management or treasury, noting any seasonal patterns.
For example, a regional bank might find its commercial real estate portfolio has an 8% prepayment rate when interest rates fall, while its residential mortgage portfolio shows only a 3% rate. Using a blended 5.5% average misrepresents reality and compromises the entire liquidity plan.
Now, Look Outside: Integrating Macroeconomic Indicators
Internal data tells only half the story. The other half is shaped by the external economic environment that drives customer behavior and market shifts.
Integrating external inputs is non-negotiable:
- Interest rate futures (e.g., SOFR futures) to model the cost of funds.
- Regional economic data, including local unemployment rates and housing market trends.
- Industry-specific performance benchmarks.
A forecast built solely on internal history is like driving while looking in the rearview mirror. External economic drivers provide the forward-looking edge that transforms a simple projection into a true predictive tool.
Consolidating this data requires a centralized data warehouse and a robust technology stack to automate the process. Automation frees analysts from manual data entry—a low-value task prone to error—allowing them to focus on high-value analysis and scenario modeling.
This framework requires an unwavering commitment to data quality. Our guide on data governance in banking outlines best practices for building a system you can trust.
With a clean, granular, and comprehensive dataset, you can move to the next stage with confidence. This foundation enables a business intelligence platform to benchmark your projections against peer data, turning your forecast from an internal estimate into a validated, market-aware strategic asset.
Picking the Right Forecasting Model for Your Bank

Choosing the right forecasting model is a critical strategic decision. The selected model directly impacts the quality of insights available for capital allocation, liquidity management, and overall strategy. It must align with your bank's operational realities and strategic objectives.
The direct method is the most common starting point. This approach forecasts individual cash inflows and outflows, making it essential for short-term liquidity management, such as a rolling 13-week cash forecast. It provides the granular, day-to-day view required for precise operational cash management.
Conversely, the indirect method begins with net income and adjusts for non-cash items. This is better suited for long-term strategic planning. While less useful for daily treasury functions, it provides the high-level perspective that aligns with annual budgets and capital planning cycles.
Going Beyond the Basics to Predictive Analytics
The direct and indirect methods are sound but fundamentally retrospective; they extrapolate what has already occurred. A true strategic advantage comes from anticipating what will happen. This is where forecasting shifts from a bookkeeping exercise to a source of competitive intelligence.
Statistical models provide this forward-looking capability. Time-series methods like simple moving averages, exponential smoothing, and Box-Jenkins (ARIMA) models analyze historical data to identify patterns and predict future outcomes. For example, a 30-day simple moving average can smooth recent cash flow to project the next 30-90 days, offering a clear view of immediate trends. You can get a deeper dive into these methods in this treasury management guide.
These models are particularly powerful in a banking context. Consider a community bank seeking to understand its deposit behavior:
- ARIMA (AutoRegressive Integrated Moving Average) is effective at identifying seasonal deposit outflows, such as those tied to tax season or local agricultural cycles.
- Exponential smoothing assigns greater weight to recent data, which is critical when interest rates are shifting and last month’s activity is a better predictor than last year’s.
A regional bank applied exponential smoothing to its deposit data and improved its short-term cash reserve accuracy from a respectable 85% to a more defensible 95%. That 10% improvement translated into millions of dollars in either freed-up capital for lending or reduced borrowing costs.
Sanity-Check Your Model with External Intelligence
Model selection is the first step; validation is what makes it strategic. Your internal forecast must be pressure-tested against the external market.
Your model might predict 5% growth in commercial lending, but how does that compare to peers in the same market? Are they observing similar trends?
This is why a business intelligence platform is now essential for banks. A tool like Visbanking’s BIAS allows you to take your internal assumptions—on deposit runoff, loan prepayment speeds, or expense growth—and benchmark them directly against real-world peer data.
This validation step transforms your forecast from an educated guess into a strategically sound and defensible plan that can be presented to the board with confidence.
Integrating Scenario Analysis and Stress Testing
A single-point forecast provides a baseline—nothing more. Strategic insight comes from understanding how the bank's cash position will perform under adverse conditions.
Scenario analysis quantifies risk, enables the development of effective contingency plans, and transforms a static forecast into a dynamic risk management tool.
The process begins by defining plausible futures. This is not speculative; it is about preparing for a range of outcomes. The most effective approach is to build three core scenarios to anchor your planning:
- The Baseline Case: The "most likely" forecast, built on primary economic and operational assumptions. This is your steady-state scenario.
- The Optimistic Case: Models favorable conditions, such as rapid economic growth, lower-than-expected loan defaults, and positive shifts in deposit behavior.
- The Pessimistic Case: Stresses assumptions with a sudden recession, a regional downturn, or a major interest rate shock. This is the scenario that prepares you for adversity.
Modeling a High-Impact Scenario
Consider a practical example: the board wants to assess the cash flow impact of a sudden 150-basis-point interest rate hike. A proper stress test would model this event over a six-month horizon to quantify the direct impact on the balance sheet.
The analysis would evaluate the compression of the net interest margin as funding costs rise and assets reprice at varying speeds. Simultaneously, it must model potential deposit runoff as customers seek higher yields. The output is not just a number; it is a clear picture of how liquidity is constrained, enabling you to formulate a response before it is needed. For a more detailed examination, refer to our complete guide on stress testing for banks.
The diagram below illustrates the fundamental flow of this process, from initial data aggregation to final review.
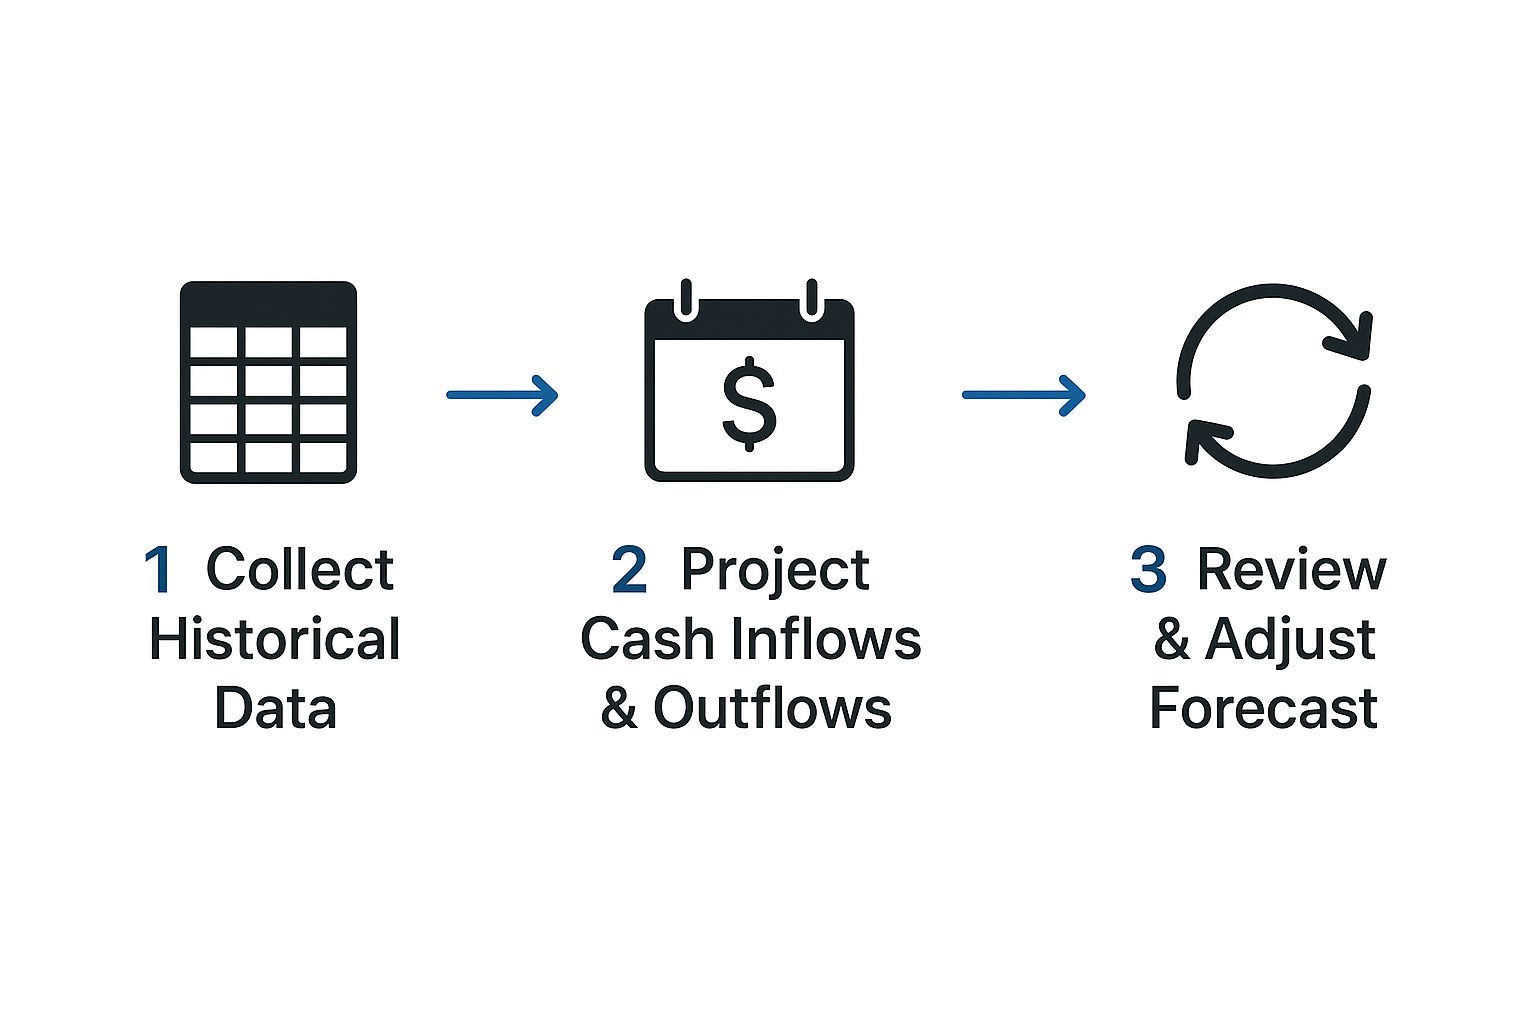
It highlights that forecasting is a continuous cycle: gather data, project outcomes, analyze scenarios, and refine the model.
The Power of Predictive Analytics in Scenarios
Modeling complex scenarios using manual methods is inefficient and imprecise. Predictive forecasting, powered by advanced analytics and machine learning, significantly enhances precision.
Manual forecasts built in spreadsheets may achieve 60-75% accuracy. Predictive models can reach the 85-95% range by identifying patterns in thousands of data points that a human analyst would miss.
By running multiple scenarios through a sophisticated model, leadership gains clarity on which risks demand immediate attention and which opportunities are worth pursuing. It is the difference between navigating with a compass and navigating with GPS.
This is where data intelligence platforms provide their greatest value. When you can benchmark your internal stress tests against peer performance under similar pressures, you gain an invaluable external perspective.
With a tool like Visbanking’s BIAS, you can validate your assumptions and present the board with contingency plans grounded not just in your own data, but in real-world market context. That is how you build confidence and ensure preparedness.
Turning Forecasts Into Action with Business Intelligence

An accurate forecast that is not acted upon is worthless. Its value is realized not when the model is complete, but when its outputs drive intelligent decisions by the board and management team. The objective is to transform the forecast from a static report into a dynamic tool for steering the bank.
This requires focusing the forecast's output on key performance indicators (KPIs) that directly influence strategy. For any bank, this means drawing a straight line from cash flow projections to critical regulatory and performance metrics.
For example, if your forecast indicates a potential decline in high-quality liquid assets, it should immediately trigger an analysis of your Liquidity Coverage Ratio (LCR). If a worst-case scenario projects a significant outflow of retail deposits, how does that impact your Net Stable Funding Ratio (NSFR)? These are not academic exercises; they are the vital links between a spreadsheet and sound risk management.
Integrating Forecasts into Your Strategic Frameworks
Insights from your cash flow forecast must be woven directly into the bank’s core strategy. The numbers must inform and validate decisions in capital allocation, risk appetite, and long-range planning.
Consider a bank whose forecast predicts a $50 million cash surplus over the next two quarters. Without an integrated strategy, this is merely a data point. With one, it prompts critical questions:
- Capital Allocation: Should this excess liquidity be deployed in a short-term, high-quality bond portfolio to enhance yield?
- Lending Strategy: Does this provide the capacity to expand our commercial lending book more aggressively?
- Risk Management: How does this surplus hold up when subjected to a mild recession scenario?
A forecast is not the end product. It is the primary input for the strategic conversations that determine the bank's direction. It quantifies possibilities and enforces a disciplined approach to decision-making.
This is why modern business intelligence for banks is no longer optional. A robust BI platform does more than visualize your internal forecast; it places those numbers in a competitive context. It allows you to see how your projected LCR compares to a curated peer group, or whether your forecasted loan growth is ambitious or conservative relative to the market.
By visualizing complex scenarios and benchmarking them against real-world industry data, a platform like Visbanking's BIAS transforms your forecast into a powerful navigational tool. It illuminates opportunities and risks requiring executive attention now, empowering your team to act with speed and confidence.
Questions from the Boardroom on Cash Flow Forecasting
When discussing the integration of sophisticated analytical tools, several key questions consistently arise from executives and directors. Here are direct, board-level answers to the most common inquiries.
How often should we be updating our cash flow forecast?
The required frequency depends on the forecast’s purpose.
For tactical liquidity management, the 13-week forecast must be a dynamic instrument, updated weekly at a minimum. It must reflect actual cash movements and short-term obligations to provide the clarity needed to manage treasury functions without surprises.
For strategic forecasts with a 12-24 month horizon, a quarterly review cadence is appropriate. However, the forecast cannot become stale. A major market event, such as a significant move in interest rates by the Federal Reserve, or an internal strategic shift necessitates an immediate update. The legacy practice of setting an annual forecast and ignoring it is obsolete. A dynamic cycle fed by real-time, automated data is the new standard.
What is the biggest mistake a bank can make with this?
The most dangerous error is an over-reliance on historical data. The past is not a reliable predictor of the future, particularly in a volatile economy. Building a forecast solely on past trends is equivalent to driving while looking only in the rearview mirror—it creates a massive blind spot for both risks and opportunities.
A model built on data from five years ago would have been completely unprepared for the deposit surges and rate shocks of the recent past. To be valuable, a forecast must be battle-tested against a range of "what-if" scenarios.
The most common forecasting failure is not a mathematical error; it is a failure of imagination. Assuming tomorrow will resemble yesterday leaves a bank dangerously exposed when the market inevitably shifts.
How do we justify the investment in a dedicated BI platform?
The return on investment is realized through smarter risk management, optimized capital allocation, and a significant competitive edge. A platform like Visbanking’s BIAS does not just generate numbers; it converts raw forecast data into actionable intelligence. It enables you to identify a potential liquidity shortfall before it becomes a crisis or determine where to deploy excess cash for a better return.
For example, accurately predicting a $30 million seasonal deposit inflow allows your team to act preemptively. They can plan to deploy that capital into short-term assets, providing a direct boost to your net interest margin. These platforms pay for themselves by transforming data from an administrative burden into a core strategic asset that drives profitability.
At Visbanking, we enable banking leaders to translate complex data into clear, strategic action. See how our BIAS platform can help you benchmark performance and validate your forecasts against real-world peer activity. Explore our data intelligence solutions today.
Latest Articles

Brian's Banking Blog
How to Increase ROE: A Data-Driven Playbook for Bank Leaders

Brian's Banking Blog
What Is SEC EDGAR and How Banks Use the Data

Brian's Banking Blog
What Is Value at Risk and Why Bank Leaders Rely on It

Brian's Banking Blog
How to Build a Leadership Pipeline for Banks

Brian's Banking Blog
Credit Bureau Data: Strategic Insights for Bank Executives

Brian's Banking Blog