What is Net Interest Margin? A Guide for Bank Executives and Directors
Brian's Banking Blog
Net Interest Margin (NIM) is the primary measure of a bank's core profitability and the ultimate scorecard for strategic execution. For any bank executive or director, a deep understanding of NIM isn't just academic—it is essential for driving intelligent, sustainable growth and ensuring long-term institutional health. This metric reveals the effectiveness of your bank's fundamental business model: generating a profitable spread between asset yields and funding costs.
What Is Net Interest Margin in Banking?

Net Interest Margin is the engine of your bank’s financial performance. It provides a raw, unfiltered view of how effectively management is executing the fundamental business of banking: borrowing money at one rate and lending it out at a higher one.
A prerequisite for this analysis is knowing how to read company financial statements.
The calculation is straightforward. Net Interest Margin is the difference between the interest income generated by assets and the interest expense paid on liabilities, expressed as a percentage of the bank’s average earning assets.
For example, if a bank generates $6 million in annual interest income against $3 million in interest expense, and its average earning assets total $100 million, its NIM is 3.0%.
For bank directors, NIM is the definitive measure of strategic efficacy. It answers, in no uncertain terms, whether asset-liability management, pricing strategy, and product mix are creating shareholder value—or silently eroding it.
The Formula for Strategic Insight
Beyond the basic calculation, the NIM formula is a powerful diagnostic tool for strategic decision-making. Its components are:
- Interest Income: All revenue generated from interest-earning assets, including commercial loans, mortgages, and investment securities.
- Interest Expense: The total cost of funds, primarily interest paid on customer deposits, CDs, and other borrowings.
- Average Earning Assets: The average value of all assets generating revenue over a specified period.
This table provides a clear breakdown of the calculation.
Net Interest Margin Calculation at a Glance
This table simplifies the components and formula needed to calculate your bank's NIM.
| Component | Description | Example Value |
|---|---|---|
| Interest Income | Total earnings from loans and investments. | $6,000,000 |
| Interest Expense | Total interest paid on deposits and borrowings. | $3,000,000 |
| Net Interest Income | Interest Income - Interest Expense. | $3,000,000 |
| Avg. Earning Assets | The average value of assets that generate interest. | $100,000,000 |
| NIM Formula | (Net Interest Income / Avg. Earning Assets) x 100 | 3.0% |
While the formula is simple, the strategic implications are profound.
A consistently strong NIM is the hallmark of a well-managed institution, signaling disciplined loan pricing, a low-cost funding base, and an efficient balance sheet. Conversely, a declining NIM serves as a critical early warning, demanding immediate analysis to diagnose the root cause before it impacts the bottom line.
To delve deeper into the mechanics, it is worth your time understanding Net Interest Margins in greater detail.
Why NIM Is a Critical Performance Indicator
High-level metrics like Return on Assets (ROA) and Return on Equity (ROE) provide a useful snapshot of overall profitability, but they are lagging indicators. They report the final score but do not explain the play-by-play.
Net Interest Margin, in contrast, is a real-time diagnostic tool. It cuts directly to the core of a bank’s operational health and is the single most important barometer of strategic effectiveness. For any bank director, mastering NIM is non-negotiable. A strong, stable NIM demonstrates proficiency in three critical domains:
- Asset-Liability Management: It confirms the ability to construct a sound balance sheet by appropriately matching long-term assets with stable funding.
- Pricing Strategy: It serves as a report card on pricing discipline. A healthy NIM indicates that loan and deposit rates are competitive enough to attract business yet profitable enough to generate value.
- Operational Efficiency: It reflects the ability to convert assets into income efficiently, generating robust interest income without overpaying for funds.
Decoding What Your NIM Is Telling You
A change in NIM is not just a fluctuating number; it is a signal demanding executive attention. It points to either a core strength to be leveraged or a weakness requiring immediate board-level intervention.
An expanding NIM is a clear positive indicator. It may suggest a successful strategic shift into higher-yielding loan categories or that a recent initiative to attract low-cost core deposits is delivering results. This is the foundation of shareholder value and long-term stability.
Conversely, a declining NIM is an early warning system. For instance, if a community bank’s NIM contracts from 3.50% to 3.25% over two quarters, that 25-basis-point decline is a significant erosion of profitability. It may signal intensifying deposit competition forcing up funding costs or a portfolio shift toward lower-risk, lower-yield assets that will suppress future earnings.
Tracking NIM is not about reporting history; it is about proactive governance. It empowers directors to ask incisive questions and shape strategy based on real-time performance data.
This is precisely where surface-level analysis fails. Instead of speculating on the cause of margin compression, a platform like Visbanking's BIAS enables a data-driven diagnosis. You can instantly benchmark your deposit rates against a custom peer group to determine if your cost of funds is escalating faster than the market. Simultaneously, you can analyze your loan portfolio to verify that new originations are priced adequately to maintain margin.
This level of clarity transforms a reactive, backward-looking board meeting into a forward-thinking strategy session. When you know exactly what is driving NIM compression—whether a specific loan product, a funding source, or market dynamics—you can shift from observing the problem to solving it.
By continuously benchmarking your NIM and its components, you ensure every decision is grounded in empirical evidence. Explore Visbanking’s data intelligence platform to see how your bank’s performance truly measures up.
Key Drivers That Influence Your Net Interest Margin

A bank's Net Interest Margin is not a static figure. It is a dynamic metric, continuously influenced by powerful forces both internal and external to your institution. For executives and directors, mastering these drivers is the difference between being dictated by market conditions and strategically navigating them. The key is to distinguish between the levers you can pull and the external factors you must anticipate.
External Drivers: The Macro Environment
External forces represent the economic environment in which you must operate.
- Federal Reserve Monetary Policy: The federal funds rate is the primary driver, establishing the baseline for nearly all other rates and directly impacting both asset yields and liability costs.
- Inflation and Economic Growth: A strong economy typically increases loan demand. However, high inflation can compress margins by driving up funding costs and provoking Fed intervention.
- The Competitive Battlefield: Intense competition for loans and deposits is a classic margin compressor, leading banks to reduce loan rates or increase deposit rates to defend market share.
Central bank policy is the most dominant external force. When the U.S. Federal Reserve adjusts its target rate, the effect is felt across every bank balance sheet. Federal Reserve research confirms a direct correlation between rising benchmark rates and expanding bank margins. During the rate-hike cycle that began in 2015, banks' NIMs increased by approximately 0.2 basis points for every 1-basis-point increase in the federal funds rate. This demonstrates a crucial principle: while you cannot control the Fed, you must anticipate its actions and model their impact on your balance sheet.
Internal Drivers: Your Strategic Levers
This is where leadership takes control. Your bank's internal strategy ultimately determines how effectively you navigate external pressures. The decisions you make regarding your asset composition and funding mix are the most powerful tools for managing NIM.
The structure of your loan portfolio is a critical determinant. A bank heavily invested in fixed-rate residential mortgages will exhibit a different NIM sensitivity compared to one focused on floating-rate commercial loans. It is essential to understand how various products, including niche offerings with specific USDA loan interest rates, contribute to your overall asset yield.
A bank's funding mix is its primary defense against margin compression. An over-reliance on high-cost, volatile funding sources like brokered deposits or FHLB advances will erode NIM, especially when rates rise. The ultimate goal is a stable base of low-cost core deposits.
This is where precise, actionable data intelligence provides a decisive competitive advantage. With a platform like Visbanking, you can move beyond speculation. You can benchmark your loan yields and deposit costs against a hand-picked peer group in real-time. This is not merely about observing numbers; it is about pinpointing exactly where your strategy is succeeding—or failing—so you can execute targeted adjustments that drive performance.
Analyzing NIM Performance with a Practical Example
Understanding the definition of Net Interest Margin is one thing; diagnosing its drivers in a real-world scenario is another. To illustrate how this metric translates into actionable intelligence, consider two peer institutions, Bank A and Bank B, each with $500 million in assets.
While similar in size, their performance reveals divergent strategies. Bank A operates with a healthy NIM of 3.80%, whereas Bank B is struggling with a compressed NIM of 2.90%. The calculation reveals the performance gap, but for executives, the critical task is to understand the why.
Deconstructing the Balance Sheet
The performance disparity originates on their balance sheets. Bank A's leadership has been deliberate in constructing a high-yielding loan portfolio, while Bank B’s strategy appears less focused.
- Bank A (NIM: 3.80%): The bank's strength lies in its commercial and industrial (C&I) loan portfolio, which generates an average yield of 5.50%. This asset growth is funded by a stable base of low-cost core deposits (checking and savings accounts) with an average cost of funds of just 0.80%. Their execution is disciplined and effective.
- Bank B (NIM: 2.90%): In contrast, Bank B’s portfolio is weighted toward lower-yielding residential mortgages, averaging a 4.20% return. More significantly, it relies on expensive certificates of deposit (CDs) and wholesale funding, which elevates its cost of funds to 1.50%.
The 90-basis-point gap in their NIMs is not accidental. It is the direct consequence of strategic decisions regarding loan pricing, product mix, and deposit acquisition. Bank A’s success reflects a proactive and disciplined approach to asset-liability management. Bank B’s margin reflects a strategy that is reactive and less efficient.
This chart illustrates how NIMs typically vary across different bank types.
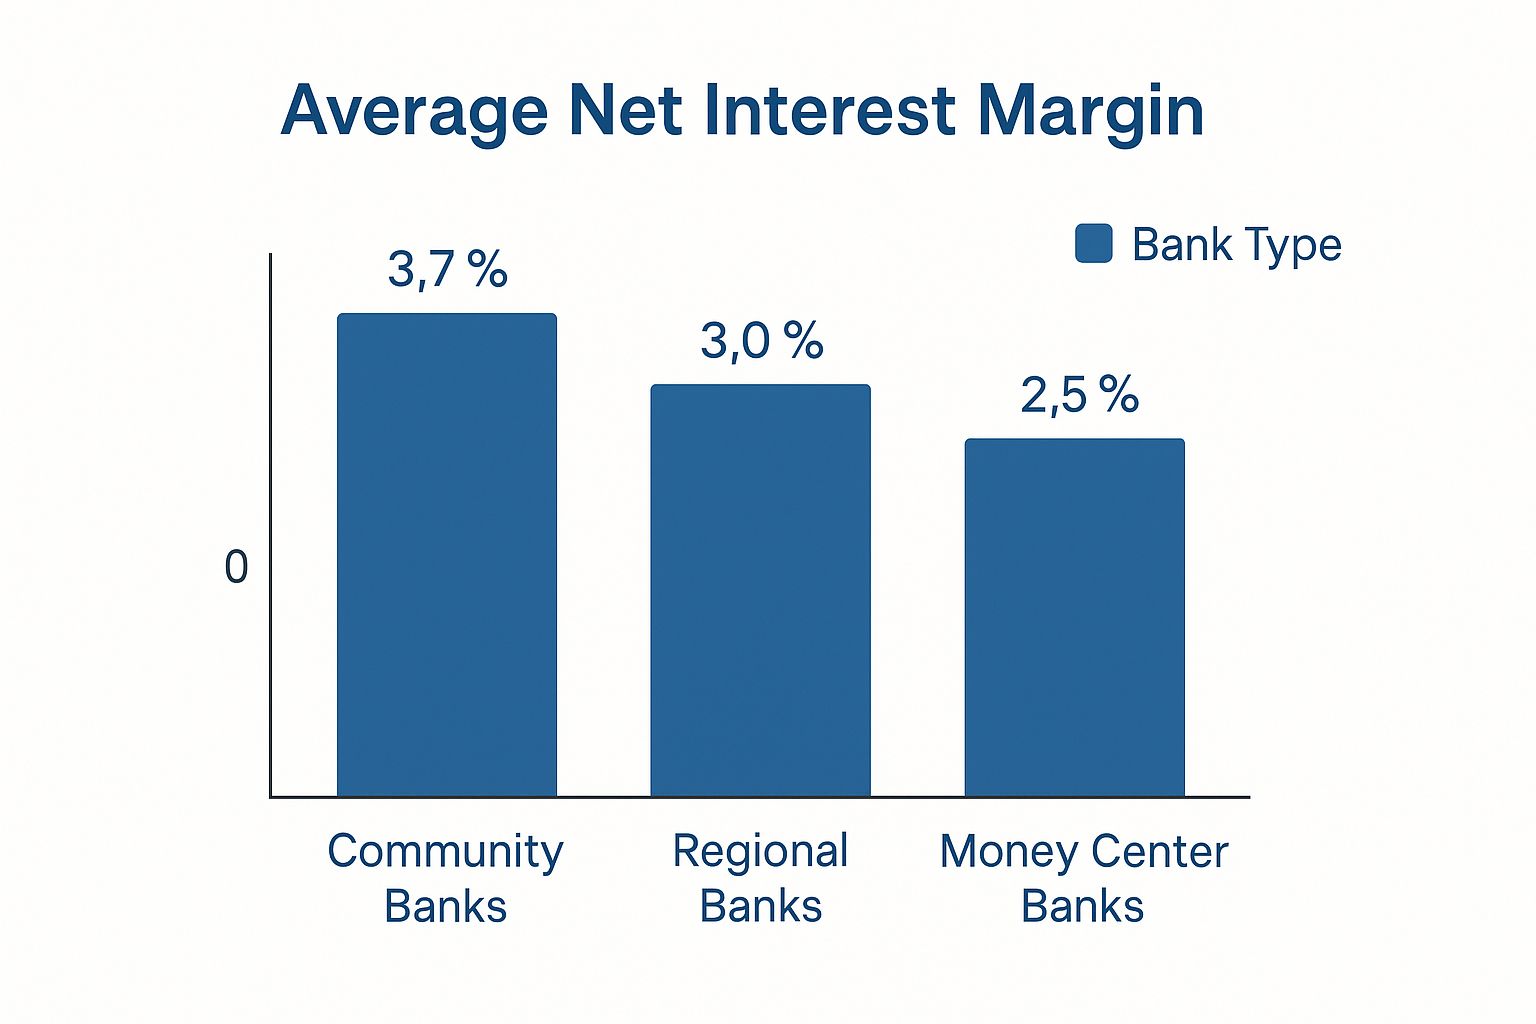
As shown, community banks often achieve higher NIMs by leveraging local relationships to attract low-cost core deposits. Large money center banks typically operate on thinner margins, compensating with scale and a broader range of non-interest income streams.
Turning Diagnosis into Action
For Bank B's board, identifying the problem is only the first step. The critical question is what action to take. A reactive approach might involve chasing higher-yield loans, a strategy that could introduce unacceptable levels of credit risk.
True strategic improvement is not achieved through high-risk bets but through granular, data-guided adjustments. The leadership team must move beyond high-level metrics to dissect the root causes of margin compression.
This is where data intelligence becomes indispensable. Instead of operating with incomplete information, Bank B's executives could use a platform like Visbanking to benchmark their deposit pricing against a curated peer group. They might discover they are overpaying for CDs by 20 basis points relative to direct local competitors—an inefficiency that erodes margin daily.
Simultaneously, they could analyze their loan portfolio's performance against the same peers, identifying specific products where pricing is misaligned with the market. This detailed insight transforms a vague problem ("our NIM is too low") into a precise, actionable strategic plan.
To see what this looks like in practice, review our guide on the net interest margin secrets top banks use to protect and expand their profitability.
Benchmarking Your NIM Against Industry Peers

Analyzing your Net Interest Margin in isolation is insufficient. To derive meaningful insight, you must benchmark your performance against the right competitors. Relying on a national average is a common error, as it ignores the local market dynamics and competitive pressures that define your operational reality.
Effective analysis requires a more precise comparison. Your NIM must be measured against a carefully selected peer group of institutions with a similar asset size, geographic footprint, and business model. A community bank in rural Texas operates in a fundamentally different environment than a Wall Street institution, and their performance benchmarks should reflect this.
So, What’s a “Good” NIM Anyway?
The answer is always "it depends," shifting with economic cycles and monetary policy.
Globally, NIMs often range between 2% and 4%. In the U.S. market, a well-run community bank might target a NIM above 3.50%, while a larger regional bank might consider 3.00% a strong result. The objective is to establish a target that is both ambitious and achievable within your specific competitive landscape.
Benchmarking is not an exercise in vanity; it is a diagnostic tool. By comparing your NIM against relevant peers, you immediately identify areas of strength to press your advantage and operational weaknesses that require immediate board-level attention.
This is where modern data intelligence platforms are transformative. A tool like Visbanking’s BIAS allows you to move beyond generic industry reports and construct custom peer groups. In seconds, you can see exactly how your loan yields, deposit costs, and overall NIM compare to the institutions you compete with every day. This clarity elevates boardroom discussions. Instead of speculating about margin pressure, you can pinpoint the cause—be it inefficient deposit pricing or underperforming loan categories—and take decisive action.
To see where you stand, explore these detailed breakdowns of the top banks by net interest margin (NIM) and identify the leaders in your specific asset class.
Putting Your Data to Work for Your NIM
Understanding Net Interest Margin is foundational. Actively managing it is what drives performance. Sustainable profitability is achieved not by passively observing metrics but by translating raw data into strategic intelligence that enables you to act before the market dictates your next move.
The right business intelligence platform allows you to deconstruct your NIM. Instead of viewing a single blended percentage, you can analyze the performance of specific loan categories, identify your most profitable loan officers, and pinpoint underperforming branches. This is how you uncover what truly drives your margin.
From Finding the Problem to Fixing It
Consider the common challenge of a local deposit price war. The reflexive response is often a broad increase in deposit rates, a move that directly compresses your NIM. A data-driven approach offers a more surgical and effective alternative.
By benchmarking your deposit rates against a custom peer group, you might discover you are overpaying for certain CD terms by 15 basis points compared to direct competitors. This insight provides a clear action plan: adjust pricing on those specific products to lower your cost of funds without triggering a widespread customer exodus. It is about converting a broad market threat into a manageable, data-informed decision.
The NIM battle is won not with a single sweeping initiative, but with a series of precise, data-backed adjustments. This is how you defend profitability, regardless of the interest rate environment.
This same principle applies to the asset side of the balance sheet. With the right analytical tools, you can model the impact of interest rate shifts on your entire loan portfolio. You can identify which assets will reprice most quickly, anticipate changes in your yields, and adjust your lending strategy proactively.
Ultimately, Net Interest Margin must be treated as a direct reflection of your daily operational decisions. With robust data intelligence, every choice—from loan pricing to deposit marketing—becomes an opportunity to strengthen your institution.
See how Visbanking’s BIAS platform delivers the peer benchmarks and deep-dive analytics to transform your data into decisive action.
Answering Your Top Questions About Net Interest Margin
Even seasoned executives grapple with the complexities of NIM. Here are answers to common questions that arise in boardrooms and strategy sessions.
How Often Should We Be Looking at Our Bank's NIM?
The board should conduct a formal, in-depth review of NIM on a quarterly basis. For senior management, the core drivers—asset yields and funding costs—require at least a monthly check-in. In a volatile interest rate environment, this frequency must increase. Swift, decisive adjustments are critical to protecting your margin.
Is It Possible for a Bank’s NIM to Be Too High?
Absolutely. An exceptionally high NIM may appear positive, but if it significantly exceeds peer levels, it could signal excessive risk. Is the bank heavily concentrated in high-risk loan categories? Is its deposit pricing unsustainably low? A high NIM must always be evaluated in the context of asset quality, credit risk, and liquidity.
My NIM Is Shrinking. What's the First Thing I Should Do?
The first step is a data-driven diagnosis to identify the root cause. Are asset yields declining? Are funding costs accelerating? Or is the balance sheet mix shifting unfavorably?
This is where a sharp data intelligence tool becomes non-negotiable. It’s the only way to see how your loan and deposit pricing stacks up against the market in real-time. You can pinpoint exactly where the problem is and make strategic moves before a small leak becomes a major threat to your bottom line.
Guesswork won't fix your NIM—precision will. With Visbanking, you can benchmark your performance against the right peers, model the impact of strategic changes, and turn your data into decisive action. See how to get the clarity you need to lead with confidence at https://www.visbanking.com.
Latest Articles

Brian's Banking Blog
What Is Market Penetration and How Banks Can Measure It

Brian's Banking Blog
Revenue Growth Strategies: 10 Data-Driven Tactics for Banks

Brian's Banking Blog
What Is Historical Analysis? a Banker's Working Definition

Brian's Banking Blog
Customer Churn Prediction: A Practical Guide for Banks

Brian's Banking Blog
Social Network Analysis for Banking: A Practical Guide

Brian's Banking Blog