Return on Assets for Banks: A Guide for Executive Decision-Making
Brian's Banking Blog
Return on Assets (ROA) is the definitive measure of a bank's operational performance. It provides an unvarnished assessment of management's ability to convert the institution's asset base into net income. For bank executives and directors, a strong ROA is the ultimate validation of strategy and execution.
A high ROA indicates superior operational efficiency and robust financial health. It answers the fundamental question facing every leadership team: for every dollar held in assets, how much profit is being generated? In a competitive market, a clear understanding of ROA isn't just a metric—it's a critical tool for strategic decision-making.
Why ROA Is an Indispensable Executive Metric
For the C-suite, ROA transcends regulatory reporting. It is the purest test of profitability derived from the balance sheet. By stripping away the distorting effects of financial leverage and asset size, ROA offers a clean, direct comparison of core operational performance against peers.
Ignoring ROA is tantamount to operating without a compass. It is the key indicator of how effectively capital is being deployed to drive profits.

The formula, Net Income / Total Average Assets, is straightforward. Its power lies in recognizing that each input is the direct outcome of hundreds of strategic decisions made by your team, from loan pricing and underwriting standards to operational expense management.
The Core Components of Bank ROA
To effectively manage ROA, leadership must focus on its two primary inputs. Each metric is a direct reflection of strategy and execution, offering a clear target for executive action.
| Metric | What It Measures | Executive Action Point |
|---|---|---|
| Net Income | The bottom-line profitability after all expenses, taxes, and provisions. | Drive higher yields through disciplined loan pricing and asset mix optimization; control operating expenses relentlessly. |
| Total Average Assets | The entire pool of resources the bank utilizes to generate earnings. | Strategically shape the balance sheet by balancing high-yield commercial loans with lower-risk securities and necessary fixed assets. |
Every choice, from M&A activity to branch strategy, directly impacts these two figures. They are the twin engines of your bank's profitability engine.
Where Strategic Performance is Decided
Consider two institutions. Bank A, with $2 billion in assets, generates $20 million in net income, achieving a 1.0% ROA. Bank B, a competitor with the same $2 billion asset base, generates $24 million in net income, resulting in a 1.2% ROA. That 20 basis point differential represents a 20% performance advantage.
This gap is where leadership proves its worth. Top-performing banks consistently differentiate themselves here. This is the unvarnished truth of operational efficiency. To gain a competitive advantage, historical self-assessment is insufficient. You must benchmark precisely against a relevant peer group. Data intelligence platforms like Visbanking provide this capability, enabling you to benchmark not just ROA, but its core drivers, against a curated peer set. This shifts the focus from rearview reporting to forward-looking strategic navigation.
Deconstructing the ROA Formula for Strategic Insight
To materially improve ROA, executives must analyze its constituent parts. While the formula is simple, its inputs—Net Income and Total Average Assets—are where strategic decisions manifest. This is how ROA is transformed from a historical metric into a forward-looking management tool.
This infographic illustrates the interplay between the income statement and the balance sheet in determining final ROA.
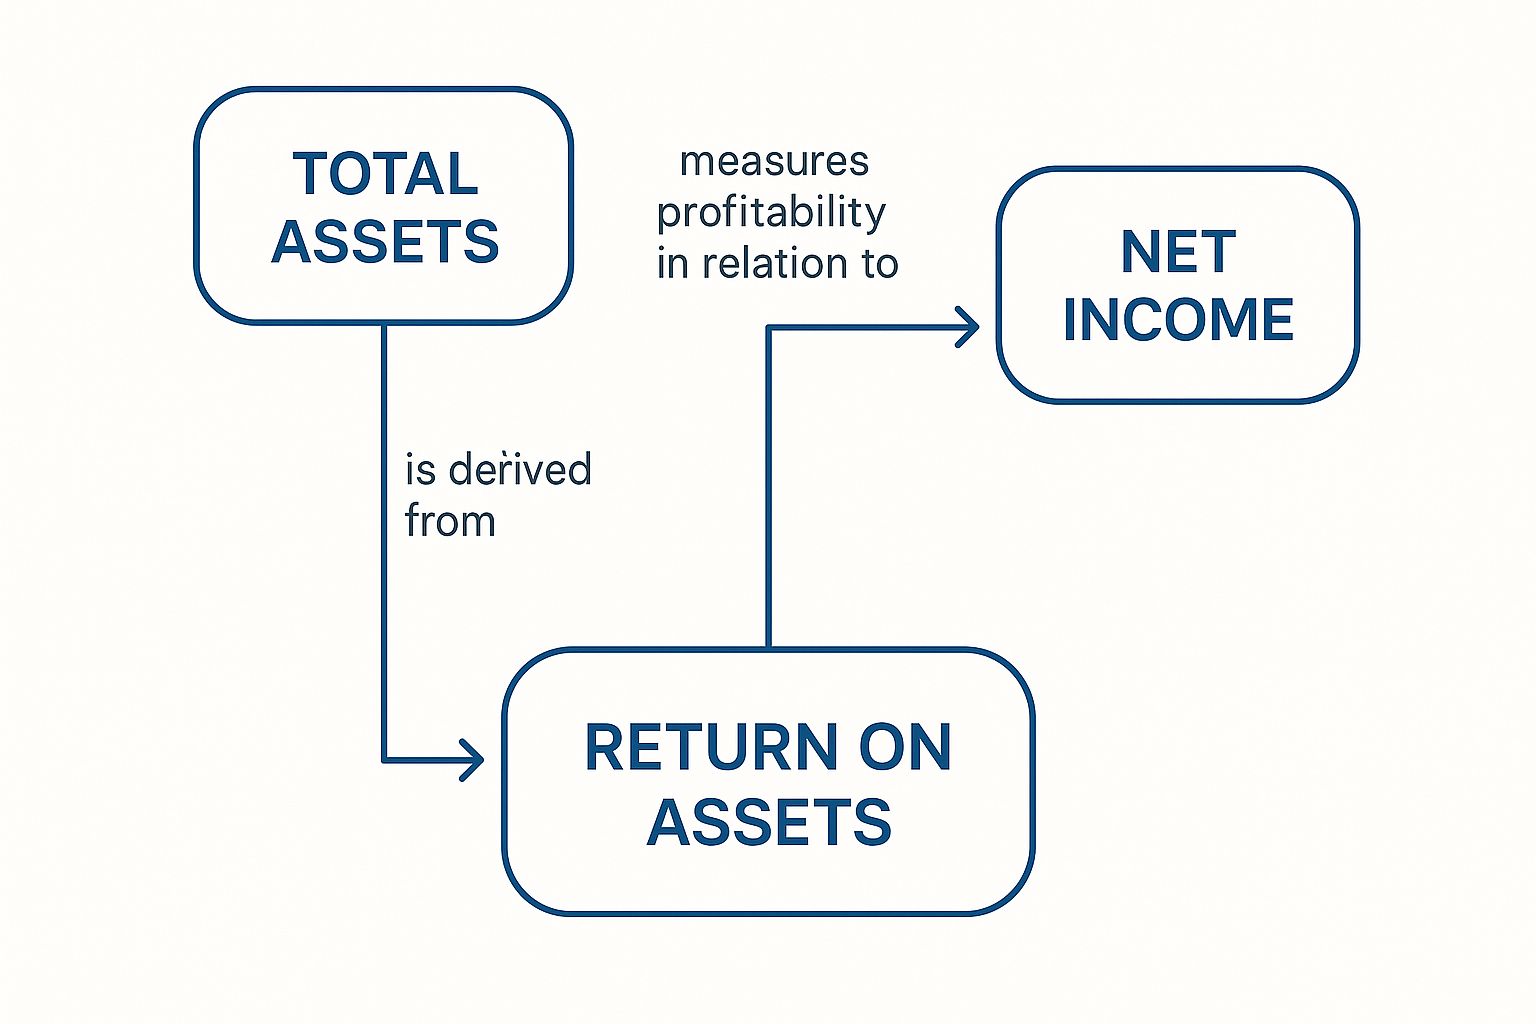
Both sides of the equation offer distinct strategic levers. Effective management requires a continuous balancing act between deploying assets and generating income.
The Numerator: The Income Generation Engine
Net Income is the primary driver of ROA and is shaped by three critical components:
- Net Interest Income: The traditional core of bank profitability, determined by loan volume, asset yields, and the cost of funds.
- Non-Interest Income: Fee-based revenue from services such as wealth management, treasury services, and deposit account fees. This provides a crucial hedge against interest rate volatility.
- Provisions for Credit Losses: A direct reflection of the portfolio's risk profile and the discipline of the underwriting function.
Consider two banks, each with $500 million in assets. Bank A focuses on traditional commercial lending, generating $5.5 million in net income for a solid 1.1% ROA.
Bank B, however, has strategically invested in its wealth management division, which contributes an additional $1 million in non-interest income. Its net income reaches $6.5 million, elevating its ROA to a superior 1.3%. That 20 basis point advantage is the direct result of strategic diversification.
The Denominator: The Asset Mix
A bank’s Total Average Assets represent a portfolio of strategic choices. The composition of this denominator dictates its earning power. A balance sheet dominated by high-yield commercial and industrial (C&I) loans will inherently perform differently than one weighted toward lower-yield municipal securities.
Every asset on the balance sheet carries an implicit performance mandate. The role of leadership is to ensure the asset mix is optimized to meet and exceed those expectations. Every dollar must be a productive, profit-generating instrument.
This strategic management of assets and income separates market leaders. Historical data confirms this. The U.S. banking sector's ROA peaked at 1.37% in 2004 before falling to -1.86% during the 2008 financial crisis, later stabilizing around 1.2% to 1.3% by 2023. These fluctuations underscore the strategic importance of resilient income streams and an optimized asset base. You can explore further data on historical banking ROA trends to analyze these cycles.
By deconstructing ROA, you can benchmark the drivers behind the headline number. A data intelligence platform like Visbanking provides the granular peer data required to dissect these components, pinpointing strategic advantages and identifying areas for improvement.
Benchmarking Bank ROA in Today's Competitive Landscape
What constitutes a "good" ROA? The outdated benchmark of 1% is no longer a sufficient guide for strategic assessment. In the current market, performance is relative and context is paramount. An ROA that is exceptional for a money-center bank may signal weakness for a community bank with a distinct asset composition and risk profile.
Meaningful benchmarking is not about a single number; it requires a layered analysis against a true competitive set. The objective is not to find a single right answer, but to ask the right questions using the right data.
Adjusting Expectations Based on Strategic Context
For performance targets to be meaningful, they must be based on apples-to-apples comparisons. Performance varies significantly across banking segments.
- Asset Size: A $500 million asset bank operates with different economies of scale than a $10 billion institution. Their baseline ROA expectations will naturally differ.
- Business Model: A mortgage-centric bank possesses a different ROA profile than one focused on high-yield C&I lending. Each model has unique yields, risks, and operational cost structures.
- Geographic Market: Operating in a high-growth metropolitan area presents different opportunities and competitive pressures than in a stable rural market.
Without this context, benchmarking is an exercise in generating noise. A generic industry average is strategically useless; a tailored peer group comparison provides actionable intelligence.
Suppose your bank achieves a 1.05% ROA, surpassing the historical 1% standard. However, data reveals that your direct peer group—banks of similar asset size and business mix in your region—is averaging 1.20%. The perspective shifts immediately. You are not leading; you are trailing by 15 basis points, a performance gap that demands executive attention.
This is where data intelligence platforms are indispensable. While raw data is publicly available, and understanding where to find bank call reports is a starting point, manual analysis is inefficient and prone to error.
Tools like Visbanking eliminate this friction. They enable leadership to move beyond broad averages and construct curated peer groups that mirror your bank's specific profile. This data-driven approach transforms performance measurement from a guessing game into a strategic discipline, providing the clarity needed to set realistic targets and drive superior results.
Identifying the Key Drivers of Bank ROA
Banks that consistently deliver high ROA do so through disciplined execution, not luck. Their strategic decisions are reflected directly on the balance sheet and income statement.
Consider two hypothetical institutions: Bank A, a top performer with a 1.4% ROA, and Bank B, struggling at 0.6%. This performance delta is not random; it is the direct outcome of their distinct financial structures and strategic choices. Analyzing these differences provides a powerful diagnostic framework for identifying areas of improvement within your own institution.
The Anatomy of a High-Performer: Bank A (1.4% ROA)
Bank A’s success is built on a foundation of data-informed strategy. Its leadership focuses relentlessly on both sides of the ROA equation: maximizing income from assets and maintaining stringent cost controls.
Three factors distinguish their performance:
- Optimized High-Yield Loan Portfolio: Bank A actively manages its asset composition, focusing on well-underwritten commercial loans and other profitable niches that generate superior net interest margins. It avoids over-concentration in low-yield government securities.
- Robust Non-Interest Income Streams: Recognizing the risk of over-reliance on net interest income, Bank A has developed strong treasury management and wealth advisory services. This diversified fee income provides a critical buffer against interest rate fluctuations. For a deeper analysis, explore our guide on bank interest vs. non-interest income.
- Exceptional Operational Discipline: A low efficiency ratio demonstrates mastery of expense control. Strategic investments in technology and process automation minimize non-interest expense, ensuring a higher percentage of revenue reaches the bottom line.
Diagnosing the Underperformer: Bank B (0.6% ROA)
Bank B’s substandard ROA signals significant strategic and operational issues. Its profitability is eroded by inefficiency and a mismanaged risk profile.
A deeper analysis reveals the root causes:
- Over-Reliance on Low-Yield Assets: A significant portion of Bank B's balance sheet is allocated to low-margin securities, depressing its overall asset yield.
- Bloated Operating Costs: A high efficiency ratio points to systemic operational deficiencies. Legacy systems and manual processes are inflating non-interest expenses, directly eroding profitability.
- Deteriorating Credit Quality: A rise in non-performing assets has increased provisions for loan losses, directly reducing net income and indicating potential weaknesses in underwriting standards.
The performance gap between Bank A and Bank B illustrates a fundamental truth: superior return on assets is the outcome of disciplined execution across multiple strategic fronts. It is not achieved by a single initiative, but by the cumulative effect of hundreds of sound, data-driven decisions.
Of course, external factors matter. A bank's ROA is influenced by its operating environment. Banks in emerging markets like Burundi have reported ROAs as high as 4.26%, while those in mature economies like Australia are closer to 0.64%. These figures highlight how local credit demand and market dynamics shape performance. You can discover more about these global banking performance metrics for a global perspective.
Mastering ROA requires moving beyond headline numbers. With a platform like Visbanking, you can benchmark every component of your performance—from asset yield to expense ratios—against a true peer group. This is how diagnostics are converted into decisive action.
Actionable Strategies to Improve Your Bank's ROA
Achieving a superior return on assets is the direct result of disciplined, enterprise-wide execution. For executives, this requires implementing concrete strategies that directly impact the bottom line. Improving ROA hinges on a three-pronged approach: optimizing asset productivity, diversifying revenue, and enforcing rigorous expense control.

This playbook is built on three pillars of bank management. Each offers a powerful lever for driving ROA higher and translating strategic vision into measurable financial results.
Optimizing Asset Yield
The core of a bank's profitability is its ability to generate maximum return from its asset base. Underperforming assets are a drag on ROA. The objective is to ensure every dollar on the balance sheet is productively employed.
- Implement Risk-Adjusted Loan Pricing: Move beyond standardized pricing. Dynamic models that account for credit quality, relationship depth, and market conditions are essential for protecting and expanding net interest margins.
- Actively Manage the Asset Mix: Continuously analyze portfolio performance. If data reveals your C&I loan portfolio yields 150 basis points more than your commercial real estate book for a similar risk profile, that is a clear directive for capital reallocation and business development focus.
- Proactively Manage Interest Rate Risk: Position the balance sheet to perform in various rate environments. This involves managing the duration of assets and liabilities to insulate net interest income from adverse rate movements.
Expanding Non-Interest Income
Over-reliance on net interest income creates vulnerability. A robust stream of fee-based revenue provides a critical buffer when margins compress or the economy slows, directly boosting the numerator in the ROA calculation.
A bank generating 30% of its revenue from non-interest sources is fundamentally more resilient and profitable than a peer at 15%. This diversification is a core component of a high-performance ROA strategy.
Growth in this area requires investment in services that deepen client relationships and generate consistent fees. Key areas of focus include:
- Wealth Management and Advisory Services: Build the teams and platforms to serve high-net-worth individuals and families, creating a stable, high-margin revenue stream.
- Treasury and Cash Management Solutions: Offer sophisticated payment, collection, and liquidity management tools for commercial clients. This secures valuable operating accounts and generates significant service charges.
Driving Operational Efficiency
Every dollar saved in non-interest expense flows directly to net income, providing the most immediate lift to ROA. Operational discipline is a key differentiator between average and top-quartile banks.
A bank with a 55% efficiency ratio is operating at a significant advantage over a competitor at 70%. That gap represents millions in potential profit lost to inefficiency. Closing it requires a focus on:
- Process Automation: Identify and automate repetitive, manual back-office tasks such as loan processing and compliance reporting to reduce labor costs and minimize errors.
- Network Optimization: Use data on branch traffic, transaction volume, and profitability to make informed decisions about consolidation, relocation, or redesign of the physical footprint to align with modern customer behavior.
Executing these strategies effectively requires precise data, not intuition. Intelligence platforms like Visbanking provide the granular peer benchmarks needed to identify underperforming loan segments, assess fee income potential against top performers, and validate the impact of expense control initiatives. Actionable data is the catalyst that transforms strategic plans into measurable ROA improvement.
Using Data Intelligence to Master ROA Performance
In today's banking environment, managing by intuition is a recipe for mediocrity. While ROA is a critical metric, treating it as a simple historical report card is a strategic error. Leading banks leverage ROA as a forward-looking management tool, powered by deep data intelligence.
This approach moves beyond top-line numbers. It involves granular peer analysis, benchmarking every component of the income statement and balance sheet, and modeling the potential ROA impact of strategic decisions before they are made. This is the new competitive imperative for banks committed to market leadership.
From Reactive Reporting to Predictive Strategy
Data intelligence fundamentally changes the executive dialogue. The question evolves from, "What was our ROA last quarter?" to "What will our ROA be if we reallocate $50 million in capital from securities to C&I lending?" It provides quantitative answers to the most critical strategic questions.
Consider a practical example. Your bank's ROA is 1.1%, while a key competitor with a similar asset profile is at 1.3%. A surface-level comparison is useless. A robust data platform, however, can reveal that the peer institution generates 40 basis points more in non-interest income and operates with an efficiency ratio that is 500 basis points lower. The mystery is solved; you now have an actionable roadmap for closing the performance gap.
For bank leaders, this level of insight is non-negotiable. It is how you validate strategic assumptions, identify underperforming business units, and align the entire organization around clear, data-driven profitability targets.
This data-driven focus is especially critical in the current economic climate. A rising interest rate environment provided a tailwind that lifted industry-wide profitability. When that tailwind subsides, performance will be dictated by execution. Global banking analysis suggests that without this lift, returns could fall near or below the cost of capital, a stark reminder of why disciplined, data-informed management is essential.
Modern business intelligence platforms for banks are designed to deliver precisely this clarity. They synthesize complex financial and market data, enabling executives to benchmark, prospect, and model strategic scenarios with confidence.
Common Executive Questions on Bank ROA
The following are common questions from bank executives and directors regarding the strategic application of ROA. Understanding the formula is one thing; using it as a tool for decisive leadership is another.
What is the distinction between ROA and ROE?
ROA measures management's effectiveness at generating profit from the bank's total asset base. It is a pure measure of core business profitability and operational efficiency.
ROE (Return on Equity), conversely, measures the return generated for shareholders. It is significantly influenced by financial leverage. A high ROE paired with a mediocre ROA is a critical red flag, often indicating that performance is being inflated by debt rather than by superior operational execution.
Can a bank's ROA be too high?
Yes. An ROA that is a significant outlier compared to the peer group warrants scrutiny, not just celebration. An unusually high ROA can indicate excessive risk-taking, such as chasing yield through loosened underwriting standards in the loan portfolio. It could also suggest underinvestment in critical areas like technology, compliance, or talent development. These short-term gains often create long-term vulnerabilities. Benchmarking against a relevant peer group is essential to interpret the number correctly.
How frequently should the board review ROA?
ROA and its underlying components should be a standing agenda item for board review on a quarterly basis. It is not an annual metric. The analysis should not occur in a vacuum; your bank's ROA must be presented alongside detailed peer data. This comparative context is the only way for the board to accurately assess institutional performance and validate that long-term strategies are delivering the intended results.
Mastering performance requires moving beyond surface-level metrics. With Visbanking, you can deconstruct your ROA, benchmark every component against your true competitive set, and model strategic initiatives with confidence. Stop guessing. Start making decisions fueled by intelligence. Explore the Visbanking platform and discover how our data drives decisive action.
Related Articles

Visbanking Blog
How Bank Efficiency Ratios Reveal Hidden Operational Costs

Visbanking Blog
ROA vs ROE: Which Banking Metric Predicts Future Success?

Visbanking Blog
Bank Efficiency Ratio Explained: What 60% Really Means

Visbanking Blog
Understanding the Return on Assets (ROA) and Return on Equity (ROE) in Banking

Visbanking Blog
Capital Banking in the USA: An Overview of Investment Services, Financial Instruments, and Regulations

Visbanking Blog