Mastering the Non Performing Loans Ratio for Strategic Advantage
Brian's Banking Blog
In the boardroom, one number tells the unvarnished truth about your bank's asset quality: the non performing loans ratio. This metric is a direct measure of your loan portfolio's health, calculated by dividing the value of non-performing loans by the total value of all loans. A rising ratio is a clear signal of escalating credit risk, threatening both profitability and regulatory standing. For leadership, mastering this metric is not a matter of compliance—it is a core strategic imperative.
Decoding the Non Performing Loans Ratio

For a bank's leadership team, the Non-Performing Loans (NPL) ratio is the definitive gauge of credit risk management. It answers the fundamental question: "What portion of our loan portfolio is at immediate risk of default?" A loan is classified as non-performing once a borrower has failed to make scheduled payments for a specified period, typically 90 days or more.
The calculation is straightforward:
NPL Ratio = (Total Non-Performing Loans / Total Gross Loans) x 100
The simplicity of the formula belies its strategic gravity. A high or rapidly increasing NPL ratio immediately attracts the attention of regulators, investors, and rating agencies. It signals potential deficiencies in underwriting, exposure to sectoral economic downturns, or inadequate loan monitoring.
The Impact on Bank Performance
A low NPL ratio is the hallmark of a disciplined institution with a healthy loan portfolio and effective credit risk strategies. For example, a bank with $2,500,000,000 in gross loans and just $15,000,000 in NPLs maintains a formidable NPL ratio of 0.60%. This demonstrates stability and frees capital for growth initiatives rather than tying it up in loss provisions.
Conversely, a high ratio directly erodes profitability. If that same bank’s NPLs increased to $50,000,000, its ratio would climb to 2.0%. This necessitates a significant increase in loan loss provisions, which directly reduces net income and can constrain the bank's capacity to lend.
For senior executives, the NPL ratio is a narrative about risk, profitability, and operational effectiveness.
NPL Ratio At-a-Glance Executive Summary
| Component | Executive Takeaway |
|---|---|
| Formula | (NPLs / Gross Loans) x 100. A simple, powerful measure of portfolio health. |
| Definition of NPL | Typically, loans overdue by 90+ days. This is the primary indicator of default risk. |
| Low Ratio (<1.0%) | Signals strong underwriting and effective credit risk management. Frees up capital for growth. |
| High Ratio (>2.0%) | A major red flag. Erodes profitability, requires higher provisions, and invites regulatory scrutiny. |
| Strategic Importance | A core KPI for assessing financial stability, operational efficiency, and competitive standing. |
Ultimately, a higher NPL ratio means more of the bank's resources are diverted to managing problem assets instead of generating new, profitable business. It is a direct drag on performance.
A Global Perspective on Credit Risk
Context is critical. A "good" NPL ratio varies significantly with the economic environment. The global average NPL ratio hovered around 5.8% in 2022, but this figure masks vast regional disparities. While mature economies like the USA often report ratios around 0.7%, other countries contend with far higher levels of credit risk, reflecting local economic conditions and financial stability. You can discover more insights about global non performing loan trends to gain a broader perspective.
Understanding your bank's NPL ratio is a matter of strategic foresight. It is the starting point for asking critical questions about portfolio health and competitive positioning. This is where data intelligence platforms like Visbanking become indispensable, providing the tools to not only track this metric but to benchmark it against a curated peer group, transforming raw data into actionable intelligence.
Why the NPL Ratio Is a Strategic Indicator
Viewing the Non-Performing Loans (NPL) ratio as a mere historical metric is a critical misjudgment. This indicator is one of the most powerful forward-looking signals of a bank's strategic health—the canary in the coal mine. A rising NPL ratio is a clear warning light on the dashboard, demanding board-level attention. It may point to deteriorating underwriting standards, sector-specific economic headwinds missed by loan officers, or a failure of discipline in risk appetite.
Conversely, an excessively low NPL ratio is not necessarily a sign of superior management. It may indicate that lending is overly conservative, stifling growth and ceding market share to more aggressive competitors. The optimal ratio reflects a prudent, calculated risk appetite aligned with strategic growth objectives.

From Metric to Bottom-Line Impact
The connection between the NPL ratio and the bottom line is direct and unforgiving. Every basis point increase carries a tangible cost that reverberates through the financials, impacting three key areas:
- Loan Loss Provisions: As NPLs rise, regulatory and accounting standards mandate increased provisions, creating a direct charge against earnings.
- Net Interest Margin (NIM): Non-performing assets do not generate interest income. They become dead weight on the balance sheet, compressing the NIM.
- Capital Adequacy: Higher provisions erode retained earnings, a critical component of Tier 1 capital. A persistently high NPL ratio can weaken the capital base, constraining lending capacity and attracting heightened regulatory scrutiny.
Consider a bank with a $2,000,000,000 loan portfolio. If its NPL ratio increases by just 50 basis points, from 0.75% to 1.25%, it adds $10,000,000 in non-performing assets. This could easily compel the bank to set aside several million dollars in additional provisions, depressing quarterly earnings and shareholder value.
A rising non performing loans ratio is not just a credit risk problem; it's a direct threat to profitability and capital. It signals that past decisions are actively eroding future performance, demanding immediate strategic review.
A Global View on Regional Risks
The forces driving NPLs are predominantly regional. An examination of global data confirms this. For example, as of March 2025, banks in the Gulf Cooperation Council (GCC) region held approximately 5.5% of the world's total NPLs, despite accounting for only 2.8% of global banking assets. This significant disparity highlights unique local risk factors, such as exposure to volatile oil prices. You can learn more about how these banks are turning non-performing loans from risk to opportunity.
The lesson for U.S. banking executives is clear: national averages are of limited utility. True insight comes from analyzing economic pressures within your specific operating footprint.
The NPL ratio must be treated as a dynamic, strategic tool. It compels leadership to ask tough questions about underwriting quality, portfolio concentrations, and the efficacy of loan monitoring. Answering these questions requires more than a headline number; it demands context. This is precisely the role of modern bank intelligence platforms. By enabling you to benchmark performance against a custom peer group, platforms like Visbanking transform the NPL ratio from a lagging indicator into a powerful instrument for proactive leadership.
Benchmarking Your NPL Ratio for Competitive Edge
In isolation, your non-performing loan ratio is a static number. To become actionable intelligence, it requires context. In banking, context is derived from rigorous, relevant benchmarking. Relying on a national average is a flawed approach that can foster a false sense of security or trigger unnecessary alarm. The essential question is not "How do we compare to the industry?" but "How are we performing against our true peers?"
Effective benchmarking involves comparing your NPL ratio against institutions of similar asset size, geographic focus, and loan portfolio composition.

From Static Reports to Dynamic Insights
Traditional benchmarking required manually parsing quarterly FDIC call reports—a time-consuming process that yields outdated information. By the time the analysis is complete, market conditions have evolved. Modern bank intelligence platforms provide dynamic, near real-time peer analysis, enabling proactive rather than reactive decision-making.
Consider this practical example: A community bank in the Midwest has a non-performing loans ratio of 1.2%. The national average is 0.9%. Based on this broad comparison, management might conclude their performance is acceptable for their region.
However, a deeper analysis using a data intelligence tool reveals a different story. When benchmarked against other banks in their state with assets between $1,000,000,000 and $3,000,000,000, the peer group average NPL ratio is only 0.75%.
This insight immediately reframes the boardroom discussion. The narrative shifts from 'we're performing adequately' to a more urgent inquiry: 'Why do we trail our direct competitors by 45 basis points?'
This performance gap is a significant red flag, prompting an immediate review of underwriting standards, collection strategies, and portfolio concentrations that would have otherwise been overlooked.
The Power of Granular Peer Groups
A generic peer group offers little strategic value. The utility is in the granularity. A bank focused on agricultural lending operates in a different risk environment than a bank specializing in urban commercial real estate. Meaningful benchmarking requires segmenting peers by critical factors:
- Asset Size: A $500,000,000 bank faces different challenges and opportunities than a $20,000,000,000 regional institution.
- Geography: Local economic conditions are a primary driver of loan performance. A bank in a rapidly growing technology hub operates under different pressures than one in a region dependent on a single industry.
- Loan Portfolio Composition: Comparing a bank with a 60% concentration in residential mortgages to one with a 60% concentration in construction loans is an invalid comparison.
Without this level of detail, you are operating without a complete picture. Is a recent uptick in your NPL ratio an internal issue or a regional trend impacting all competitors? The right data provides the answer.
This is the precise function of a dedicated bank intelligence system. It allows you to build custom peer groups, identify trends as they emerge, and provide leadership with the sharp, contextualized data required to maintain a competitive advantage. When executed correctly, benchmarking transforms the non-performing loans ratio from a historical record into a strategic weapon, enabling you to anticipate risk, identify opportunities, and make critical decisions with confidence.
Explore how Visbanking's performance tools can equip your institution with the real-time, granular peer benchmarking needed to turn data into a decisive advantage.
Diagnosing the Root Causes in Your Loan Portfolio
A single non-performing loans ratio is merely a snapshot. The strategic value lies in the trend line. While peer benchmarking reveals your competitive position, the critical question for leadership is why the ratio is what it is. A rising NPL ratio is a symptom; the objective is to diagnose the underlying disease. This requires moving beyond the headline number and using granular data to identify the specific drivers of asset quality deterioration.
Get Granular to Find the Real Problem
Effective diagnosis requires dissecting the loan portfolio with surgical precision. A reactive, portfolio-wide policy change is a blunt instrument that can harm healthy lending segments. The goal is to isolate the problem at its source through a granular analysis of your data. Data intelligence platforms like Visbanking are designed to facilitate this deep dive, helping executives move beyond surface-level metrics to uncover the root causes of credit stress.
The most powerful diagnostic tool is segmentation. By breaking down NPL data, leadership can identify concentration risks that are invisible at the portfolio level. Key questions include:
- By Industry: Are defaults concentrated in a specific sector, such as commercial real estate or hospitality? This may indicate macroeconomic headwinds or a flawed underwriting model for that industry.
- By Geography: Is one specific MSA or county driving the increase? This could point to localized economic distress, such as a major employer closure.
- By Loan Product: Is a specific product, such as unsecured personal loans or a particular type of construction loan, underperforming? This may signal a flaw in product design or an overly aggressive sales strategy.
- By Origination Vintage: Are loans originated in a specific quarter or year—for instance, Q2 2022—defaulting at a higher rate? This is a strong indicator of issues with underwriting standards or policy changes during that period.
For example, a regional bank's NPL ratio increases from 0.80% to 1.10% in six months—a 30 basis point rise demanding explanation. An initial reaction might be to tighten lending standards across the board. However, by segmenting its NPLs, the bank discovers that 90% of the increase is attributable to a specific portfolio of hospitality loans originated between 2021 and 2022. The problem is not a systemic failure but a specific underwriting issue. The solution becomes targeted: deploying a dedicated workout team for that loan cohort and conducting a rigorous review of that vintage's origination process, all without stifling new, healthy loan growth.
This infographic illustrates the fundamental challenge: a small percentage of non-performing assets can command a disproportionate amount of strategic attention and capital.
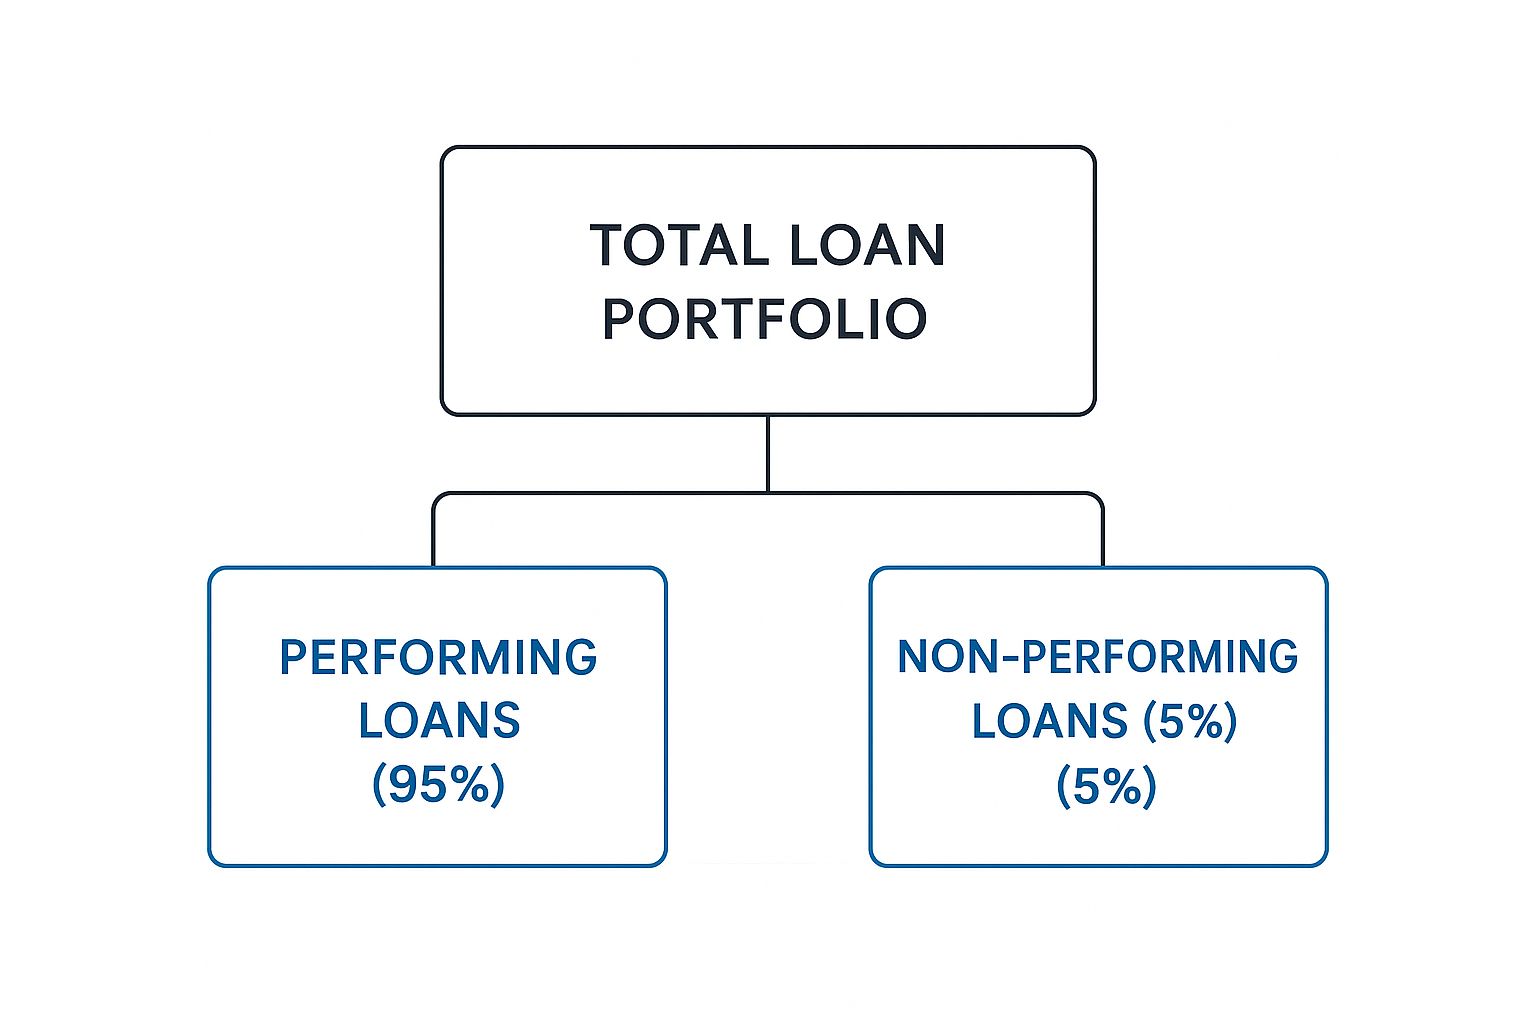
Even a seemingly manageable 5% NPL figure represents a segment of the portfolio requiring intensive management, capital allocation, and a clear resolution strategy to prevent further losses.
Finding the "Why" Behind the Numbers
To understand the drivers of a rising NPL ratio, bank leadership must ask sharp, data-driven questions, moving from observation to diagnosis. The table below outlines common drivers and key diagnostic questions.
Diagnosing NPL Ratio Drivers
| Potential Driver | Key Diagnostic Question for Leadership | Data Needed for Analysis |
|---|---|---|
| Economic Downturn | "Are our NPLs rising across all sectors, or are they concentrated in industries sensitive to the business cycle, like construction or retail?" | NPL data segmented by industry (NAICS code), loan type, and geographic region. |
| Underwriting Standards | "Do loans originated during a specific period (e.g., Q4 2022) show a higher default rate than other vintages? Did we change our credit policy then?" | Loan performance data segmented by origination date (vintage analysis). |
| Concentration Risk | "Is a single large borrower, geographic area, or industry driving the majority of our new non-accruals?" | Loan-level data to identify concentrations by borrower, MSA/county, and collateral type. |
| Product-Specific Flaw | "Is a particular loan product, like our new small business line of credit, underperforming compared to the rest of the portfolio?" | NPL and delinquency data segmented by loan product code and marketing campaign. |
Asking these questions transforms the NPL ratio from a passive indicator into an active diagnostic tool, directing your team to the source of the problem.
Looking Beyond Your Own Walls
Internal analysis is only half the equation. It must be placed within the context of the broader economy. Macroeconomic factors, such as rising loan interest rates, often expose latent portfolio weaknesses by increasing borrower stress across the board. The European sovereign debt crisis provided a stark lesson, with Greece’s NPL ratio skyrocketing to over 40%, crippling its banking sector and demonstrating how severe economic shocks can overwhelm even well-managed institutions.
Diagnosing the root causes of NPLs isn't an accounting exercise; it's a core strategic function. It’s about moving from "what" the NPL ratio is to "why" it's changing, and then using data to take precise, effective action.
By combining rigorous internal data segmentation with an awareness of external pressures, bank leaders can develop an accurate, comprehensive view of portfolio health. This data-driven approach is essential for deploying resources effectively, correcting underwriting flaws, and protecting the bank’s bottom line.
Getting Ahead of NPLs: Proactive Strategies That Work
A reactive approach to non-performing loans is a recipe for eroding profits and attracting regulatory oversight. Proactive leadership understands that managing the non-performing loans ratio is not about damage control; it is about preemption. The optimal strategy is a three-pronged approach: prevent weak loans from entering the portfolio, identify early signs of distress, and act decisively when a loan deteriorates. This data-driven discipline transforms risk management from a defensive necessity into a competitive advantage.
Build a Stronger Wall: Data-Driven Prevention
The most cost-effective NPL is the one never originated. This begins with robust, data-informed underwriting. While all banks have credit policies, top-performing institutions continuously refine their models based on historical performance. By analyzing past defaults, you can identify the specific characteristics that signal a high probability of future distress.
For example, a community bank might discover through vintage analysis that commercial real estate loans under $1,000,000, with loan-to-value ratios exceeding 75%, originated for businesses less than three years old, default at a rate 300% higher than the rest of its CRE portfolio. This is not a generic industry statistic; it is a powerful, proprietary insight. It allows the bank to tighten underwriting standards for that specific niche without curtailing other profitable lending activities. Data intelligence platforms provide the tools to perform this type of analysis, ensuring underwriting standards reflect current realities, not outdated assumptions.
Set Up the Tripwires: Robust Early-Warning Systems
Once a loan is on the books, the focus shifts to early detection. An effective early-warning system (EWS) identifies loans showing subtle signs of distress long before they reach 90-day delinquency. These systems use data analytics to monitor for changes in borrower behavior. Key indicators can include:
- Payment Patterns: A borrower who historically paid early begins consistently paying on the last day of the grace period.
- Covenant Breaches: Minor, recurring breaches of financial covenants, even if subsequently cured.
- External Information: Negative news, adverse public filings, or signs of stress in a commercial borrower's industry.
In practice, a bank's predictive model might learn that when a commercial client's payments become progressively later and their quarterly revenue declines by 10%, the probability of default within 180 days increases significantly. This system can flag the loan 60 to 90 days before it becomes officially non-performing, giving the workout team a critical head start.
Act Fast and Smart: Decisive Resolution Strategies
When a loan becomes non-performing, time is of the essence. A decisive, data-backed resolution plan separates a manageable loss from a major one and frees up resources to focus on revenue generation. The appropriate strategy depends on the specific loan and borrower circumstances.
- Workouts & Restructuring: For a fundamentally sound borrower facing temporary hardship, a structured workout is often the optimal solution. This requires a rigorous analysis of their capacity to recover.
- Foreclosure & Asset Sale: When there is no viable path to recovery, swift action to take control of collateral and liquidate is necessary to mitigate losses.
- Selling the Non-Performing Loan: In some cases, selling the NPL to a third party provides the cleanest resolution. It crystallizes the loss, removes the asset from the books, and immediately frees up capital.
These decisions should be guided by data, not emotion. By analyzing historical recovery rates on past NPLs—segmented by loan type and collateral—you can build a framework to answer the critical question: "For this category of non-performing loan, which resolution strategy has historically maximized our recovery?"
Managing the non performing loans ratio is a continuous cycle of data analysis and decisive action. By embedding this intelligence into your prevention, detection, and resolution processes, you can protect the balance sheet and maintain a competitive edge. To validate your risk management framework, you must benchmark your performance against a curated peer group.
Stop Looking in the Rear-View Mirror
Managing your non-performing loan ratio using last quarter's reports is akin to driving a car while looking only in the rear-view mirror. You can see where you have been, but you are blind to the road ahead. To lead effectively, bank executives must shift from reacting to past problems to anticipating future challenges. This requires more than new software; it demands a fundamental change in governance and strategy.
Turning Raw Data into Smart Decisions
Adopting a true bank intelligence platform is about more than monitoring metrics; it is about connecting disparate data points to reveal the larger strategic picture. With this capability, the NPL ratio transforms from an isolated, lagging indicator into a predictive narrative that you can interpret and act upon.
This modern approach is founded on several core principles:
- Real-Time Peer Benchmarking: Understand your true competitive standing. Move beyond national averages and compare your NPL ratio and portfolio health against a curated group of direct competitors in near real-time.
- Deep Portfolio Segmentation: Pinpoint the precise sources of stress. Segment NPL data by industry, geography, and loan type to identify pockets of risk before they metastasize.
- Early Trend Identification: Gain foresight. Predictive tools can flag at-risk loans months before they appear in financial reports, enabling proactive intervention.
- Data-Informed Strategic Planning: Enter board meetings with objective evidence. Use data to refine underwriting, optimize collection strategies, and allocate capital to its most productive use.
Good data transforms risk management from a defensive function into a powerful strategic weapon. It provides the clarity needed to not only protect the balance sheet but also to confidently identify opportunities for prudent, profitable growth.
The next logical step is to see this capability in action. A dedicated bank intelligence platform like Visbanking delivers insights tailored to your bank's specific challenges and strategic objectives.
Common Questions We Hear About the NPL Ratio
What’s a Good Non-Performing Loan Ratio, Anyway?
There is no single "good" NPL ratio. Context is paramount. While the U.S. national average often falls below 1.0%, the optimal ratio for your institution depends on its strategic risk appetite. A growth-oriented community bank in a dynamic market might accept a 1.1% ratio to gain market share, whereas a more conservative institution may target a ratio below 0.5%.
The only benchmark that truly matters is your performance relative to a carefully selected peer group of banks with a similar asset size, geographic footprint, and business model. A "good" ratio is not just low; it is stable or improving relative to your direct competitors. Achieving this level of insight requires robust data intelligence.
How Often Should Our Board Be Looking at NPL Trends?
The NPL ratio and its underlying trends should be a standing agenda item at every board meeting. Management’s presentation must go beyond the current number to include trend lines over recent quarters and, critically, a comparison against the peer group. A quarterly review is the minimum standard for sound governance.
During periods of economic uncertainty or shifts in lending strategy, the risk committee should conduct a more frequent—at least monthly—deep dive. The discussion must progress from "what" the number is to "why" it is changing and what actions are being taken.
What Are the Hidden Costs of a High NPL Ratio?
Loan loss provisions are only the most visible cost. A high NPL ratio acts as a drag on performance and erodes shareholder value in several less obvious ways:
- Resource Diversion: Your most talented personnel are consumed with managing problem assets instead of originating new, profitable business—a significant opportunity cost.
- Reputational Risk: A rising NPL ratio signals potential weaknesses in credit risk management to investors, depositors, and regulators.
- Increased Operating Costs: A deteriorating credit profile can increase the cost of capital and may lead to higher FDIC insurance premiums.
- Intensified Regulatory Scrutiny: A high NPL ratio invites deeper and more frequent regulatory examination, consuming significant management time and attention.
These indirect costs compound, turning a credit quality issue into a significant strategic impediment.
Effective oversight depends not on static, historical reports, but on dynamic, contextual intelligence. Visbanking provides the granular peer data and deep portfolio insights required to transform your NPL ratio from a backward-looking metric into a tool for proactive, strategic decision-making.
Explore the Visbanking platform to see how your bank truly measures up.
Related Articles

Visbanking Blog
The Hidden Truth About Bank Loan-to-Deposit Ratios in Crisis

Visbanking Blog
How Bank Efficiency Ratios Reveal Hidden Operational Costs

Visbanking Blog
<strong>The Ultimate Guide to Bank Loans: How to Find the Best Deal and Avoid Getting Burned</strong>

Visbanking Blog
Capital Banking in the USA: An Overview of Investment Services, Financial Instruments, and Regulations

Visbanking Blog
Bank Efficiency Ratio Explained: What 60% Really Means

Visbanking Blog