Understanding Net Interest Margins
Brian's Banking Blog
At its very heart, a bank's net interest margin (NIM) is its pulse. It’s the single most important vital sign telling you how profitable its core business really is. Think of it simply: it's the difference between the interest a bank earns on loans and the interest it pays on deposits. For anyone trying to gauge a bank’s health, stability, and where it's headed, this number is everything.

What Net Interest Margin Is Really Telling You
Let's break it down. Imagine you're running a high-end fruit stand. You buy apples from a local orchard for $1 and sell them for $2. That $1 difference is your margin. Simple enough, right?
Banking is the same game, just with a different product: money.
A bank takes in deposits—your checking, savings, and CDs—and pays a little interest for the privilege. Then, it turns around and lends that same money out through mortgages, car loans, and business lines of credit at a higher interest rate. The gap between those two rates, measured against all the assets the bank has that are earning interest, gives you the net interest margin.
This one percentage tells a powerful story about how well a bank is being run.
To make this crystal clear, here’s a quick breakdown of what NIM really shows us.
Net Interest Margin at a Glance
| Concept | What It Measures | Why It Matters |
|---|---|---|
| Core Profitability | The spread between interest income and interest expense, relative to earning assets. | It’s the primary driver of a bank's bottom line. |
| Operational Efficiency | How effectively the bank prices loans and manages its cost of funds. | A strong NIM signals a well-managed, sustainable business model. |
| Strategic Direction | The bank's risk appetite and focus (e.g., high-risk loans vs. safe securities). | It reveals the strategic choices management is making behind the scenes. |
This table sums it up nicely: NIM isn't just a number on a page; it's a direct reflection of a bank's core identity and performance.
A Barometer for Profitability and Efficiency
A healthy NIM is a clear sign that a bank knows what it's doing. It means the team is pricing its loans smartly to generate solid returns while keeping a tight lid on what it costs to bring in deposits. When you see a bank with a consistently strong margin, you're looking at an institution with a robust business model that can handle the bumps and bruises of a changing economy.
On the flip side, a shrinking NIM is one of the first red flags to pop up. It could be screaming a few different things:
- The Competition is Heating Up: Other banks or hungry fintechs might be in a price war, forcing the bank to slash its loan rates or hike deposit rates just to keep customers.
- Poor Asset Management: The bank might be sitting on too many low-yield assets or just failing to find good, profitable places to lend its money.
- Funding Costs are Spiraling: If a bank is leaning too heavily on expensive funding, that cost will chew right through its profit spread.
Strategic Insights and Market Position
Beyond profit and loss, NIM gives you a peek directly into a bank's playbook. A bank sporting a higher-than-average NIM? It's likely taking on more risk, maybe specializing in higher-yield consumer loans. One with a lower margin is probably playing it safe, loading up its portfolio with ultra-secure government bonds.
A bank's NIM is a direct reflection of its risk appetite and market strategy. It shows whether the bank is chasing aggressive growth with higher-yield products or putting stability first with a more conservative portfolio.
This metric is also a product of its environment. For instance, back in 2015, Argentina’s banking sector reported a whopping net interest margin of 10.44%. Meanwhile, markets like Australia and Austria were humming along at 1.67% and 1.1%, respectively. Why the huge gap? It all comes down to different regulations, economic realities, and how fierce the local competition is. If you're curious, you can explore more global banking margin data to see just how much this can vary.
Alright, let's get into the nuts and bolts of calculating the net interest margin. Theory is great, but to really get a feel for NIM, you have to roll up your sleeves and see how the numbers come together.
Don't worry, it's not as complex as it sounds. The formula is actually a pretty neat reflection of a bank's entire business model. At its core, it's one of the most important key financial ratios for understanding a bank's profitability and how efficiently it's running.
The formula itself is beautifully simple, boiling everything down to a single, powerful percentage.
Net Interest Margin (NIM) = (Interest Income - Interest Expense) / Average Earning Assets
To make sense of this, we need to unpack each of those three pieces. Once you understand what goes into them, you’ll see the story the final number is telling about a bank's performance.
This infographic gives you a great visual breakdown of what influences each part of the NIM calculation.
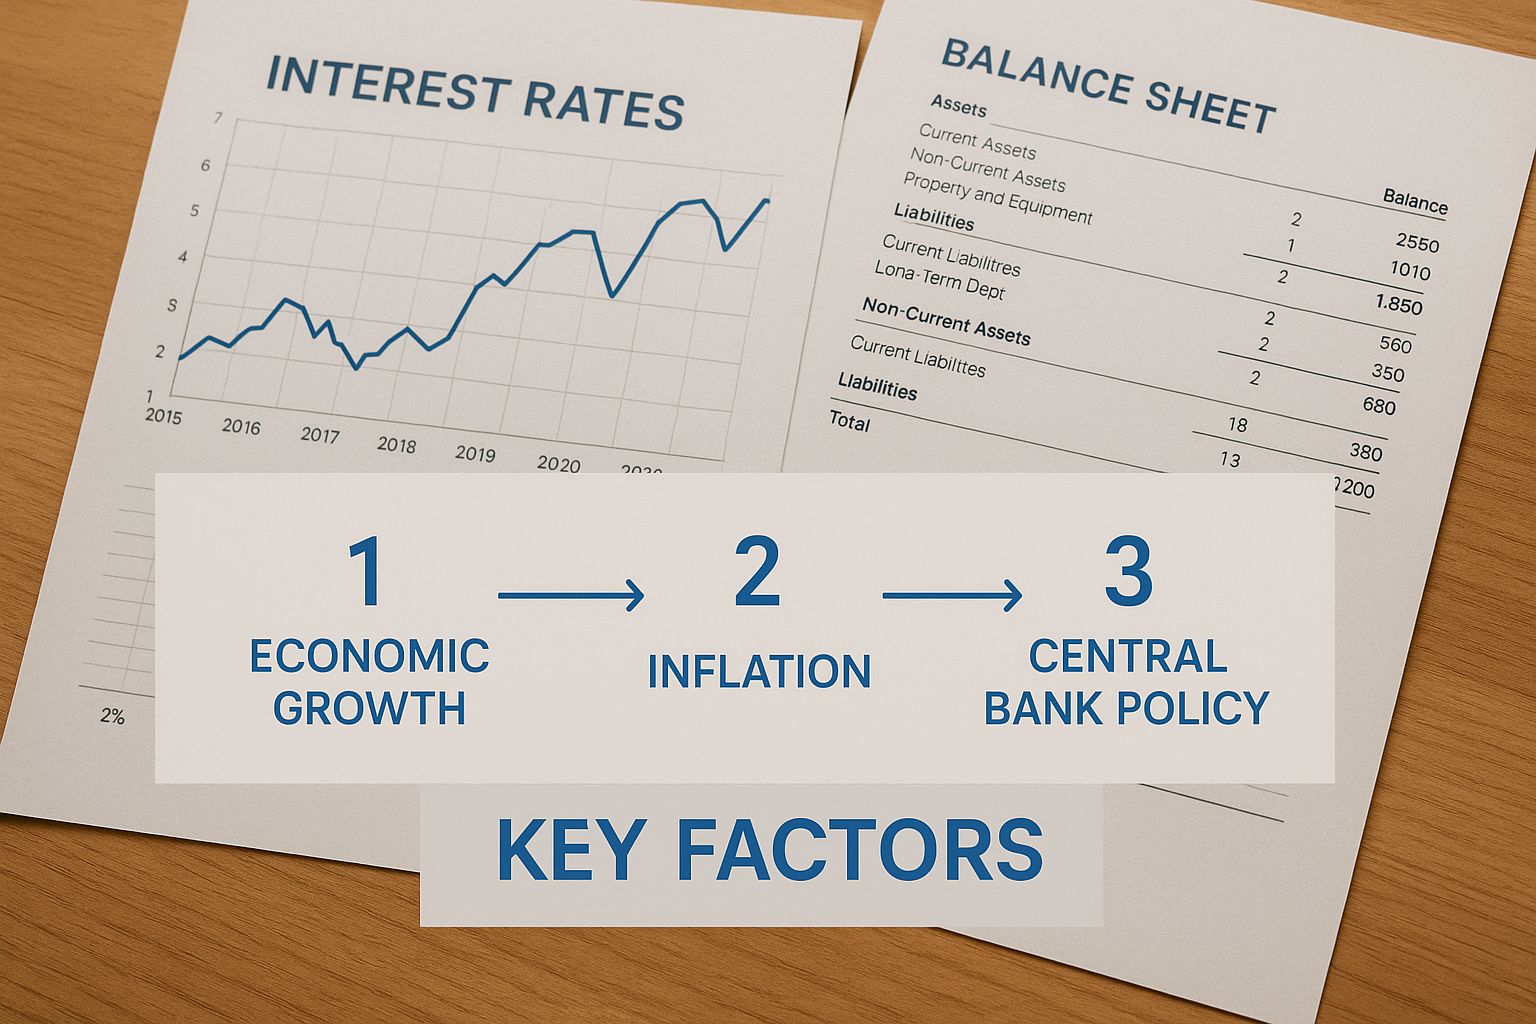
As you can see, everything from the Fed's latest rate decision to your own bank's strategic choices feeds directly into your income, expenses, and asset base.
The Three Core Components of NIM
1. Interest Income Think of this as the revenue your bank brings in from all its interest-earning assets. It’s the "sale price" for the money you've put to work. This cash flows in from all corners of the bank:
- Interest earned from commercial and industrial loans.
- Payments coming in from personal loans, like car loans and credit cards.
- Revenue from both residential and commercial mortgages.
- Interest from securities the bank holds, such as government bonds.
2. Interest Expense This is the other side of the coin—what your bank pays to get the funds it lends out. In retail terms, this is your "cost of goods sold." The bulk of this expense comes from:
- Interest paid out to customers on their savings and money market accounts.
- Interest on time deposits, like Certificates of Deposit (CDs).
- The cost of borrowing from other banks or even the central bank.
3. Average Earning Assets This represents the total dollar value of all the assets your bank holds that actually generate interest income. It's critical to use an average here. Why? Because a bank’s balance sheet is constantly in motion, and assets can swing wildly during a reporting period.
By taking the earning assets at the beginning of the period, adding them to the assets at the end, and dividing by two, you get a much more stable and realistic picture of the asset base you were working with.
Putting It All Together: A Practical Example
Let's walk through a quick calculation for a fictional bank, "Main Street Bank," over a single year.
- Annual Interest Income: Main Street Bank earned a solid $150 million from its loan and securities portfolio.
- Annual Interest Expense: The bank paid out $50 million in interest on deposits and other borrowings.
- Average Earning Assets: For the year, the bank's average earning assets sat at $2 billion.
Now, let's plug these numbers into our formula:
First, find the Net Interest Income: $150 million (Interest Income) - $50 million (Interest Expense) = $100 million
Next, divide that by your Average Earning Assets: $100 million (Net Interest Income) / $2 billion (Average Earning Assets) = 0.05
Finally, turn it into a percentage: 0.05 x 100 = 5.0%
There you have it. Main Street Bank’s net interest margin for the year is 5.0%. That single number tells you exactly how well the bank did at turning its $2 billion in earning assets into real profit.
How to Benchmark a Bank's NIM
A bank’s Net Interest Margin (NIM) is a powerful number, but on its own, it doesn’t tell you much. Is 4% a great NIM? Is 2.5% a red flag? The only real answer is: "it depends." To get the full story on a bank's performance, you have to put its NIM into context.

This is where benchmarking comes in. It's the key to unlocking what that number really means. By comparing a bank’s NIM against its own history, its closest competitors, and the wider industry, you can turn a single data point into a compelling narrative about strategy, market position, and resilience.
Unpacking Historical Trends in the US
A bank’s current NIM is just one chapter in a much longer story, one that's heavily influenced by big economic shifts. Looking back reveals how an institution has navigated changing currents, especially those driven by monetary policy. Just think about the immense pressure banks faced during the long stretch of low interest rates after the 2008 financial crisis.
Net interest margins in the U.S. have always moved with the rhythm of economic cycles and Federal Reserve decisions. Data from the World Bank shows the U.S. bank net interest margin sat around 2.77% in 2021. This reflects a slow slide from the 3.0% to 4.0% range that was common in the two decades prior, a direct result of that sustained low-rate environment. To see how these dynamics played out over time, you can explore more U.S. banking data and trends.
Even with that pressure, U.S. banks have proven to be remarkably adaptable. Many defended their margins by branching out into fee-based services and fine-tuning their funding mix, showing that smart strategy can push back against macroeconomic headwinds.
Comparing Against Industry Peers
Let's be clear: no two banks are the same. A massive money-center bank operates in a different universe than a small community bank focused on agricultural lending. This is why comparing a bank to its actual peers is so critical.
You can build a solid peer group by looking at a few key factors:
- Asset Size: Grouping banks of a similar scale is the first step to an apples-to-apples comparison.
- Geographic Focus: A bank in a booming urban center has different challenges and opportunities than one in a quiet rural market.
- Business Model: Compare banks that have similar loan portfolios, whether it's commercial real estate, consumer loans, or something else entirely.
When you analyze how a bank's NIM measures up against its direct rivals, you start to spot the outliers. Is one bank's NIM significantly higher? It could point to a brilliant strategy or perhaps a riskier loan book. A lower NIM might signal tough local competition or some operational drags.
A peer group benchmark answers the most important question: "Given our market and conditions, how are we really doing compared to the other players in our league?"
For anyone wanting to see what top-tier performance looks like, our analysis of the top banks by net interest margin offers a fantastic snapshot. It’s the kind of context that helps you understand what truly separates the leaders from the rest.
A Global Perspective on Net Interest Margins
Zooming out to the global stage adds another fascinating layer. Margins can vary wildly from one country to the next, shaped by completely different economic and regulatory landscapes.
- Mature Economies (e.g., Western Europe, Japan): These markets are often defined by fierce competition, savvy consumers, and slow growth. The result? Net interest margins are usually much thinner.
- Emerging Markets (e.g., Latin America, Southeast Asia): These regions can offer higher economic growth, less crowded banking sectors, and a higher perception of risk. This mix frequently leads to much wider margins for banks.
Grasping these global nuances is non-negotiable for investors and analysts looking at international banks. A NIM that would be celebrated in Germany might be considered just average in Brazil. It’s a powerful reminder that "good" is always relative to the operating environment and the risks of the game.
The Forces That Shape Net Interest Margins
A bank's net interest margin isn't some static number on a report. Think of it more like the vital signs of a living, breathing business—constantly changing in response to the world around it and the choices it makes.
To really get a handle on why a bank’s profitability goes up or down, you have to understand these forces. It’s a lot like sailing. The wind and the currents are the external pressures you can’t control, but how you set your sails and steer the boat—that’s your internal strategy. And that’s what determines if you win the race.
These drivers fall into three buckets: the big-picture economy, the dog-eat-dog competitive world, and—most importantly—the specific moves a bank makes on its own chessboard.
Macroeconomic Forces and Your Margin
Every bank plays on the same economic field. These massive, economy-wide factors set the rules of the game for everyone, and while a single bank can’t change them, it absolutely must react to them.
Two of the biggest players on this field are:
- Central Bank Interest Rate Policies: This is the big one. When the Federal Reserve hikes rates to fight inflation, banks get to charge more for new loans almost immediately. This can cause net interest margins to pop, as their lending rates reset much faster than what they pay out on deposits. On the flip side, when the Fed cuts rates, margins get squeezed hard.
- Inflation and Economic Growth: High inflation can be a tricky beast. On one hand, it usually comes with those higher interest rates that help margins. But it also means a bank's own costs—from salaries to software—are going up. More importantly, it can strain borrowers, leading to higher credit risk. The overall pace of the economy also drives the demand for loans in the first place, which is fundamental to putting assets to work.
If you zoom out, the global average net interest margin has been on a slow, two-decade slide. It’s a trend that tells a story about huge shifts in the world economy. Data from the World Bank shows that margins that used to hang around 5.9% have fallen to nearly 3.0% in recent years—and even lower in hyper-competitive markets. Why? A perfect storm of more competition, tougher regulations after 2008, and years of rock-bottom interest rates. You can see the numbers for yourself and explore the global financial development data.
The Competitive Landscape
No bank is an island. The fight for customers is real, and it comes from every direction—other traditional banks, local credit unions, and all the slick fintech companies popping up. This competition has a direct, and often painful, effect on a bank's ability to set its own prices.
When a market gets crowded, it often kicks off a price war. Banks start dropping their loan rates or bumping up what they pay on savings accounts just to keep the customers they have or attract new ones. This directly compresses the spread between what a bank earns and what it pays out, making a healthy margin a much tougher goal to achieve.
Bank-Specific Strategies and Levers
A bank can't tell the Federal Reserve what to do, but it has total control over its own playbook. This is where the pros separate themselves from the amateurs. The internal decisions a bank makes are the real levers for shaping its success.
Here’s where the magic happens:
- Asset and Liability Mix: This is ground zero for margin management. A bank that can strategically tilt its loan portfolio toward higher-yielding assets—like commercial real estate or consumer credit—is actively pumping up its interest income. On the other side of the coin, it’s all about attracting cheap money. Low-cost core deposits from checking and savings accounts are the fuel that keeps funding costs down.
- Credit Risk Management: A high-yield loan is fantastic... until the borrower stops paying. Chasing high returns without smart, disciplined underwriting is a recipe for disaster. Big loan losses can wipe out interest income and crater profitability. Great risk management is about making sure the potential reward is truly worth the risk.
- Interest Rate Risk Management: How a bank sets up its balance sheet for future rate changes is a defining strategic choice. This is the heart of asset-liability management (ALM)—insulating the margin from getting hammered by sudden rate swings. We cover this in-depth in our guide to managing interest rate risk and its impact on your bottom line.
- Operational Efficiency: Every dollar not wasted on inefficient operations is a dollar that pads the bottom line. Banks that use technology to make everything from opening an account to processing a loan faster and cheaper have a built-in advantage. That efficiency creates a cushion that helps protect the margin, especially when the economy gets rough.
Here is the rewritten section, crafted to match the specified human-written, expert tone.
Actionable Strategies for Improving NIM
Knowing what shapes your net interest margin is one thing. Actually taking the wheel and steering it is something else entirely. The best banks don’t just sit back and let the economy dictate their fate. They have a playbook, a set of specific strategies they use to protect and even grow their margins, especially when the pressure is on.
This isn't about finding some magic button. Improving your net interest margins is a disciplined game played on multiple fronts. It’s about fine-tuning your assets, clamping down on funding costs, pricing with intelligence, and managing risk with a sharp eye. Think of it as a constant balancing act where small, steady tweaks add up to a big impact on your bottom line.
Optimize Your Asset Mix and Yield
The straightest line to a healthier margin? Get more out of your assets. This means strategically nudging your loan portfolio and investment securities toward higher-yielding options, but without getting reckless with risk.
Here’s how you can get proactive with your asset yield:
- Lean into Higher-Yielding Loans: Every bank has its specialty, but it pays to look for opportunities in areas like commercial and industrial (C&I) lending or specific consumer loan types that can give your average asset yield a real lift.
- Embrace Government-Backed Lending: Programs from the Small Business Administration (SBA) are a fantastic one-two punch. Not only do the government guarantees dial down the credit risk, but you can also generate a nice stream of non-interest income by selling the guaranteed portions in the secondary market.
- Diversify Geographically: Putting all your lending eggs in one local basket is a risky game. Expanding into new regions, whether directly or through partners, lets you tap into stronger economic climates and insulates your portfolio from a hometown downturn.
Get Aggressive with Funding Costs
What you pay for your funds is just as critical as what you earn on your assets. This cost is the single biggest thing eating into your interest income. The goal here is simple: bring in and hold onto the cheapest funding you can possibly find.
The holy grail in banking has always been the low-cost core deposit. Money from non-interest-bearing checking and low-rate savings accounts is the absolute lifeblood of a healthy net interest margin. It can dramatically slash your bank's overall cost of funds.
Here are a few ways to drive those costs down:
- Grow Your Core Deposits: This is where you invest in marketing, tech, and good old-fashioned relationship banking to attract and keep those sticky, low-cost accounts from both your retail and business clients.
- Optimize Your Deposit Mix: You need to actively manage the balance between expensive CDs and brokered deposits versus your cheap core deposits. High-rate products have their place, but relying on them too heavily will squeeze your margin dry over time.
- Get Smart with Deposit Pricing: Use data to set your rates with surgical precision. Instead of a blanket high rate for everyone, you can run targeted promotions for rate-sensitive customers while keeping your loyal, less-fussy depositors at a lower cost.
Master Your Pricing Strategy
Getting your pricing right is a true art form. It's that sweet spot where market trends, risk assessment, and customer relationships all meet. Nailing it for both loans and deposits is absolutely fundamental to a strong net interest margin. It’s time to move past the "one-size-fits-all" rate sheet and get more dynamic.
For loans, risk-based pricing is non-negotiable. You have to price each loan so that the interest rate properly covers the credit risk of that specific borrower. A riskier loan must have a higher rate to pay for potential losses. On the flip side, for deposits, tiered pricing can be a great way to reward customers with bigger balances, helping you attract and hold onto significant, stable funding.
To help visualize how these moving parts fit together, here’s a breakdown of the key levers you can pull.
Strategic Levers to Enhance Net Interest Margin
| Strategic Lever | Description of Action | Potential Impact on NIM | Key Considerations and Risks |
|---|---|---|---|
| Asset Optimization | Shift portfolio mix toward higher-yielding loans (e.g., C&I, consumer) and securities. | Positive - Directly increases interest income and average asset yield. | Higher-yield assets often carry higher credit or interest rate risk. Requires strong underwriting and monitoring. |
| Funding Cost Control | Grow low-cost core deposits (checking, savings) and reduce reliance on high-cost funds (CDs, brokered deposits). | Positive - Directly decreases interest expense and lowers the overall cost of funds. | Intense competition for core deposits. May require investment in marketing, technology, and branch services. |
| Risk-Based Loan Pricing | Implement pricing models that accurately align interest rates with the borrower's specific credit risk profile. | Positive - Ensures the bank is adequately compensated for the risk it's taking on. | Can be complex to implement. Poor models could misprice risk, and overly aggressive pricing may alienate customers. |
| Disciplined Risk Management | Maintain strict underwriting standards and proactively monitor the loan portfolio to minimize credit losses. | Protective - Prevents charge-offs from eroding the margin earned from interest income. | Overly conservative standards could stifle loan growth. Requires a balance between risk and reward. |
Ultimately, a winning NIM strategy is a blend of offense and defense, using these levers in concert to adapt to the market.
Enforce Disciplined Risk Management
At the end of the day, none of these strategies mean a thing if your loan losses are running wild. A high-yield loan portfolio is only a winner if people actually pay you back.
Think of rigorous credit risk management as the defensive line protecting your NIM. When a loan goes bad, you don't just lose the future interest payments—you often lose a chunk of the principal, too. That's a direct hit to your profits. Strong underwriting, constant portfolio monitoring, and getting ahead of problem loans are the bedrock of protecting your margin from being eaten away by credit losses. This goes hand-in-hand with solid bank liquidity management, which ensures you have the cash to ride out economic storms without being forced to find expensive funding in a panic.
Why NIM Is a Cornerstone of Banking Success
Net interest margin is so much more than just another number on a spreadsheet. Think of it as the pulse of the bank. It tells a vivid story about a bank's strategic DNA, its standing in the marketplace, and its core ability to weather economic storms. It boils down everything from huge macroeconomic pressures to tiny internal operational tweaks into one, incredibly telling percentage.
At its heart, NIM cuts right to the chase: how healthy is the bank's fundamental business model? Are they borrowing money smartly and lending it out profitably? A strong, steady margin is a clear signal of an institution that knows how to price its products, control its funding costs, and manage risk with discipline. It’s the engine that keeps the whole operation running and profitable.
The Story NIM Tells
To really get what NIM is about, you have to look past the number and listen to the story it's telling about a bank's personality and game plan.
- Strategic Choices: Is the bank chasing high-yield, high-risk loans to fuel growth? Or is it playing the long game, prioritizing stability with a safer mix of assets? The NIM gives you the answer.
- Operational Fitness: A healthy margin often points to a lean, efficient operation. When you see broader efficiencies gained from things like banking automation solutions, you can bet it's helping to strengthen the bank's overall financial health, which NIM reflects.
- Market Resilience: Watching how a bank's NIM reacts when interest rates are soaring or plummeting shows you how well it can pivot and protect its earnings.
Building a Resilient Future
In the banking world, actively managing your NIM isn't just a good idea—it's absolutely critical for building a bank that can last and turn a profit. We've seen how it's calculated, what forces shape it, and the levers a bank can pull to nudge it in the right direction.
Net Interest Margin is the ultimate summary of a bank's performance. It reflects the quality of its decisions, the effectiveness of its strategy, and its capacity for long-term survival and success in a competitive market.
When it comes right down to it, a bank that consistently masters its net interest margin is a bank built to last. It’s proof that it has the strategic chops and the operational discipline not just to survive today, but to thrive for years to come.
Burning Questions About Net Interest Margin
As you get your hands dirty with banking analytics, a few key questions about net interest margins always seem to pop up. Think of them less as roadblocks and more as signposts, guiding you toward a much deeper understanding of what this metric really says about a bank’s health.
Let's cut through the noise and tackle these head-on.
Is a Higher NIM Always Better?
This one comes up all the time, and the quick answer is a hard no. While a high NIM looks great on paper—hey, who doesn't love strong profitability?—it can also be a red flag waving in the wind.
A bank could be juicing its margin by taking on some serious risk. Maybe they're lending to folks with shaky credit at sky-high rates or putting all their eggs in one volatile basket. When the economy takes a nosedive, those risky loans can go bad fast, wiping out any of those impressive gains. A sustainable, steady NIM that’s right in line with the competition is often a better sign of a bank that’s built to last.
A sky-high net interest margin can sometimes just be a signal of a high-risk gamble. Real strength comes from a stable, competitive NIM that shows smart management, not just a blind chase for yield.
Can a Bank Actually Have a Negative NIM?
Yes, it can happen. It's incredibly rare, and it's basically a five-alarm fire for any bank. A negative NIM means the bank is paying more for its money (deposits, borrowings) than it's earning from its assets (loans, investments).
This is completely unsustainable. It’s a clear signal that the core business model is broken. This usually points to some massive problems, like:
- A broken pricing strategy: They've completely misjudged how to price their loans to cover their costs.
- Terrible asset-liability management: Their balance sheet is a mess, leaving them wide open to getting hammered by interest rate changes.
- Brutal market conditions: An inverted yield curve, where short-term rates soar above long-term ones, can squeeze margins until they bleed.
If you ever see a negative NIM, know that the bank is in deep, deep trouble and needs an immediate overhaul.
How Do Non-Interest-Bearing Deposits Affect NIM?
Ah, non-interest-bearing deposits. These are the secret weapon for a healthy net inte
Latest Articles

Brian's Banking Blog
What Is Concentration Risk? a Guide for Bank Executives

Brian's Banking Blog
What Does Beat the Market Mean: A Guide for Financial

Brian's Banking Blog
Housing Market Analysis: Drive Lending Decisions

Brian's Banking Blog
What Is Agentic Workflow: Transforming Banking in 2026

Brian's Banking Blog
How to Improve Retention: Data-Driven Strategies 2026

Brian's Banking Blog