Decoding The NCUA 5300 Call Report For Strategic Advantage
Brian's Banking Blog
For bank executives, the NCUA 5300 Call Report is not just another regulatory filing for credit unions. It is a quarterly dossier on your competition.
This report provides a detailed, inside look at the financial health, strategic direction, and market performance of over 4,600 credit unions. For leaders who know how to interpret the data, it reveals a competitor's entire game plan—from their growth strategy and risk appetite to their specific market focus. This intelligence is critical for making informed decisions.
A Strategic Briefing For Banking Leaders
The NCUA 5300 Call Report should be viewed less as a compliance document and more as a detailed competitive playbook. Each quarterly filing contains hundreds of data points, covering everything from loan portfolio composition and delinquency rates to net worth and non-interest income. As public data, it represents one of the most powerful, underutilized tools for a bank's strategic planning.
Consider a practical example. A local credit union suddenly reports a 25% quarter-over-quarter increase in member business loans (MBLs). This is not just a number; it is a clear signal of an aggressive push into commercial lending—your territory.
Conversely, if you observe that same competitor's auto loan delinquencies have risen for three consecutive quarters, it may indicate lax underwriting standards. This insight creates an opportunity for your bank to attract their prime members with superior, more stable loan products.
Beyond Compliance To Competitive Insight
The strategic value emerges not from individual line items, but from connecting the data points to answer critical business questions:
- Which credit unions are achieving the fastest member growth in our primary market?
- Are competitors eroding our market share in specific loan categories, such as mortgages or auto lending?
- How do their efficiency ratios and return on assets (ROA) compare to ours?
- Are any showing signs of financial distress, making their members potential clients for our bank?
This is the process of converting raw data into actionable intelligence. Systematically tracking these metrics across a curated peer group provides a significant competitive advantage. Market analysis shifts from a reactive exercise to a proactive, strategic discipline.
This guide will demonstrate how to transform these public filings from complex spreadsheets into decisive, clear-eyed insights. A sophisticated data intelligence platform automates this analysis, enabling performance benchmarking and equipping your teams to act on opportunities with confidence.
Explore how Visbanking can help you translate raw call report data into a clear competitive advantage.
Turning Key Schedules Into Actionable Intelligence
View the NCUA 5300 Call Report not as a regulatory burden, but as a strategic blueprint for every credit union. For bank executives, the ability to read between the lines of these schedules differentiates market leaders from followers. A surface-level scan of the numbers is insufficient. The objective is to synthesize raw data into a coherent narrative about a competitor's strategy and execution.
It is about moving beyond the obvious. A sudden jump in assets is interesting, but discovering that the growth was driven entirely by member business loans reveals precisely where that credit union is placing its strategic bets. This is how a required report becomes a source of real-world business intelligence and analytics.
This workflow—from raw numbers to strategic decisions—is a critical executive function.
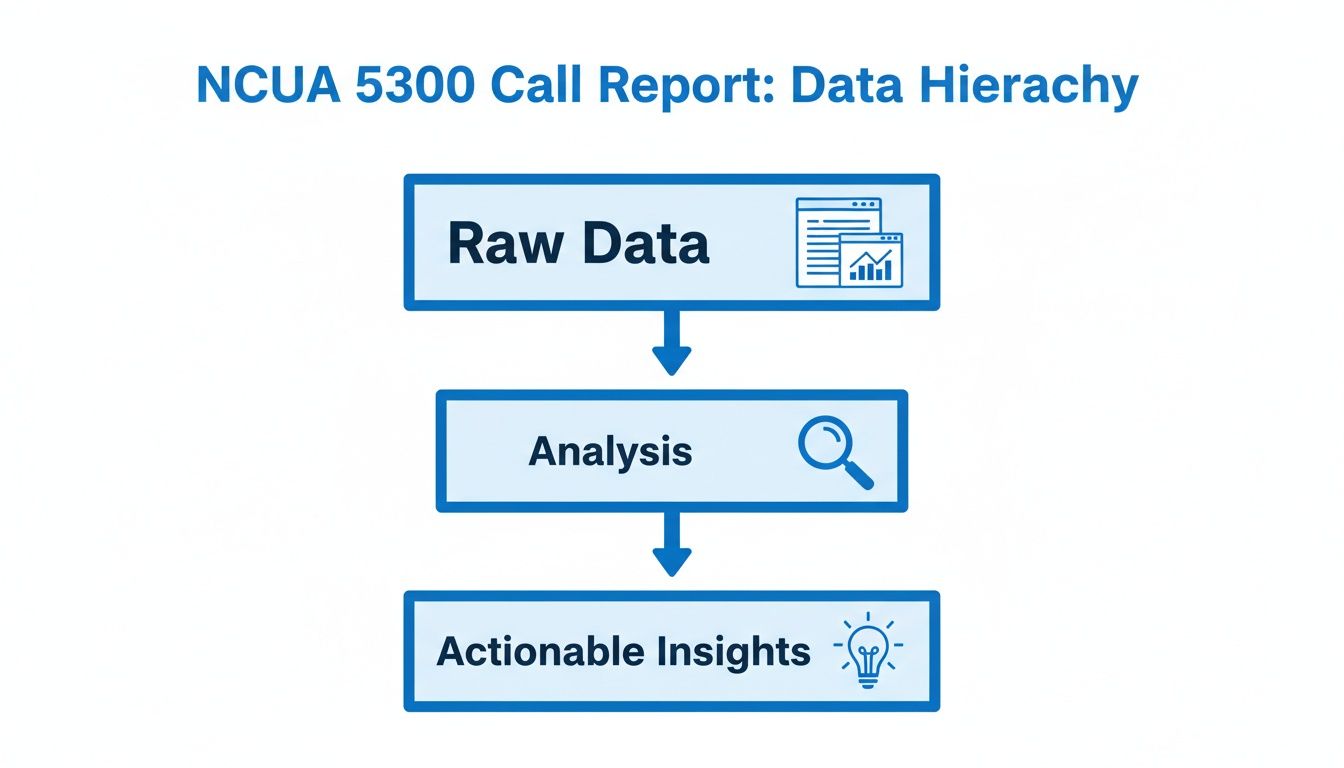
Without rigorous analysis, data is merely noise. Interpretation is what fuels decisive action.
To be practical, let's dissect the most insightful sections of the Call Report and what they reveal about a credit union's strategy and financial health.
Key NCUA 5300 Report Sections And Their Strategic Value
| Report Section / Schedule | Key Metrics & Account Codes | Strategic Insight For Executives |
|---|---|---|
| Balance Sheet | Loan Portfolio Mix (Schedule A), Member Business Loans (Account 400A), Share Composition (Schedule D) | Where is the credit union concentrating its capital? Is it aggressively pursuing commercial clients? How stable is its funding base? |
| Income Statement | Net Interest Margin (NIM), Provision for Loan & Lease Losses (Account 630), Non-Interest Income | Is its growth strategy profitable? Are early signs of credit deterioration emerging? How diversified are its revenue streams? |
| Asset Quality | Delinquent Loans & Charge-Offs, Net Worth Ratio (Account 998) | How disciplined is its underwriting? Can the institution withstand an economic downturn? Are signs of financial stress appearing? |
By focusing on these specific areas, executives can rapidly construct a competitive profile that transcends superficial assumptions.
The Balance Sheet: A Strategic X-Ray
The Statement of Financial Condition—the balance sheet—provides the clearest snapshot of a credit union's core strategy. While every line item is relevant, a few are exceptionally valuable for competitive analysis.
- Loan Portfolio Mix (Schedule A): This is the single most revealing section. A credit union with 70% of its loan portfolio in auto loans operates a fundamentally different business model and risk profile than one with 40% in real estate. Track this mix over time. If a competitor's unsecured credit card loans increase from $15,000,000 to $25,000,000 in just two quarters, it signals a deliberate strategy to pursue higher yields, accepting greater risk.
- Member Business Loans (Account 400A): For any bank with a commercial lending focus, this account code demands attention. A steady increase indicates direct competition for your clients. A credit union that grows its MBL portfolio by 15% year-over-year has evolved from a consumer lender into a direct commercial competitor.
- Share Composition (Schedule D): Analyze the funding sources. A heavy reliance on high-yield share certificates suggests pressure on net interest margin. Conversely, strong growth in core checking accounts (share drafts) indicates deep, stable member relationships.
The Income Statement: Is the Engine Running Hot or Overheating?
The Statement of Income and Expense reveals whether the strategy is effective. It answers the critical question: "Is the institution generating sustainable profit?"
For an executive, the income statement is the ultimate performance scorecard. It shows whether growth is managed profitably or if it's being "bought" with risky assets that will eventually impair earnings.
A few key metrics tell most of the story:
- Net Interest Margin (NIM): A classic indicator. A contracting NIM can mean the institution is losing the deposit war or has shifted its asset mix into lower-yielding products. It is a direct measure of core business management.
- Provision for Loan & Lease Losses (Account 630): This is your early warning system. A significant spike in provisions often precedes a wave of charge-offs. If a competitor's provisions increase 30% in a quarter while its loan portfolio grew by only 5%, it signals underlying credit quality issues that warrant deeper investigation.
- Non-Interest Income: This metric reveals diversification. Is the credit union dependent on interchange fees, or has it built substantial income streams from services like wealth management or mortgage banking?
Asset Quality: The Ultimate Litmus Test
Ultimately, a credit union's long-term viability depends on credit risk management. The NCUA 5300 provides several direct measures of underwriting discipline. The Delinquent Loans and Loan Charge-Offs schedules offer an unfiltered view of asset quality.
The Net Worth Ratio (Account 998) is the key indicator of financial strength. While the NCUA's 7% "well-capitalized" threshold is the regulatory minimum, a downward trend toward this floor is a clear signal of mounting pressure.
These schedules are the building blocks for creating a comprehensive picture of a competitor's health, strategy, and trajectory. Instead of spending hours sifting through PDFs, a platform like Visbanking automates this entire process, allowing you to track trends and benchmark against competitors in minutes. This is how you move from reviewing data to making intelligent, proactive decisions that create a competitive edge.
Spotting Red Flags and Green Lights in the Data
The NCUA 5300 Call Report is more than a regulatory filing; it is a rich source of competitive intelligence. For a discerning executive, these quarterly reports are filled with signals that can expose a competitor's vulnerabilities or highlight emerging market opportunities. The key is knowing which indicators to monitor.
This is not about relying on market rumors. The data allows you to move beyond anecdotal evidence and build strategy on hard financial facts. It is the difference between hearing a rival is "doing great" and knowing they grew their auto loan portfolio by 22% in six months while their net worth ratio remained flat—a classic indicator of capital strain.

When you analyze at this level of detail, you transform raw numbers into a tangible competitive advantage. You can pinpoint vulnerabilities, identify high-value targets, and strengthen your own market position.
Finding the Red Flags: Financial Distress and Operational Cracks
Red flags in the 5300 data are early warning signs of trouble. They suggest a credit union may be struggling with credit quality, facing internal operational issues, or experiencing capital pressure. A systematic watch on these metrics for key competitors is essential for both risk management and business development.
Monitor these classic warning signs:
- Creeping Delinquencies: A steady increase in loans 60-89 days past due is a tell-tale sign of poor underwriting or localized economic stress. For instance, if a competitor’s auto loan delinquencies rise from 0.45% to 1.15% in just two quarters, they likely pursued growth too aggressively. This is your cue to target their best members with more stable products.
- Sinking Net Worth Ratio: This ratio is the ultimate measure of a credit union's capacity to absorb losses. A downward trend, especially as it approaches the 7.0% "well-capitalized" threshold, is a major red flag. A competitor whose ratio declines from 9.5% to 7.8% in a year is likely curtailing growth, making them a less formidable threat.
- Spiking Loan Loss Provisions: A large increase in the Provision for Loan & Lease Losses that outpaces loan growth indicates that management is bracing for future charge-offs. This is often the first visible sign of anticipated credit deterioration.
These signals are more than numbers; they are strategic openings. A credit union distracted by internal credit quality issues is not focused on acquiring new business. This creates a prime opportunity for your team to gain market share.
Spotting the Green Lights: Success Stories and Market Gaps
Just as the 5300 report reveals weakness, it also illuminates strength and opportunity. By monitoring high-performing institutions, you can benchmark your own results, identify successful strategies, and even discover potential acquisition targets. These "green light" signals point to well-managed organizations with clear strategic focus.
Look for these positive indicators of a thriving competitor or an untapped market:
- Steady, Strong Member Growth: A credit union adding 500 new members per quarter in a specific county has a successful market penetration strategy. This can validate your own expansion plans or serve as a catalyst to enhance your competitive posture.
- A Superior Efficiency Ratio: An institution that consistently operates with a low efficiency ratio (e.g., under 60%) demonstrates operational excellence. Analyzing their branch network, staffing levels, and fee income structure can yield valuable insights for improving your own bank's profitability.
- Explosive Growth in Niche Loans: If a peer's RV loan portfolio grows from $5,000,000 to $15,000,000 in a single year, it is not an accident. It is a strong signal of unmet demand in a specialty market, providing a roadmap for your own product development.
An intelligence platform like Visbanking automates this surveillance. You can set up alerts for these exact metrics across any peer group. Critical insights are delivered directly to your inbox, allowing you to benchmark performance and act on opportunities the moment they arise.
Putting Raw Data Into Actionable Workflows
Data without action is an academic exercise. For banking leaders, the value of the NCUA 5300 Call Report is not in the data itself, but in how it drives intelligent, profitable decisions. The key is to integrate this intelligence from spreadsheets into the daily operations of your teams, turning raw numbers into a repeatable, strategic advantage.
A modern data intelligence platform excels at this, embedding insights from 5300 filings directly into your operational workflows. Without this integration, you are left with static reports and missed opportunities.

Let's examine two practical workflows that can have a direct impact on your bank's bottom line.
Workflow 1: Prospecting For The Commercial Banking Head
Your Head of Commercial Banking is tasked with growing the loan portfolio. The 5300 Call Report is a prospecting map, identifying credit unions that are aggressively expanding into the commercial space. These institutions are ideal targets for correspondent banking services or competitive displacement.
Manual analysis—downloading quarterly files and manipulating spreadsheets—is too slow to be effective. An automated workflow in a platform like Visbanking transforms this process.
The Actionable Process:
- Define the Target Profile: Set specific filters, such as all credit unions within a three-county radius with assets over $500,000,000 and Member Business Loan (MBL) growth exceeding 15% year-over-year.
- Generate a Dynamic Target List: The platform instantly processes the latest 5300 data to produce a ranked list. For example, it might identify that "Metro Community CU" increased its MBL portfolio from $85,000,000 to $105,000,000 in the past year—a signal that cannot be ignored.
- Enrich and Prioritize: The system can cross-reference other data sources, such as flagging that Metro Community CU recently filed UCCs for new commercial equipment. This provides a specific, timely reason for outreach. You can also analyze how different credit union core systems might create specific partnership opportunities.
- Execute and Track: This enriched target list, complete with key data points, is pushed directly into your sales team's CRM. Your team transitions from cold calling to highly targeted, data-informed engagement.
This is not just a market scan; it is a high-probability prospecting engine fueled by your competitors' actual activities.
Workflow 2: Benchmarking For The CEO And Board
Every CEO and board must answer a fundamental question with confidence: "Are we winning?" Strategic planning requires an objective assessment of performance against the real competition, which includes credit unions.
An effective benchmarking workflow provides this clarity by comparing your bank's performance against a carefully selected peer group of local credit unions.
The Actionable Process:
- Create a Custom Peer Group: Move beyond arbitrary asset-based buckets. A CEO can define a peer group based on strategic relevance—for example, "all credit unions over $1,000,000,000 in assets operating in our primary MSA."
- Select Key Performance Indicators (KPIs): Focus on the metrics that drive health and growth, such as Return on Average Assets (ROAA), Net Interest Margin (NIM), Loan Growth, and the Efficiency Ratio.
- Visualize and Identify Trends: The platform generates a dashboard comparing your bank's performance against the peer group average and top quartile performers over the last two years.
This is not a static report; it is a living diagnostic tool. A CEO can see in seconds that while the bank's loan growth is a respectable 5.5%, the credit union peer group is averaging 8.2%, driven primarily by indirect auto lending. That single insight can trigger a critical strategic discussion about market share and product focus.
Financial data from the NCUA 5300 paints a vivid picture. For instance, Q1 2025 data showed significant growth in key areas as the economy expanded. Credit card balances grew by $3.0 billion (3.7%) to $83.8 billion, while the sector's net worth ratio for prompt corrective action remained stable at 11.11%. For those who want to go deeper, the NCUA’s public data catalog is a great resource for historical filings.
By integrating NCUA 5300 data with FDIC and other market intelligence, these workflows provide the 360-degree view needed for precise execution. It is the final, crucial step from merely seeing the data to actively seizing the opportunity.
Ready to see how your institution stacks up? Explore how Visbanking turns complex call report data into your competitive advantage.
What A Late Call Report Filing Really Tells You
A credit union’s adherence to deadlines is a telling indicator of its operational discipline. For executives evaluating a competitor or a potential partner, the simple act of filing an NCUA 5300 Call Report on time is a critical—and often overlooked—piece of intelligence. A late filing is rarely just a missed deadline; it is a clear red flag signaling deeper institutional problems.
These delays often point to significant operational strain, such as an under-resourced accounting department, a problematic core system conversion, or weak internal controls. If a credit union cannot manage its own regulatory reporting, it raises serious questions about its ability to manage the more complex risks on its balance sheet. This is an invaluable insight when assessing a competitor's stability or vetting a new correspondent banking client.
The Real Price of Procrastination
The National Credit Union Administration enforces filing deadlines rigorously. The agency imposes civil money penalties on late filers because timely, accurate data is the foundation of regulatory oversight and market transparency. These fines are not merely a slap on the wrist; they are a public declaration of operational deficiency.
Late filing was once so prevalent that the NCUA was compelled to take a firm stance. At one point, over 1,000 credit unions were submitting reports late each cycle. After the agency issued an official letter promising strict enforcement, the number of late filers decreased, yet hundreds still failed to meet the deadline. Those institutions were publicly identified and fined. You can read more on these compliance challenges and their history.
For a banking leader, seeing a competitor on that public list of late filers is a strategic advantage. It indicates that the institution is occupied with internal issues and is likely not focused on winning your customers.
Turning Compliance Headaches into Strategic Wins
This compliance data serves a dual purpose. Internally, it reinforces the importance of robust systems and processes for your own institution. Understanding the expectations of the various regulatory agencies for banks and credit unions is a fundamental aspect of executive leadership.
Externally, tracking filing dates becomes a simple yet powerful competitive intelligence tool. A pattern of late submissions from a peer can be a leading indicator of trouble, often appearing long before its loan portfolio deteriorates or its net worth ratio declines.
Platforms like Visbanking integrate this compliance metadata directly into a credit union’s profile, making it simple to monitor. Instead of manually searching for filing statuses, you can receive an alert flagging late filers in your market. This transforms a single data point into a proactive signal for risk management and business development, enabling you to base decisions on a complete picture of an institution’s operational fitness.
Ready to see which of your competitors are showing signs of operational strain? Benchmark your institution against any credit union and turn compliance data into a strategic advantage with Visbanking.
Your Next Move With Data-Driven Banking
The NCUA 5300 Call Report is not a regulatory chore. It is a playbook—a detailed look into the strategy, strengths, and weaknesses of every credit union in your competitive landscape.
Market-leading bank executives are those who view these reports not as a compliance burden, but as a strategic weapon. This data contains the answers to your most pressing business questions. It reveals precisely who is gaining market share, which rivals are struggling with operational efficiency, and where the next significant opportunity lies.
From Insight to Action
Do not just observe the numbers; act on them. Every insight derived from a 5300 report should prompt a specific business action—whether it is a move to capture market share, improve profitability, or mitigate a potential risk.
For example, if a competitor's Member Business Loan portfolio grows by 20%, that is not just a statistic. It is a clear directive to mobilize your commercial banking team to defend and expand your position.
The strategic advantage is realized when the NCUA 5300 Call Report transitions from a static document into a dynamic component of your strategy. This requires moving beyond manual spreadsheets and adopting a more sophisticated approach to market intelligence.
Instead of dedicating hours to data manipulation, an intelligence platform can perform the heavy lifting, converting tedious work into rapid, high-value strategic wins. It allows you to benchmark your performance against any credit union on the metrics that matter, turning insight into immediate, decisive action.
Stop guessing your competition's strategy. See it for yourself. Explore how Visbanking can help you benchmark your institution and turn raw NCUA 5300 Call Report data into your greatest competitive advantage.
Got Questions? We've Got Answers.
Analyzing credit union data can feel like learning a new language. Here are answers to common questions from banking executives seeking to leverage the NCUA 5300 Call Report.
How Is The NCUA 5300 Report Different From A Bank's FDIC Call Report?
Think of them as two dialects of the same financial language. While both are quarterly financial and operational reports, they use distinct terminology. The NCUA 5300 uses credit union-specific terms like member shares and net worth. In contrast, FDIC reports for banks use terms like deposits and equity capital.
These structural and terminological differences make direct, manual comparisons difficult and often misleading. A true apples-to-apples comparison between your bank and a credit union requires a platform that acts as a universal translator, normalizing the data for accurate benchmarking.
How Quickly Can I Get This Data, And Can I Trust It?
Credit unions file their 5300 Call Reports by the end of the month following a quarter's close. The NCUA processes this data and makes it public a few weeks later.
The data is highly reliable. These are official, audited financial records, and the NCUA imposes significant penalties for inaccuracies. For leaders who require speed, a data provider that ingests and cleans these filings almost immediately upon submission offers a considerable timing advantage over waiting for the official public release.
What's The Best Way To Start Using This Data?
Avoid attempting to analyze everything at once. The most common mistake is diving into the vast dataset without a clear objective. Start with a single, specific business question.
Are you trying to identify the top three credit unions in your county that are dominating the auto loan market? Or do you need to benchmark your efficiency ratio against institutions of a similar size?
A focused inquiry is most effective. For example, a useful objective would be: "Identify all credit unions in our market with over $1,000,000,000 in assets whose non-interest income grew more than 10% last year."
From there, a financial data platform can filter the entire national database to your precise specifications. This process transforms a mountain of complex data into a concise, actionable list in minutes—eliminating days of manual spreadsheet work.
Your competitors are not hiding their strategies; they are publishing them quarterly. With the right tools, you can read their playbook. Visbanking automates the data analysis, enabling your team to stop reacting and start making proactive, data-driven decisions.
See how you can benchmark your bank and find your next big opportunity.
Related Articles

Visbanking Blog
Bank Call Reports: The Financial Pulse of the Banking Industry

Visbanking Blog
FDIC Call Reports: The Banking Data Goldmine Explained

Visbanking Blog
Visbanking Unveils Interactive Quarterly Banking Profile, Available One Month Ahead of FDIC Release

Visbanking Blog
Capital Banking in the USA: An Overview of Investment Services, Financial Instruments, and Regulations

Visbanking Blog
Make Better Decisions with Confidence with BIAS, the Tailored Strategies Solution

Visbanking Blog